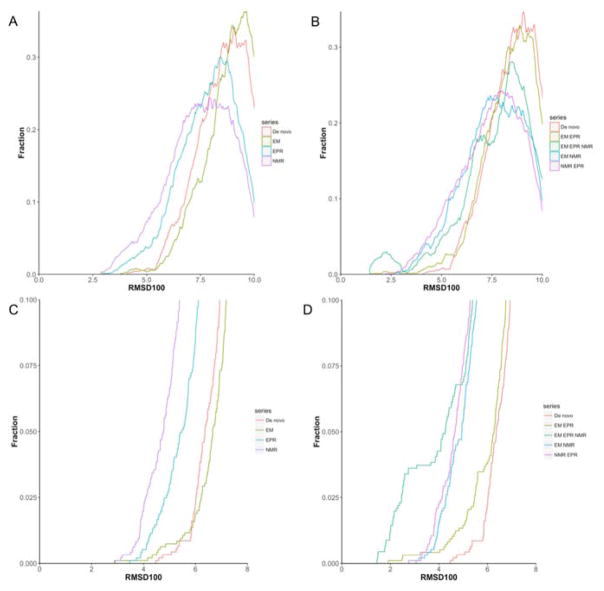
Figure 3. Prediction accuracy of low-resolution SSE assembly using hybrid experimental data.
Density distributions of structure prediction accuracies using single experimental dataset (A,C) and hybrid experimental dataset (B,D). The fraction of models versus the predicted models’ RMSD100 to the native crystal structure is shown. (A) A comparison is drawn between the sampling density for native-like models using de novo structure prediction (orange), EM (light green), EPR (blue) and NMR (purple). (C) Cumulative fraction of models that falls within 8Å RMSD, the y-axis is cut off at 0.1. (B) A comparison is drawn between the sampling density for native-like models using de novo structure prediction (orange), NMR_EPR (light green), EM_EPR (green), EM_NMR (blue) and EM_EPR_NMR (Purple). (D) Cumulative fraction of models that falls within 8Å RMSD, the y-axis is cut off at 0.1.

