Abstract
Purpose
Ductal carcinoma in situ (DCIS) is a pre-invasive lesion of the breast considered a precursor of invasive ductal carcinoma. This study aimed to determine whether activated PPARγ acts as a tumor suppressor in human DCIS progression.
Methods
We utilized the high-affinity PPARγ agonist, efatutazone, to activate endogenous PPARγ in a well-defined model for the progression of basal (triple negative) DCIS, MCFDCIS cells, cultured under 2D and 3D conditions. We studied the effects of activated PPARγ on DCIS progression in MCFDCIS xenograft and C3(1)/Tag transgenic mice treated with 30 mg/kg of efatutazone.
Results
In vitro, efatutazone did not alter the MCFDCIS cell proliferation but induced phenotypic and gene expression changes, indicating that activated PPARγ is able to differentiate MCFDCIS cells into more luminal and lactational-like cells. In addition, MCFDCIS tumorsphere formation in 3D was reduced by PPARγ activation. In vivo, efatutazone-treated MCFDCIS tumors exhibited fat deposition along with upregulation of PPARγ responsive genes in both epithelial and stromal compartments, suggesting features of milk-producing mammary epithelial cell differentiation. The efatutazone-treated lesions were less invasive with fewer CD44+/p63+ basal progenitor cells. PPARγ activation downregulated Akt phosphorylation in these tumors, although the ERK pathway remained unchanged. Similar trends in gene expression changes consistent with lactational and luminal cell differentiation were observed in the C3(1)/Tag mouse model after efatutazone treatment.
Conclusions
Our data suggest that activation of the PPARγ pathway differentiates DCIS lesions and may be a useful approach to delay DCIS progression.
Keywords: Efatutazone, PPARγ, DCIS, Breast cancer
Introduction
In 2016, over 60,000 ductal carcinoma in situ (DCIS) breast cancer cases were diagnosed in the U.S. [1]. DCIS is a precursor of Invasive Ductal Carcinoma (IDC) evolving through sequential stages, dependent upon genetic and/or epigenetic changes [2–7]. A significant portion of DCIS lesions will not progress to IDC [8–12], and to date, no diagnostic test is able to definitively predict DCIS outcome of patients. Thus, the extent of treatment of patients with DCIS is the subject of debate and the development of possible therapeutic strategies to prevent the progression of DCIS to more advanced disease is of clinical interest [13].
Peroxisome proliferator-activated receptor gamma (PPARγ) is a member of the nuclear receptor family of ligand-activated transcription factors that bind to a defined response element in the promoter of target genes [14]. The endogenous ligands for PPARγ are prostaglandins, fatty acids, and therapeutic modulators that include the thiazolidine (TZD) drugs such rosiglitazone [14]. Activation of PPARγ has profound effects on cellular differentiation, proliferation, apoptosis, metabolism, angiogenesis, and the inflammatory response in normal and cancer tissues [14]. PPARγ influences multiple cellular signaling pathways [15–17]. PPARγ functions as a tumor suppressor in rodent mammary tumors [18–20]. Consistent with this, the first-generation TZDs have some reported antiproliferative effects in mammary cancer cells [21]. However, in clinical trials, no significant benefit from these first generation TZDs was observed [22, 23]. More recently, newer, more potent, selective high-affinity, and anti-proliferative third-generation TZD agonists have been developed such as efatutazone (CS7017/RS5444) [16]. Efatutazone has demonstrated efficacy in the treatment of advanced malignancies [24]. The previous works in rodent models of breast cancer progression for the different subtypes of breast cancer have indicated that efatutazone plays a role in the proliferation, differentiation, inflammatory modulation, and metabolism of breast cancer cells [19, 25]. In the current study, we examined the effect of efatutazone on the progression of human DCIS to IDC cells on proliferation and differentiation in vitro, on tumorsphere formation in 3D, and tumor progression in vivo. For this study, we used the human MCFDCIS line which is derived from the normal mammary epithelial line MCF10A [26]. MCFDCIS cells have the rare ability to form DCIS lesions in vivo with gene expression patterns and pathology similar to human DCIS samples and undergo transition to IDC after transplantation in immune compromised mice [26–28]. Here, we report that short-term treatment with efatutazone delays progression of human DCIS, which causes features of luminal and mammary epithelial cell lactational differentiation, loss of basal progenitor cell characteristics, and reduction in Akt signaling. We propose that PPARγ activation could be a useful approach to prevent progression of a subset of the early stage breast cancers.
Materials and methods
Cell lines and cell culture
MCF10A and MCFDCIS cell lines were obtained from Dr. Susette Mueller (Georgetown University) and were cultured as described [29, 30].
In vitro drug sensitivity assays
Effects on cell phenotype were analyzed in cells treated for 72 h with different concentrations of efatutazone (Daiichi Sankyo, Tokyo, Japan). Cell morphology was examined with an Olympus IX-71 inverted epifluorescence microscope. Cell proliferation was quantified using the crystal violet staining method [31]. Lipid droplet production was assessed microscopically and after staining with Oil Red O (Sigma-Aldrich Corp., MO, US). Differential expression of genes involved in lipid production and mammary cell differentiation were investigated using quantitative real-time PCR (below).
Matrigel tumorsphere formation assay
Matrigel tumorsphere formation assay was conducted as described [29, 30]. Tumorspheres were photographed at day 8 using an Olympus IX-71 Inverted epifluorescence microscope and the percentage of tumorsphere formation (diameter ≥ 100 µm) was determined using Fiji software.
Animal models
Athymic nude mice were purchased from Envigo (Envigo, MD, US) and C3(1)/SV40 T-antigen transgenic mice (C3(1)/Tag) were donated by Dr. Jeffrey E. Green (National Cancer Institute, MD) [32]. Animals were housed in a pathogen-free environment with controlled temperature and humidity. All animal experiments were conducted in accordance with protocols approved by the Georgetown University IACUC.
In vivo drug treatment experiments
MFCDCIS xenografts in mice were performed as described [28]. Once MCFDCIS tumors became palpable, i.e., 2–3 weeks after tumor cell injection, efatutazone (Daiichi Sankyo, Tokyo, Japan)(30 mg/kg, or vehicle (dimethyl sulfoxide) control diluted in 0.5% methylcellulose and 0.2% Tween 80 was administered daily by oral gavage for 3 weeks. Similarly, 12-week-old female C3(1)/Tag mice were treated daily by oral gavage with efatutazone or vehicle control for 4 weeks. Mice were regularly monitored for signs of toxicity and the formation of palpable tumors. Animal weight and tumor area were measured twice per week. MCFDCIS xenograft and C3(1)/Tag mice were euthanized after 3 and 4 weeks of drug treatment, respectively. Tumor samples were fixed in 10% formalin and embedded in paraffin for histopathology or frozen for gene and protein expression analyses.
RNA isolation and quantitative real-time PCR
Quantitative real-time PCR (qRT-PCR) analyses of total RNA obtained from cells were performed as previously described [33]. Primers were designed using the IDT real-time PCR tool (Integrated DNA Technologies, Inc., IA) (Table 1). Gene expression levels were quantified using the comparative cycle threshold method (ΔΔCT), with relative mRNA levels determined as 2−ΔΔCT normalized to human GAPDH, β2-microglobulin, or mouse actin as housekeeping genes.
Table 1.
Primers used for qRT-PCR analyses
| Gene | Forward primer | Reverse primer |
|---|---|---|
| hPCNA | 5′- GTCTCTTTGGTGCAGCTCA -3′ | 5′- ATCTTCGGCCCTTAGTGTAATG -3′ |
| hFABP4 | 5′- CATGTGCAGAAATGGGATGG -3′ | 5′- AACTTCAGTCCAGGTCAACG -3′ |
| hPDK4 | 5′- TGAGACTCGCCAACATTCTG -3′ | 5′- TCTGGTCATCTGGGCTTTTC -3′ |
| hPLIN2 | 5′- GCTCCATTCTACTGTTCACCTG -3′ | 5′- CTCCTTTTCCACTCTACCCATG -3′ |
| hMUC1 | 5′- TCCTCACAGTGCTTACAGTTG -3′ | 5′- AGAAAGAGACCCCAGTAGACA -3′ |
| hCK8 | 5′- AAGGCACAGTACGAGGATATTG -3′ | 5′- AGATCTCAGTCTTTGTGCGC -3′ |
| hESR1 | 5′- ATCTCGGTTCCGCATGATGAATCTGC -3′ | 5′- TGCTGGACAGAAATGTGTACACTCCAGA -3′ |
| hPgR | 5′- ATTACCAGTGTTCCCGTCTTC -3′ | 5′- GTGCTCCAATAGTTCCCTGTAC -3′ |
| hCK6a | 5′- TCCCCTCAACCTGCAAATC -3′ | 5′- CCACTTTGTTTCCAGAACCTTG -3′ |
| hCK6b | 5′- AGCTGAGAAACATGCAGGAC -3′ | 5′- GCTTGCAGTTCAACCTTGTTC -3′ |
| hCK17 | 5′- AACAAGATCCTCACAGCCAC -3′ | 5′- CCATTGATGTCGGCCTCC -3′ |
| hGAPDH | 5′- CCCACATGGCCTCCAAGGAGTA -3′ | 5′- GTCTACATGGCAACTGTGAGGAGG -3′ |
| hβ2m | 5′- CTTAGCTGTGCTCGCGCTACTCT -3′ | 5′- CCATTCTCTGCTGGATGACGTGAGT -3′ |
| mFABP4 | 5′- GACAGGAAGGTGAAGAGCATC -3′ | 5′- GTCACGCCTTTCATAACACATTC -3′ |
| mPDK4 | 5′- AGTGACTCAAAGACGGGAAAC -3′ | 5′- GTGTGAGGTTTAATTCTGGCG -3′ |
| mPLIN2 | 5′- GGATAAGCTCTATGTCTCGTGG -3′ | 5′- GTCTGGCATGTAGTCTGGAG -3′ |
| mCK8 | 5′- TGTTGAGCCCCTTGAAGC -3′ | 5′- GGTCTCCAGCATCTTGTTCTG -3′ |
| m CK18 | 5′- ACACCAACATCACAAGGCTG -3′ | 5′- TTCCACAGTCAATCCAGAGC -3′ |
| mESR1 | 5′- AACCGCCCATGATCTATTCTG -3′ | 5′- AGATTCAAGTCCCCAAAGCC -3′ |
| mPgR | 5′- TGAGCCTGATGGTGTTTGG -3′ | 5′- ACAGCGAGTAGAATGACAGC -3′ |
| mACTIN | 5′- ATTTCTGAATGGCCCAGGTC -3′ | 5′- GCTGCCTCAACACCTCAA -3′ |
MUC1 mucin 1, CK cytokeratin, ESR1 estrogen receptor 1, PgR progesterone receptor, β2m β2-microglobulin
Histology and immunohistochemistry analyses
Paraffin-embedded tissues were sectioned and stained by the Lombardi Comprehensive Cancer Center Histopathology & Tissue Shared Resource using standard protocols [34]. Primary antibodies (CD44, p63, Cytokeratin 8 (CK8), and PCNA) used for IHC are detailed in Table 2. Images were captured using an Olympus BX40 microscope. The percentage of tumor cells with nuclear staining for p63 and PCNA were scored within DCIS lesions, while CD44- and CK8-positive cells were quantified based on a complete membranous staining in five representative fields using Fiji software.
Table 2.
Antibodies used for immunohistochemistry and western blot analyses
| Antibody | Source | References | Clone | Species | Dilution |
|---|---|---|---|---|---|
| CD44 | ThermoFisher Scientific Inc. | MA1-39422 | SPM521 | Mouse | 1:75 |
| P63 | Santa Cruz Biotechnology | sc-8431 | 4A4 | Mouse | 1:400 |
| Cytokeratin 8 | Abcam | ab59400 | Rabbit | 1:100 | |
| PCNA | Santa Cruz Biotechnology | sc-7907 | FL-261 | Rabbit | 1:300 |
| Phospho-Akt (Ser473) | Cell Signaling | 4051 | 587F11 | Mouse | 1:1000 |
| Total Akt | Cell Signaling | 9272 | Rabbit | 1:1000 | |
| Phospho-ERK1/2 (Thr202/Tyr204) | Cell Signaling | 9101 | Rabbit | 1:1000 | |
| Total ERK1/2 | Cell Signaling | 9102 | Rabbit | 1:1000 | |
| Actin | Millipore | MAB1501 | C4 | Mouse | 1:3000 |
Protein extraction and western blot analysis
Protein lysates were isolated from frozen tumor tissues, and western blot analyses were carried out as previously described [35]. Primary antibodies (phospho-Akt (Ser473), Akt, phospho-ERK1/2 (Thr202/Tyr204), ERK1/2, and actin) used for western blot analysis are listed in Table 2. Relative band intensities were quantified by densitometry using Fiji software.
DNA microarray analysis
Total RNA was prepared from tumors as described above. RNA with an Integrity Number greater than 7.0 was used for microarray analysis which was carried out by the UCLA Neurosciences Genomics Core using Illumina HumanHT-12 v4 Expression BeadChip representing 47,000 well-annotated genes according to the manufacturer’s instructions (Illumina, Inc., San Diego, CA). GenePattern open-source software (http://software.broadinstitute.org/cancer/software/genepattern#) was utilized to quantile-normalize the microarray expression data. Differential gene expression profiles were assessed by comparing changes between paired samples and ranking genes by their log2 fold changes.
Statistics
Statistical analyses were conducted using GraphPad Prism 5 software (Graph-Pad Software, Inc., San Diego, CA, USA). Comparisons among groups were performed using the unpaired Student’s t test or the χ2 test, and were considered statistically significant if p values < 0.05.
Results
Effects of PPARγ agonist efatutazone on human DCIS cells in vitro
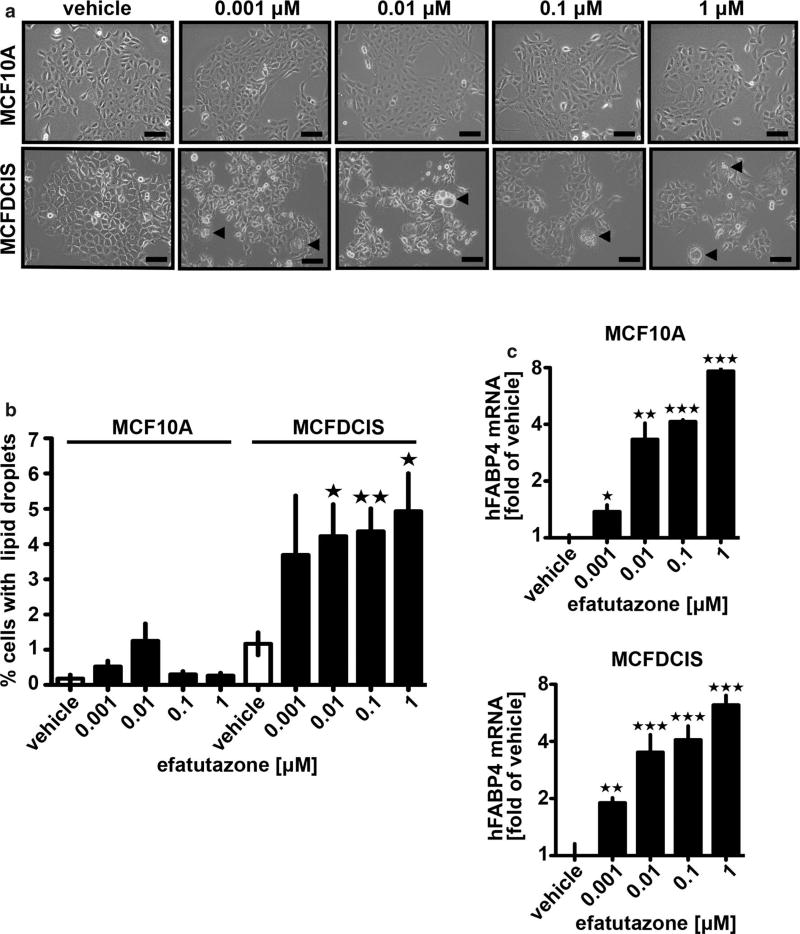
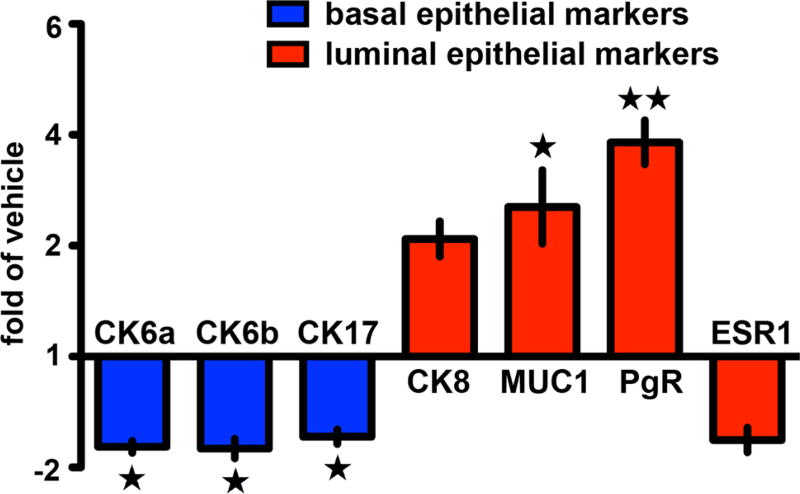
We compared the effect of efatutazone on normal human epithelial cells (MCF10A) vs human MCFDCIS cells in vitro and did not observe gross changes in the cuboidal, epithelial morphology of either cell line at concentrations between 0.001 and 1 µM, (Fig. 1a). However, we observed that > 4% of the MCFDCIS cells had visible lipid droplet accumulation (see arrows Fig. 1a, b). Identification of lipid droplets was confirmed with Oil Red O staining (Fig. S1a, b). Significantly less lipid accumulation was observed at any concentration in the MCF10A line (Fig. 1a, b). Despite the effect on lipid droplet accumulation, the proliferation rate of the MCFDCIS or MCF10A cells after efatutazone treatment as measured by crystal violet staining (Fig. S1c) or real-time qPCR of PCNA mRNA levels (Fig. S1d) was variable and did not reach significance vs control for MCFDCIS cells at most of the concentrations used. Lipid accumulation is characteristic of activation of the PPARγ pathway [36] and occurs in normal mammary epithelial cells as they differentiate into milk-producing cells [37, 38]. Consistent with the predominant effect of efatutazone being on the differentiation rather than proliferation of MCF10A or MCFDCIS cells, we found a robust induction of the PPARγ-responsive gene fatty acid-binding protein 4 (FABP4) even at the lowest concentration of efatutazone (0.001 µM) (Fig. 1c). Other PPARγ responsive genes pyruvate dehydrogenase kinase 4 (PDK4) and perilipin 2 (PLIN2) [36] trended towards increased expression after efatutazone treatment in both cell lines, but the changes were not significant due mainly to the variability of the baseline expression of these genes (Fig. S1e, f). We next compared the pattern of mRNA expression of mammary epithelial cytokeratin differentiation markers after efatutazone treatment. Although we saw no significant changes in MCF10A cells, in MCFDCIS cells, we observed loss of expression of the basal cytokeratin markers CK6a, CK6b, and CK17 while gaining expression of the luminal marker CK8 [39] (Fig. 2). Interestingly, in MCFDCIS cells, efatutazone also increased the expression of other luminal markers such as progesterone receptor (PgR) and mucin 1 (MUC1)(Fig. 2). Despite the induction of PgR, we detected only low levels of estrogen receptor (ESR1) mRNA levels in the MCFDCIS cells that were unaltered by efatutazone treatment (Fig. 2). Overall, these data suggest that in vitro basal characteristics of MCFDCIS cells can be partially reverted to a more luminal and lactational-like phenotype by efatutazone treatment.
Fig. 1.
Efatutazone treatment enhances features of mammary epithelial cell lactational differentiation. a Representative phase-contrast images of MCF10A (upper panel) and MCFDCIS cells (lower panel) treated 72 h with vehicle or increased concentrations of efatutazone. Scale bar = 100 µm. Cells containing visible lipid droplets are indicated by arrows. b Quantification of the percentage of MCF10A and MCFDCIS cells with visible lipid droplets in the presence of increased concentrations of efatutazone using Fiji software. c qRT–PCR analysis of human FAPB4 mRNA levels in MCF10A (upper panel) and MCFDCIS cells (lower panel) treated 72 h with vehicle or increased concentration of efatutazone. Mean ± SEM (Student’s t test; n ≥ 3; *p < 0.05 vs vehicle; **p < 0.01 vs vehicle; ***p < 0.001 vs vehicle)
Fig. 2.
Efatutazone affects the expression of differentiation markers in MCFDCIS cells. Fold changes of human CK6a & b, CK17, CK8, MUC1, PgR, and ESR1 mRNAs in MCFDCIS cells treated 72 h with 0.01 µM efatutazone analyzed by qRT-PCR and compared to cells treated with vehicle. Mean ± SEM (Student’s t test; n = 3; *p < 0.05 vs vehicle; **p < 0.01 vs vehicle)
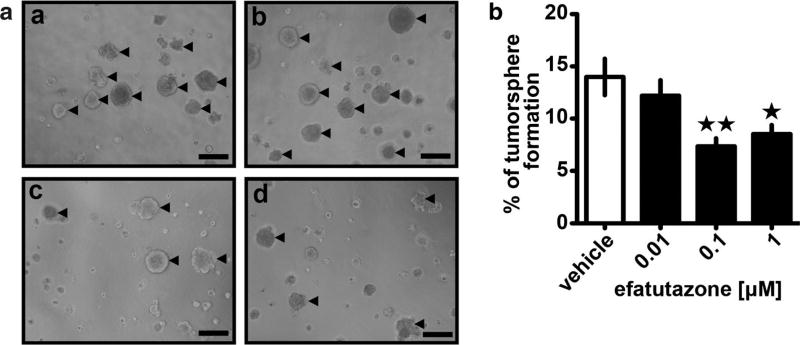
We and others have previously determined that reduction in the levels of MCFDCIS breast cancer initiating cells (BCIC) parallels changes in differentiation and inhibits the ability of the MCFDCIS cells to progress to invasive disease [28]. To determine the effect of efatutazone on the BCIC population and tumorigenic potential of MCFDCIS cells, we next examined tumorsphere formation. Tumorspheres are developed as an outgrowth of BCICs in culture and can be distinguished from aggregate formation (see arrows in Fig. 3a). At the lowest concentration of efatutazone (0.01 µM), there was no significant reduction in number of tumorspheres (defined as > 100 µm diameter) (Fig. 3a, b). However, at higher concentrations (0.1 µM and above), the number of tumorspheres formed dropped significantly by greater than 30% (p < 0.05, Student’s t test) (Fig. 3b), suggesting that efatutazone induces a loss of BCIC from the overall MCFDCIS population.
Fig. 3.
Efatutazone treatment leads to a reduction of MCFDCIS tumorsphere formation. a Representative phase-contrast images of MCFDCIS cultivated on Matrigel for 8 days in the presence of vehicle (a), 0.01 µM (b), 0.1 µM (c), and 1 µM efatutazone (d). Tumorspheres with diameter ≥ 100 µm are indicated by arrows. Scale bar = 200 µm. b Quantification of the percentage of MCFDCIS tumorspheres with diameter ≥ 100 µm treated with increased concentrations of efatutazone using Fiji software. Mean ± SEM (Student’s t test; n = 5; *p < 0.05 vs vehicle; **p < 0.01 vs vehicle)
Effects of efatutazone on progression of DCIS in vivo
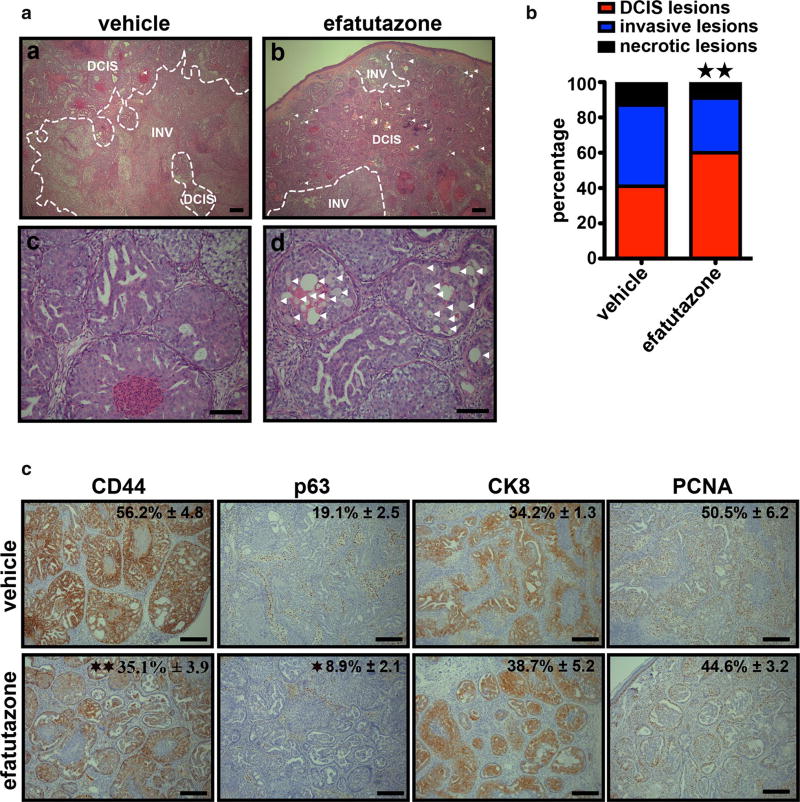
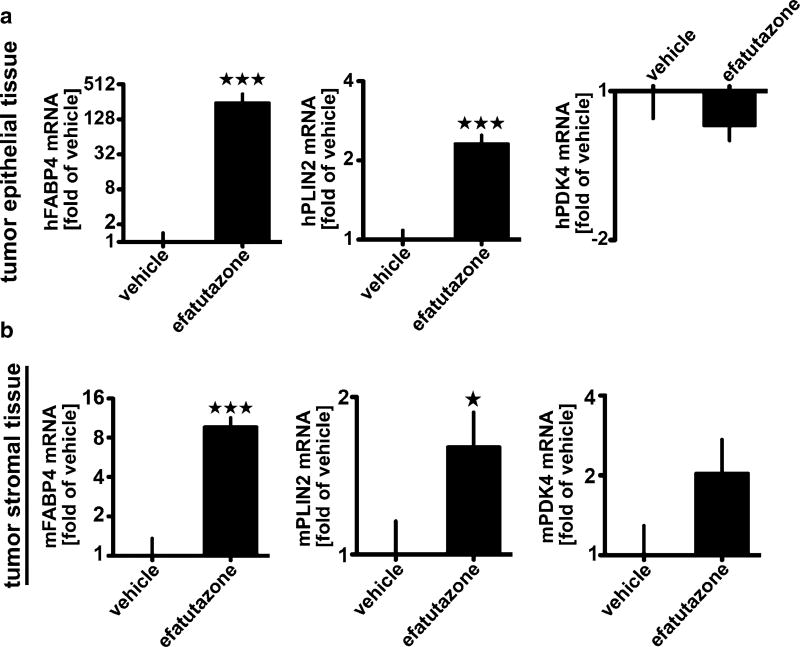
To examine effect of efatutazone on MCFDCIS tumor development and progression to invasive disease in vivo, MCFDCIS cells were injected subcutaneously into nude mice treated with either 30 mg/kg of efatutazone or vehicle daily after MCFDCIS tumors became palpable, i.e., 2–3 weeks after the MCFDCIS cells were implanted. This dose is considered an appropriate dose for this type of studies based on the previous efficacy and toxicity studies [16, 19, 40], and we observed no decrease in body weight of the mice during the study (Fig. S2a). Over 40 days, tumors in the efatutazone or vehicle treated groups grew rapidly (Fig. S2b). The overall mass and volume of the MCFDCIS tumors was reduced only slightly by efatutazone (Fig. S2b, d), although the glands were thicker after efatutazone treatment possibly due to lipid deposition (Fig. S2c). However, histopathology of the tumors harvested after 3 weeks of efatutazone treatment showed less invasion and necrosis in the efatutazone-treated animals indicating delayed tumor progression (Fig. 4a, b). In addition, the efatutazone-treated animals had lesions with lipid-filled droplets in them (arrowed Fig. 4a, b, and d). The efatutazone-treated MCFDCIS tumors had significant reduced CD44 and p63 staining and a tendency for an increase in CK8 staining but no change in PCNA staining after efatutazone treatment (Fig. 4c). These changes coupled with observed increases in FABP4 and PLIN2 mRNA expression in both epithelial and stromal compartments (Fig. 5a, b) are consistent with efatutazone inducing differentiation into milk-producing and more luminal-like mammary epithelial cells with possible loss of BCIC within the MCFDCIS lesions in vivo.
Fig. 4.
Efatutazone-treated DCIS lesions are less invasive with fewer CD44+/p63+ basal progenitor cells. a Representative hematoxylinand eosin-stained images of tissue sections from MCFDCIS xenograft tumors treated 3 weeks with vehicle or 30 mg/kg efatutazone. (a, b) DCIS DCIS lesions, INV invasive lesions. DCIS lesions containing lipid droplets are indicated by arrows. Scale bar = 200 µm. (c, d) Lipid droplets are indicated by arrows. Scale bar = 100 µm. b Percentage of DCIS, invasive, and necrotic lesions determined by microscopic area measurements using Fiji software. (χ2 test; n = 6; **p < 0.01 vs vehicle). c Representative IHC images of CD44, p63, CK8, and PCNA staining in xenografted tumor tissues obtained from MCFDCIS cells and treated with 30 mg/kg efatutazone (lower panel) or not (upper panel). The percentage of positive cells is indicated (upper right corner). Mean ± SEM (Student’s t test; n ≥ 4; *p < 0.05 vs vehicle; **p < 0.01 vs vehicle). Scale bar = 200 µm
Fig. 5.
Efatutazone regulates the expression of genes associated with lipid accumulation in MCFDCIS xenograft tumors. qRT-PCR analysis of a human and b mouse FABP4, PLIN2, and PDK4 mRNA levels in MCFDCIS tumor tissues treated 3 weeks with vehicle or 30 mg/kg efatutazone. Mean ± SEM (Student’s t test; n = 10; *p < 0.05 vs vehicle; ***p < 0.001 vs vehicle)
To study genes that might be involved in efatutazone effects on MCFDCIS lesions, we analyzed changes in human global gene expression patterns in tumors from treated vs untreated animals (Fig. S2e). A number of genes were upregulated by efatutazone treatment including the PPARγ-responsive gene FABP4 as well as genes that play a predominant role in inflammation such as S100A7, S100A8 [41], and LCN2 [42]. Conversely, genes downregulated by efatutazone are involved in cell proliferation and motility (e.g., IGFBP6 and MYLC2PL) [43].
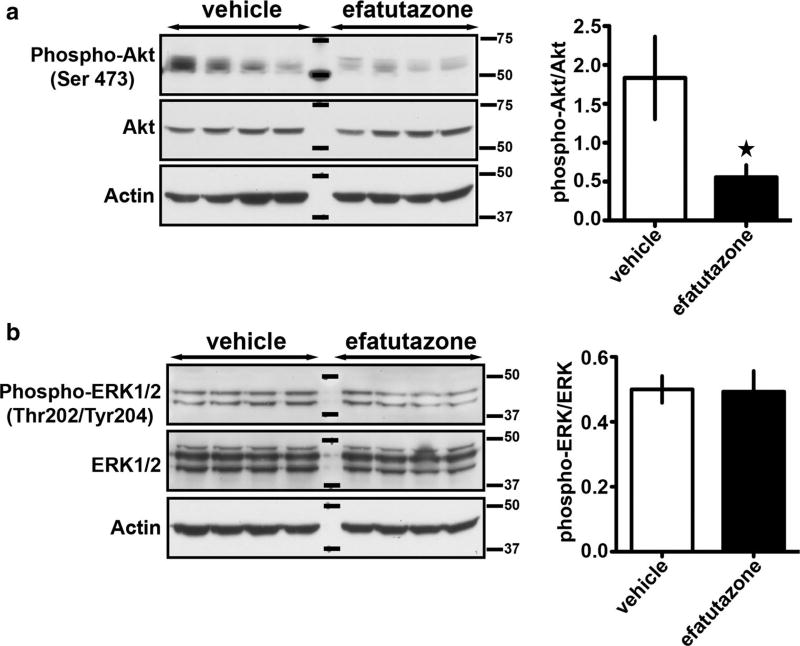
PPARγ has been shown to regulate a number of cellular signaling pathways related to proliferation and differentiation such as ERK and Akt [25, 44–46]. To determine which signaling pathways were influenced in our study, we analyzed tumor cell lysates from eight different tumors (Fig. 6). Efatutazone was able to prevent the activation of the Akt pathway as evidenced by > 50% reduction in phospho-Akt (Ser 473) (Fig. 6a). In contrast, the phospho-ERK (Thr202/Tyr204) levels were unaltered by the administration of drug (Fig. 6b).
Fig. 6.
Efatutazone treatment downregulates Akt phosphorylation in MCFDCIS xenograft tumors. a Representative western blots showing phospho-Akt (Ser 473), Akt, and b phospho-ERK1/2 (Thr202/Tyr204), ERK1/2, and actin expression in protein lysates obtained from MCFDCIS xenograft tumors treated 3 weeks with vehicle or 30 mg/kg efatutazone (left panels). The ratio of phospho-Akt to total Akt and phospho-ERK1/2 to total ERK1/2 was quantified using Fiji (right panels). Mean ± SEM (Student’s t test; n = 8; *p < 0.05 vs vehicle)
Finally, we determined if the effects of efatutazone on DCIS progression could be observed in a different model of DCIS progression. The C3(1)/Tag-driven model of mouse mammary tumorigenesis represents a basal (triple negative) model of mammary cancer progression in mice which progress through hyperplastic alveolar nodules at about 8–12 weeks of age that represent DCIS-like in situ lesions which will progress to invasive cancer 100% of the time [32]. Female C3(1)/Tag mice at 12 weeks of age were treated for 4 weeks with efatutazone or vehicle control with no change in weight (Fig. S3a). The mammary glands (MG2 and MG4) (Fig. S3b) were examined for histopathology and gene expression changes (Fig. S3c, d). Similar to the MCFDCIS model, we found that there was a trend towards delayed DCIS progression of hyperplastic–like lesions (Fig. S3c), although this only reached significance at p < 0.06 because of the variable rate of conversion to DCIS in the vehicle-treated controls. Nevertheless, the mammary glands showed changes in gene expression consistent with differentiation into milk-producing and luminal epithelial cells similar to the MCFDCIS tumors (Fig. S3d).
Discussion
Here, we show that activation of PPARγ with efatutazone can cause delay in progression of human DCIS to invasive breast cancer in vivo. Efatutazone treatment causes the basal MCFDCIS cells in vitro and in vivo to become more luminal and exhibit signs of normal mammary epithelial cell lactational differentiation including fat deposition. The previous studies have shown that PPARγ agonist inhibition of mammary cancer proliferation can be a contributing factor to anti-tumorigenic effects [21, 25]. However, efatutazone had no significant effect on MCFDCIS proliferation in vitro and in vivo. This is also consistent with the overall size of the tumors being unaltered by efatutazone treatment. Thus, it is likely that the effects of PPARγ activation on differentiation of the MCFDCIS cells are the major contributory factor to the slowing of the progression rate of DCIS in the tumors in vivo.
Efatutazone has been shown previously to cause luminal differentiation associated with increased ESR1 in basal mammary epithelial cells in mice with a loss of full length BRCA1 expression plus loss of one germline copy of p53 [25]. Increased ESR1 expression has also been observed with PPARγ agonists in other rodent studies [19]. We did not observe significant changes in expression of the ESR1 gene after efatutazone treatment, suggesting that changes in ESR1 with efatutazone may be only in rodent mammary epithelium. Our data on the effect of efatutazone in reducing tumorsphere formation and changes in gene expression in MCFDCIS lesions argue that activation of PPARγ causes loss or differentiation of a tumor initiating cell population. Thus, overall differentiation changes, which may cause the loss of more aggressive progenitor populations, likely contribute to the effect of PPARγ activation on DCIS progression and are possibly mediated by loss of Akt activation. Decreased Akt phosphorylation has been previously reported in a mouse model of BRCA1 mutation after efatutazone treatment [25]. Conversely, the absence of ERK activation and proliferative changes after efatutazone treatment in MCFDCIS cells may be related, since ERK activation by PPARγ has been associated with proliferation of other cancers [47].
Analysis of overall human gene expression changes in the MCFDCIS tumors in efatutazone treated mice showed changes in gene expression related to lipid production as well as downregulation of genes in the IGF (insulin like growth factor) pathway such as IGFBP6 that have been associated with PPARγ activation and effects [48]. Interestingly, changes of expression of genes involved in the inflammatory response pathways such as S1000A7, S100A8, and LCN2 were also induced by efatutazone. Thus, effects on the immune environment may also play a role in mammary epithelial cells differentiation in the presence of efatutazone. Our study taken together with the previous studies on PPARγ effects in rodent mammary cancer [25] indicates that a broad range of basal type breast cancer is responsive to efatutazone treatment at early stages.
We observed minimal toxicity for efatutazone in this short duration study which is consistent with the previous safety profile reports [24]. Although efatutazone failed to eradicate DCIS lesions during the time period of our observations, it would be interesting to assess the effect of higher doses, more prolonged treatment, and the effects of efatutazone in combination with other preventive agents such as tamoxifen on reducing overall incidence of invasive breast cancer in human DCIS.
Supplementary Material
Acknowledgments
The project described above was supported by RO1CA205632 (ATR), the Nina Hyde Center Breast Cancer Fund (ATR), T32 Training Grant in Tumor Biology CA009686 (William Kietzman), and P30CA051008 (PI: Weiner) from the National Cancer Institute for usage of the following shared resources: microscopy and imaging, tissue culture, flow cytometry, histopathology, and animal models. We thank Maria Idalia Cruz and Carlos Benitez for their technical assistance with the in vivo drug treatment. We thank Sahar Alothman and Alqassem Abuarqoub for their help with the image quantitation.
Footnotes
Electronic supplementary material The online version of this article (https://doi.org/10.1007/s10549-017-4649-y) contains supplementary material, which is available to authorized users.
Compliance with ethical standards
Ethical standards The experiments in this study comply with the current laws of the country in which they were performed. The data sets during and/or analyzed during the current study are available from the corresponding author on reasonable request.
Conflict of interest The authors do not have a financial relationship with Daiichi Sankyo pharmaceutical company and declare that they have no conflict of interest.
References
- 1.Siegel RL, Miller KD, Jemal A. Cancer statistics, 2016. CA Cancer J Clin. 2016;66:7–30. doi: 10.3322/caac.21332. https://doi.org/10.3322/caac.21332. [DOI] [PubMed] [Google Scholar]
- 2.Wellings SR, Jensen HM. On the origin and progression of ductal carcinoma in the human breast. J Natl Cancer Inst. 1973;50:1111–1118. doi: 10.1093/jnci/50.5.1111. [DOI] [PubMed] [Google Scholar]
- 3.Carter CL, Corle DK, Micozzi MS, et al. A prospective-study of the development of breast-cancer in 16,692 women with benign breast disease. Am J Epidemiol. 1988;128:467–477. doi: 10.1093/oxfordjournals.aje.a114995. [DOI] [PubMed] [Google Scholar]
- 4.Kuerer HM, Albarracin CT, Yang WT, et al. Ductal carcinoma in situ: state of the science and roadmap to advance the field. J Clin Oncol. 2009;27:279–288. doi: 10.1200/JCO.2008.18.3103. https://doi.org/10.1200/JCO.2008.18.3103. [DOI] [PubMed] [Google Scholar]
- 5.O’Connell P, Pekkel V, Fuqua SA, et al. Analysis of loss of heterozygosity in 399 premalignant breast lesions at 15 genetic loci. J Natl Cancer Inst. 1998;90:697–703. doi: 10.1093/jnci/90.9.697. [DOI] [PubMed] [Google Scholar]
- 6.Hwang ES, DeVries S, Chew KL, et al. Patterns of chromosomal alterations in breast ductal carcinoma in situ. Clin Cancer Res. 2004;10:5160–5167. doi: 10.1158/1078-0432.CCR-04-0165. https://doi.org/10.1158/1078-0432.CCR-04-0165. [DOI] [PubMed] [Google Scholar]
- 7.Buerger H, Simon R, Schäfer KL, et al. Genetic relation of lobular carcinoma in situ, ductal carcinoma in situ, and associated invasive carcinoma of the breast. MP, Mol Pathol. 2000;53:118–121. doi: 10.1136/mp.53.3.118. [DOI] [PMC free article] [PubMed] [Google Scholar]
- 8.Rosen PP, Braun DW, Kinne DE. The clinical significance of pre-invasive breast carcinoma. Cancer. 1980;46:919–925. doi: 10.1002/1097-0142(19800815)46:4+<919::aid-cncr2820461311>3.0.co;2-z. [DOI] [PubMed] [Google Scholar]
- 9.Eusebi V, Feudale E, Foschini MP, et al. Long-term follow-up of in situ carcinoma of the breast. Semin Diagn Pathol. 1994;11:223–235. [PubMed] [Google Scholar]
- 10.Page DL, Dupont WD, Rogers LW, et al. Continued local recurrence of carcinoma 15–25 years after a diagnosis of low grade ductal carcinoma in situ of the breast treated only by biopsy. Cancer. 1995;76:1197–1200. doi: 10.1002/1097-0142(19951001)76:7<1197::aid-cncr2820760715>3.0.co;2-0. [DOI] [PubMed] [Google Scholar]
- 11.Collins LC, Tamimi RM, Baer HJ, et al. Outcome of patients with ductal carcinoma in situ untreated after diagnostic biopsy: results from the Nurses’ Health Study. Cancer. 2005;103:1778–1784. doi: 10.1002/cncr.20979. https://doi.org/10.1002/cncr.20979. [DOI] [PubMed] [Google Scholar]
- 12.Erbas B, Provenzano E, Armes J, Gertig D. The natural history of ductal carcinoma in situ of the breast: a review. Breast Cancer Res Treat. 2006;97:135–144. doi: 10.1007/s10549-005-9101-z. https://doi.org/10.1007/s10549-005-9101-z. [DOI] [PubMed] [Google Scholar]
- 13.Kietzman W, Riegel AT, Ory V. Breast cancer—from biology to medicine. chap 4. InTech; 2017. Early-stage progression of breast cancer; pp. 61–96. [Google Scholar]
- 14.Michalik L, Desvergne B, Wahli W. Peroxisome-proliferator-activated receptors and cancers: complex stories. Nat Rev Cancer. 2004;4:61–70. doi: 10.1038/nrc1254. https://doi.org/10.1038/nrc1254. [DOI] [PubMed] [Google Scholar]
- 15.Marlow LA, Reynolds LA, Cleland AS, et al. Reactivation of suppressed RhoB is a critical step for the inhibition of anaplastic thyroid cancer growth. Cancer Res. 2009;69:1536–1544. doi: 10.1158/0008-5472.CAN-08-3718. https://doi.org/10.1158/0008-5472.CAN-08-3718. [DOI] [PMC free article] [PubMed] [Google Scholar]
- 16.Copland JA, Marlow LA, Kurakata S, et al. Novel high-affinity PPARγ agonist alone and in combination with paclitaxel inhibits human anaplastic thyroid carcinoma tumor growth via p21WAF1/CIP1. Oncogene. 2005;25:2304–2317. doi: 10.1038/sj.onc.1209267. https://doi.org/10.1038/sj.onc.1209267. [DOI] [PubMed] [Google Scholar]
- 17.Motomura W, Okumura T, Takahashi N, et al. Activation of peroxisome proliferator-activated receptor gamma by troglitazone inhibits cell growth through the increase of p27KiP1 in human. Pancreatic carcinoma cells. Cancer Res. 2000;60:5558–5564. [PubMed] [Google Scholar]
- 18.Nicol CJ, Yoon M, Ward JM, et al. PPARgamma influences susceptibility to DMBA-induced mammary, ovarian and skin carcinogenesis. Carcinogenesis. 2004;25:1747–1755. doi: 10.1093/carcin/bgh160. https://doi.org/10.1093/carcin/bgh160. [DOI] [PubMed] [Google Scholar]
- 19.Yin Y, Russell RG, Dettin LE, et al. Peroxisome proliferator-activated receptor delta and gamma agonists differentially alter tumor differentiation and progression during mammary carcinogenesis. Cancer Res. 2005;65:3950–3957. doi: 10.1158/0008-5472.CAN-04-3990. https://doi.org/10.1158/0008-5472.CAN-04-3990. [DOI] [PubMed] [Google Scholar]
- 20.Yin Y, Yuan H, Zeng X, et al. Inhibition of peroxisome proliferator-activated receptor gamma increases estrogen receptor-dependent tumor specification. Cancer Res. 2009;69:687–694. doi: 10.1158/0008-5472.CAN-08-2446. https://doi.org/10.1158/0008-5472.CAN-08-2446. [DOI] [PMC free article] [PubMed] [Google Scholar]
- 21.Suh N, Wang Y, Williams CR, et al. A new ligand for the peroxisome proliferator-activated receptor-gamma (PPARgamma), GW7845, inhibits rat mammary carcinogenesis. Cancer Res. 1999;59:5671–5673. [PubMed] [Google Scholar]
- 22.Kulke MH, Demetri GD, Sharpless NE, et al. A phase II study of troglitazone, an activator of the PPARgamma receptor, in patients with chemotherapy-resistant metastatic colorectal cancer. Cancer J. 2002;8:395–399. doi: 10.1097/00130404-200209000-00010. [DOI] [PubMed] [Google Scholar]
- 23.Smith MR, Manola J, Kaufman DS, et al. Rosiglitazone versus placebo for men with prostate carcinoma and a rising serum prostate-specific antigen level after radical prostatectomy and/or radiation therapy. Cancer. 2004;101:1569–1574. doi: 10.1002/cncr.20493. https://doi.org/10.1002/cncr.20493. [DOI] [PubMed] [Google Scholar]
- 24.Pishvaian MJ, Marshall JL, Wagner AJ, et al. A phase 1 study of efatutazone, an oral peroxisome proliferator-activated receptor gamma agonist, administered to patients with advanced malignancies. Cancer. 2012;118:5403–5413. doi: 10.1002/cncr.27526. https://doi.org/10.1002/cncr.27526. [DOI] [PMC free article] [PubMed] [Google Scholar]
- 25.Nakles RE, Kallakury BVS, Furth PA. The PPARγ agonist efatutazone increases the spectrum of well-differentiated mammary cancer subtypes initiated by loss of full-length BRCA1 in association with TP53 haploinsufficiency. Am J Pathol. 2013;182:1976–1985. doi: 10.1016/j.ajpath.2013.02.006. https://doi.org/10.1016/j.ajpath.2013.02.006. [DOI] [PMC free article] [PubMed] [Google Scholar]
- 26.Miller FR, Santner SJ, Tait L, Dawson PJ. MCF10DCIS.com xenograft model of human comedo ductal carcinoma in situ. J Natl Cancer Inst. 2000;92:1185–1186. doi: 10.1093/jnci/92.14.1185a. [DOI] [PubMed] [Google Scholar]
- 27.Hu M, Yao J, Carroll DK, et al. Regulation of in situ to invasive breast carcinoma transition. Cancer Cell. 2008;13:394–406. doi: 10.1016/j.ccr.2008.03.007. https://doi.org/10.1016/j.ccr.2008.03.007. [DOI] [PMC free article] [PubMed] [Google Scholar]
- 28.Ory V, Tassi E, Cavalli LR, et al. The nuclear coactivator amplified in breast cancer 1 maintains tumor-initiating cells during development of ductal carcinoma in situ. Oncogene. 2014;33:3033–3042. doi: 10.1038/onc.2013.263. https://doi.org/10.1038/onc.2013.263. [DOI] [PMC free article] [PubMed] [Google Scholar]
- 29.Debnath J, Muthuswamy SK, Brugge JS. Morphogenesis and oncogenesis of MCF-10A mammary epithelial acini grown in three-dimensional basement membrane cultures. Methods. 2003;30:256–268. doi: 10.1016/s1046-2023(03)00032-x. https://doi.org/10.1016/S1046-2023(03)00032-X. [DOI] [PubMed] [Google Scholar]
- 30.Lee GY, Kenny PA, Lee EH, Bissell MJ. Three-dimensional culture models of normal and malignant breast epithelial cells. Nat Meth. 2007;4:359–365. doi: 10.1038/nmeth1015. https://doi.org/10.1038/nmeth1015. [DOI] [PMC free article] [PubMed] [Google Scholar]
- 31.Berens EB, Sharif GM, Schmidt MO, et al. Keratin-associated protein 5-5 controls cytoskeletal function and cancer cell vascular invasion. Oncogene. 2017;36:593–605. doi: 10.1038/onc.2016.234. https://doi.org/10.1038/onc.2016.234. [DOI] [PMC free article] [PubMed] [Google Scholar]
- 32.Green JE, Shibata MA, Yoshidome K, et al. The C3(1)/SV40 T-antigen transgenic mouse model of mammary cancer: ductal epithelial cell targeting with multistage progression to carcinoma. Oncogene. 2000;19:1020–1027. doi: 10.1038/sj.onc.1203280. https://doi.org/10.1038/sj.onc.1203280. [DOI] [PubMed] [Google Scholar]
- 33.Al-Otaiby M, Tassi E, Schmidt M, et al. Role of the nuclear receptor coactivator AIB1/SRC-3 in angiogenesis and wound healing. Am J Pathol. 2012;180:1474–1484. doi: 10.1016/j.ajpath.2011.12.032. https://doi.org/10.1016/j.ajpath.2011.12.032. [DOI] [PMC free article] [PubMed] [Google Scholar]
- 34.Fereshteh MP, Tilli MT, Kim SE, et al. The nuclear receptor coactivator amplified in breast cancer-1 is required for Neu (ErbB2/HER2) activation, signaling, and mammary tumorigenesis in mice. Cancer Res. 2008;68:3697–3706. doi: 10.1158/0008-5472.CAN-07-6702. https://doi.org/10.1158/0008-5472.CAN-07-6702. [DOI] [PMC free article] [PubMed] [Google Scholar]
- 35.Oh A, List H-J, Reiter R, et al. The nuclear receptor coactivator AIB1 mediates insulin-like growth factor I-induced phenotypic changes in human breast cancer cells. Cancer Res. 2004;64:8299–8308. doi: 10.1158/0008-5472.CAN-04-0354. https://doi.org/10.1158/0008-5472.CAN-04-0354. [DOI] [PubMed] [Google Scholar]
- 36.Girousse A, Langin D. Adipocyte lipases and lipid droplet-associated proteins: insight from transgenic mouse models. Int J Obes (Lond) 2012;36:581–594. doi: 10.1038/ijo.2011.113. https://doi.org/10.1038/ijo.2011.113. [DOI] [PubMed] [Google Scholar]
- 37.Mather IH, Keenan TW. Origin and secretion of milk lipids. J Mammary Gland Biol Neoplasia. 1998;3:259–273. doi: 10.1023/a:1018711410270. [DOI] [PubMed] [Google Scholar]
- 38.McManaman JL. Formation of milk lipids: a molecular perspective. Clin Lipidol. 2009;4:391–401. doi: 10.2217/clp.09.15. https://doi.org/10.2217/clp.09.15. [DOI] [PMC free article] [PubMed] [Google Scholar]
- 39.Anders C, Carey LA. Understanding and treating triple-negative breast cancer. Oncology (Williston Park, NY) 2008;22:1233–9. discussion 1239–40– 1243. [PMC free article] [PubMed] [Google Scholar]
- 40.Shimazaki N, Togashi N, Hanai M, et al. Anti-tumour activity of CS-7017, a selective peroxisome proliferator-activated receptor gamma agonist of thiazolidinedione class, in human tumour xenografts and a syngeneic tumour implant model. Eur J Cancer. 2008;44:1734–1743. doi: 10.1016/j.ejca.2008.04.016. https://doi.org/10.1016/j.ejca.2008.04.016. [DOI] [PubMed] [Google Scholar]
- 41.Gebhardt C, Németh J, Angel P, Hess J. S100A8 and S100A9 in inflammation and cancer. Biochem Pharmacol. 2006;72:1622–1631. doi: 10.1016/j.bcp.2006.05.017. https://doi.org/10.1016/j.bcp.2006.05.017. [DOI] [PubMed] [Google Scholar]
- 42.Chakraborty S, Kaur S, Guha S, Batra SK. The multifaceted roles of neutrophil gelatinase associated lipocalin (NGAL) in inflammation and cancer. Biochim Biophys Acta. 2012;1826:129–169. doi: 10.1016/j.bbcan.2012.03.008. https://doi.org/10.1016/j.bbcan.2012.03.008. [DOI] [PMC free article] [PubMed] [Google Scholar]
- 43.Bach LA, Fu P, Yang Z. Insulin-like growth factor-binding protein-6 and cancer. Clin Sci. 2013;124:215–229. doi: 10.1042/CS20120343. https://doi.org/10.1042/CS20120343. [DOI] [PubMed] [Google Scholar]
- 44.Sawayama H, Ishimoto T, Watanabe M, et al. Small molecule agonists of PPAR-γ exert therapeutic effects in esophageal cancer. Cancer Res. 2014;74:575–585. doi: 10.1158/0008-5472.CAN-13-1836. https://doi.org/10.1158/0008-5472.CAN-13-1836. [DOI] [PubMed] [Google Scholar]
- 45.Qin L, Ren Y, Chen A-M, et al. Peroxisome proliferator-activated receptor γ ligands inhibit VEGF-mediated vasculogenic mimicry of prostate cancer through the AKT signaling pathway. Mol Med Rep. 2014;10:276–282. doi: 10.3892/mmr.2014.2198. https://doi.org/10.3892/mmr.2014.2198. [DOI] [PubMed] [Google Scholar]
- 46.Burgermeister E, Seger R. PPARgamma and MEK interactions in cancer. PPAR Res. 2008;2008:309469. doi: 10.1155/2008/309469. https://doi.org/10.1155/2008/309469. [DOI] [PMC free article] [PubMed] [Google Scholar]
- 47.Li M, Lee TW, Mok TSK, et al. Activation of peroxisome proliferator-activated receptor-gamma by troglitazone (TGZ) inhibits human lung cell growth. J Cell Biochem. 2005;96:760–774. doi: 10.1002/jcb.20474. https://doi.org/10.1002/jcb.20474. [DOI] [PubMed] [Google Scholar]
- 48.Vella V, Nicolosi ML, Giuliano S, et al. PPAR-γ agonists as antineoplastic agents in cancers with dysregulated IGF axis. Front Endocrinol (Lausanne) 2017;8:31. doi: 10.3389/fendo.2017.00031. https://doi.org/10.3389/fendo.2017.00031. [DOI] [PMC free article] [PubMed] [Google Scholar]
Associated Data
This section collects any data citations, data availability statements, or supplementary materials included in this article.


