Abstract
The ultraviolet action spectrum for stomatal opening was measured using epidermal peels from leaves of broad bean (Vicia faba). The spectrum was calculated from hyperbolic fluence response curves using 11 wavelengths ranging from 275 to 459 nm. The action spectrum exhibits a major peak at approximately 280 nm and a minor peak at approximately 360 nm. The response at 280 nm is about three times greater than the response at 459 nm. Under the conditions utilized (i.e. the absence of saturating red light), stomatal opening saturated at extremely low fluence rates: <0.2 μmol m−2 s−1 at 280 nm, and approximately 1.0 μmol m−2 s−1 at 459 nm. The threshold for blue-light-induced stomatal opening was approximately 0.02 μmol m−2 s−1. In light-mixing experiments, the addition of 280 nm light to saturating 650 nm (red) light caused additional stomatal opening, which is indicative of separate photoreceptors. In contrast, adding 280 nm of light to saturating 459 nm (blue) light did not increase stomatal opening, suggesting that they both excite the same receptor. The results with white light were similar to those with blue light. We infer that ultraviolet light acts via the blue light photoreceptor rather than through photosynthesis. The additional absorbance peak at 360 nm suggests that the chromophore is either a flavin or a cis-carotenoid, both of which exhibit peaks in this region. It is proposed that the chromophore can be excited either directly by blue light or by energy transferred from the protein portion of the protein-pigment complex after it absorbs 280 nm light.
Stomatal opening plays a critical role in the gas exchange required for photosynthesis by allowing CO2 from the atmosphere to diffuse into the leaf in the presence of light. Early studies on the action spectrum of stomatal opening established that stomatal opening, like photosynthesis itself, exhibited two peaks of activity, one in the red region and one in the blue region of the visible spectrum (Kuiper, 1964; Wilmer and Fricker, 1996). Further experiments demonstrated that the peak in the red region is driven by photosynthesis, whereas the peak in the blue region is due to the combined action of photosynthesis and a blue light photoreceptor (e.g. Lurie, 1978; Ogawa, 1981; Sharkey and Raschke, 1981). To further characterize the blue light photoreceptor involved in stomatal opening, Karlson (1986) determined the action spectrum for stomatal opening in intact leaves of wheat in the presence of saturating red light. The resulting action spectrum exhibited a major peak at 450 nm and minor peaks at 420 and 470 nm.
The existence of multiple peaks in the blue region is typical of many blue light responses, suggesting that the blue light photoreceptor of guard cells may be similar to those regulating such responses as phototropism and the inhibition of hypocotyl elongation (Short and Briggs, 1994; Lascève et al., 1999). However, these other blue light responses also exhibit characteristic peaks in the UV-A region as well (Horwitz, 1994). Relatively little research has been published on the effects of UV light on stomatal opening. Teramura et al. (1983) reported that UV-B (280–315 nm) reduced stomatal resistance in cucumber. Using broad bean (Vicia faba), Ogawa et al. (1978) observed stomatal opening and malate formation in response to blue and UV-A wavelengths measured at a single fluence rate. To our knowledge, a true UV action spectrum for stomatal opening has never been determined. We report that the UV action spectrum for stomatal opening in broad bean epidermal strips exhibits a major peak centered around 280 nm and a minor peak at around 360 nm. Light-mixing experiments suggested that the activity of 280 nm of light was probably due to absorption by the blue light photoreceptor. The implications of the results for the identity of the guard cell blue light photoreceptor are discussed.
MATERIALS AND METHODS
Five-week-old, greenhouse-grown broad bean (Vicia faba) plants were placed in the dark for 1 h to induce stomatal closure. All experiments were carried out in a dark room. Epidermal peels were prepared under dim red light and floated on a medium containing 0.1 m KCl and 0.1 mm CaCl2 in a Petri dish. For a given experiment, all peels were taken from the same leaf, while each treatment utilized three peels from different regions of the same leaf.
Each action spectrum experiment included six different light treatments: a dark control, a saturating broad spectrum UV control, and four different fluence rates of a given wavelength. The light source was a 75 W xenon arc lamp. Specific wavelengths were selected using a high-intensity monochromator (Bausch & Lomb, Rochester, NY). For UV experiments, stray visible light was excluded from the monochromater beam using a 7–54 quartz filter (Corning, Corning, NY) that transmits only light in the 250 to 410 nm range. The monochromator was positioned on a shelf above the bench and the beam was directed downward by means of a front-surface mirror. The reservoirs containing the epidermal peels were positioned, using clamps attached to a ring stand, at fixed distances from the light source and staggered slightly to avoid shading, such that each was within the cone of the beam. A small tube directed humidified, CO2-free air over the peels throughout the treatment. Fluence rates at each level were determined using a PIN-8 photodiode (UDT Instruments, Baltimore, MD) with extended UV range, which was previously spectrally calibrated against a thermopile (Kettering 68, Milton Roy, St. Petersburg, FL) in the 220 to 700 nm range. The radiometer calibration is traceable to NBS standard lamps. The calibration was confirmed within 10% using the actinochrome chemical actinometer (Brauer et al., 1983). The dark and saturating broad spectrum UV light (model NH, Minerallight) was included as an internal standard to check for variation in light responsiveness among plants from experiment to experiment. Only those experiments in which the two sets of controls gave consistent results—that is, fully open in the case of saturating broad spectrum UV, and nearly closed in the case of the dark treatment—were used for data analysis.
After 1 h of light treatment, the peels were viewed in a fluorescence light microscope (Zeiss, Jena, Germany) using a ×40 objective and digitally recorded using an infrared-sensitive (λ ≥ 800 nm) video camera (model WV 850, Panasonic, Tokyo) and a video capture card (model PBTV4, Packard Bell, Sacramento, CA). The digitized images were later viewed in Photoshop (Adobe Systems, Mountain View, CA) and stomatal apertures were measured using the “Information Palette” feature of that program. A minimum of 50 stomata were measured per light treatment and each experiment was repeated a minimum of three times.
In experiments involving the combination of two wavelengths, the primary light source was a halogen bulb (20 MR 16, Phillips, Eindhoven, The Netherlands) with a wide-band hot mirror filter (Tempax, Optical Coatings Laboratory, Santa Rosa, CA). The fluence at tissue level was approximately 500 μmol m−2 s−1. Glass filters were used to provide specific wavelength ranges: 650 nm (630–750 nm; Corning 2–62 [hot mirror +2–62]) and 450 nm (360–490 nm; Corning 5–57). The secondary light source was the xenon arc lamp with a monochromator described above set at 284 nm and providing approximately 0.18 μmol m−2 s−1 at tissue level. After an hour of illumination, peels were photographed as above and stomatal apertures were analyzed using Photoshop.
Data Analysis
The points for the action spectrum were calculated as follows. At each wavelength the change in the stomatal aperture (aperture at each intensity minus aperture in darkness) were plotted as a function of light intensity. The error bars are ± 1 se. Hyperbolic curves were fitted to the data using scientific graphing software (SigmaPlot, SPSS, Inc., Chicago). Hyperbolic behavior would be expected for a simple model in which light activates a receptor and the activated receptor or a subsequent product generates the signal (Hartman, 1983). Using this best-fit hyperbolic curve, the number of photons required to achieve a standard response (Δ stomatal aperture of 0.5 μm) was calculated. The inverse of this value was plotted against the wavelength to produce the action spectrum.
RESULTS
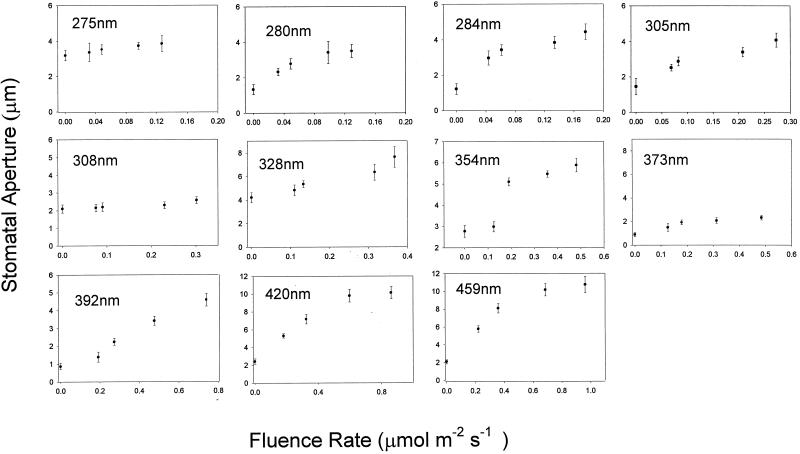
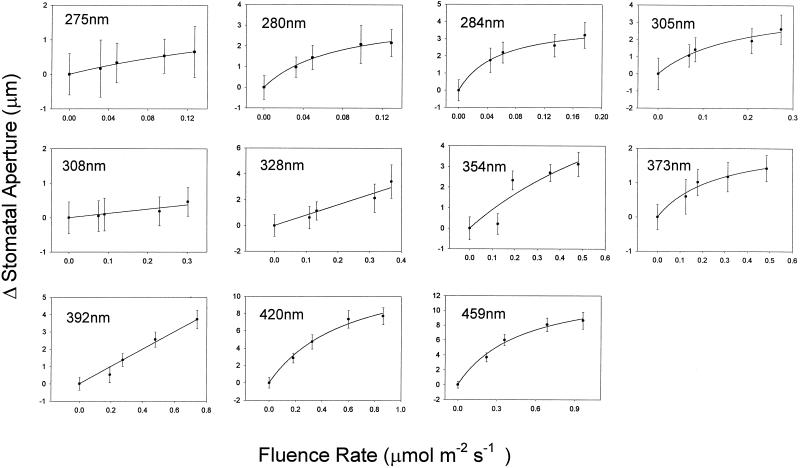
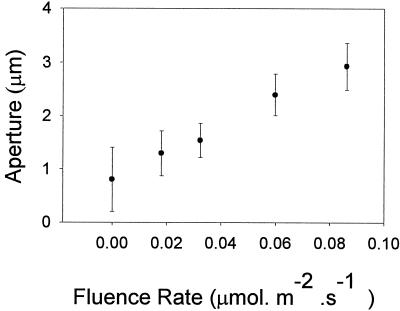
Figure 1 shows the fluence response curves for stomatal opening at 11 wavelengths ranging from 275 to 459 nm. The relatively small number of data points reflects the limitation of the light source, which necessitated a wide bandwidth (15 nm) in order to provide sufficient light for the range of fluence rates required. The interval (25 nm) between the selected wavelengths was consistent with the bandwidth utilized. In Figure 2, the data are replotted as the change in aperture (Δ stomatal aperture) and fitted to hyperbolic curves. Most of the data points fall on the curves, demonstrating that the response exhibits saturation kinetics as predicted for a single photochemical reaction. At approximately 280 nm, the response saturated at 0.18 μmol m−2 s−1, whereas at 459 nm saturation occurred at approximately 1.0 μmol m−2 s−1. Since the latter value is several orders of magnitude lower than typically employed in blue light/stomatal opening experiments, the threshold fluence rate for blue-light-induced opening was determined; as shown in Figure 3, this threshold was around 0.01 μmol m−2 s−1.
Figure 1.
Effects of various UV wavelengths on stomatal aperture in epidermal strips of broad bean as a function of fluence rate. Error bars are ±1 se.
Figure 2.
Effects of various UV wavelengths on the change in stomatal aperture in epidermal strips of broad bean as a function of fluence rate. The data points were fit to a hyperbolic curve. Error bars are ±1 se.
Figure 3.
Stomatal opening in epidermal strips of broad bean at very low fluence rates of 420 nm light. Error bars are ±1 se.
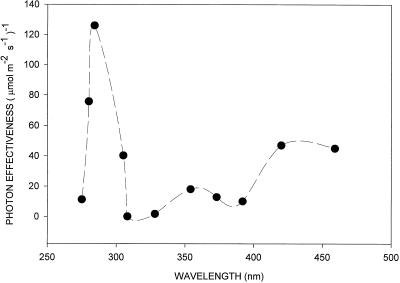
Using the fitted data from Figure 2, a UV action spectrum was determined by plotting the inverse of the number of photons required to produce a standard opening response of 0.5 μm. As shown in Figure 4, the UV action spectrum exhibits a major peak at approximately 280 nm and a small but significant minor peak at approximately 360 nm. The response at 280 nm was nearly three times greater than the response in the blue region (450 nm).
Figure 4.
UV action spectrum for stomatal opening in epidermal strips of broad bean. Estimated uncertainty in photon effectiveness for all data points is about 20%.
Although these measurements were made in the absence of saturating red light, the contribution of photosynthesis is assumed to be minimal because of the extremely low fluence rates employed. Since the focus of this study was on the UV action spectrum, no attempt was made to map the fine structure in the blue region.
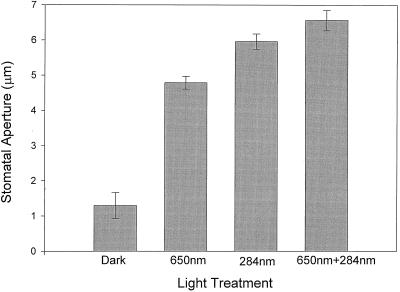
To gain some insight into which photoreceptor might be involved in the response to UV light, saturating light of around 280 nm was given in combination with saturating red or blue light. Additivity between the two wavelengths is consistent with two separate photoreceptors, while a lack of additivity is interpreted as indicating a single photoreceptor. Preliminary experiments established that the opening response induced by saturating blue light is linear during the first 2 h of incubation (data not shown). To avoid saturating the response, which would obscure additive effects, epidermal peels were exposed to the light treatment for only 1 h. As shown in Figure 5, saturating UV light was more effective than saturating 650 nm light in causing stomatal opening. Furthermore, the addition of UV light to saturating red light caused the stomata to open wider, suggesting that 280 nm light and red light (photosynthesis) involve different mechanisms. At saturation, red plus 280 nm light was not significantly greater than 280 nm alone.
Figure 5.
Light-mixing experiments on the effects of saturating red (650 nm) and saturating 280 nm light on stomatal aperture in epidermal strips of broad bean. Error bars are ±1 se.
Figure 6 shows that saturating light of approximately 450 nm and 280 nm opened stomata to about the same extent. No further increase in stomatal aperture was obtained when the two wavelengths were added together, suggesting that 280 and 450 nm light may act through the same blue light photoreceptor. The total blue-light-induced stomatal opening was lower in the light-mixing experiments than in the fluence response curves (compare Figs. 1 and 6). Whether this discrepancy was due to the differences in experimental conditions, seasonal variation, or other factors is unclear. Note that in Figure 6, the responses to 280 nm light and blue light are the same when saturating fluence rates were used, whereas 280 nm light was nearly three times more active than blue light based on the fluence response curves (Fig. 4).
Figure 6.
Light-mixing experiments on the effects of saturating blue (450 nm) and saturating 280 nm light on stomatal aperture in epidermal strips of broad bean. Error bars are ±1 se.
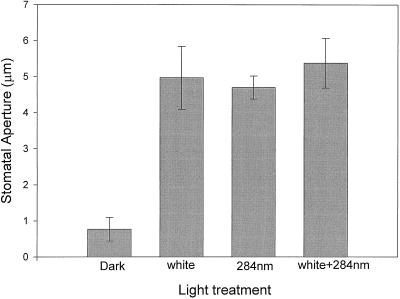
We also compared the amount of opening induced by saturating white light versus saturating UV light at approximately 280 nm. Stomata opened to nearly the same extent in response to saturating UV light as they did to saturating white light (Fig. 7). Furthermore, there was no significant increase in opening when UV light was added to saturating white light.
Figure 7.
Light-mixing experiments on the effects of saturating white light and saturating 280 nm light on stomatal aperture in epidermal strips of broad bean. Error bars are ±1 se.
DISCUSSION
Although UV-induced stomatal opening has been reported previously (Ogawa et al., 1978; Teramura et al., 1983), to our knowledge, this study provides the first true action spectrum for stomatal opening in the UV range. The measurements for the action spectrum (which includes some long UV wavelengths) reported by Ogawa et al. (1978) were all carried out at a single fluence rate; therefore, their data do not represent a true action spectrum because the linearity of the response at different wavelengths was not evaluated.
We have shown that the UV action spectrum for stomatal opening in broad bean has a major peak of activity at approximately 280 nm and a minor peak at approximately 360 nm. The response at 280 nm is approximately 3-fold greater than the response at 459 nm. Although photosynthesis is active at 459 nm, the very low fluence rates used in these experiments ensure that most of the response seen in blue light was due to the blue light photoreceptor rather than to photosynthesis. Zeiger (1983) drew the same conclusion concerning blue-light-induced stomatal opening at low fluence rates.
Light-mixing experiments with saturating red light indicated that 280 nm light does not act via photosynthesis. These results are comparable to experiments carried out with blue light in the presence of saturating levels of red light (Schwartz and Zeiger, 1984; Karlson, 1986), and demonstrate that 280 nm light can open stomata in the presence of saturating red light. This was important to establish, since the fluence response curves used to determine the UV action spectrum were carried out in the absence of saturating red light.
In contrast to the results with red light, 280 nm light failed to cause additional opening in the presence of saturating blue light. This is consistent with a model in which 280 nm light activates the blue light photoreceptor. However, the situation is somewhat more complex than in the red light experiments, because saturating blue light can activate both the blue light photoreceptor and photosynthesis. If opening in response to saturating blue light represents a combination of the effects of the blue light photoreceptor and photosynthesis, we would predict that 280 nm light might cause a slight amount of additivity with the portion of the blue light response that is driven by photosynthesis. On the other hand, as noted in “Results,” saturating light of 280 nm alone is more active than saturating red light, and there is no significant difference between 280 nm light alone and red plus approximately 280 nm light. In other words, the effects of photosynthesis on stomatal opening cannot be seen in the presence of saturating 280 nm light. Therefore, the fact that blue light alone yields the same amount of opening as blue plus 280 nm light supports the model that 280 nm light excites the same photoreceptor as blue light.
As noted above, blue and 280 nm light, when given at saturation, were equally active in causing stomatal opening, whereas 280 nm light was approximately 3-fold more active based on the analysis of the fluence response curves. This finding underscores the need to base comparisons of activity at different wavelengths on fluence rate response curves rather than on responses at a single saturating fluence rate.
A peak of activity at approximately 360 nm, which is characteristic of most blue light responses (Horwitz, 1994), is also present in the action spectrum for stomatal opening. Although the ratio of the activity at 360 versus 450 nm is lower for stomatal opening than for phototropism (Baskin and Iino, 1987), the presence of a peak in the UV-A region of the spectrum has implications for the identification of the blue light photoreceptor in guard cells. It has long been argued that the 360 nm peak in the action spectra for phototropism, the inhibition of hypocotyl elongation, and other blue light responses are indicative of a flavin chromophore for the photoreceptor, whereas the fine structure of the broad peak in the blue region of the spectrum has usually been interpreted as diagnostic for a carotenoid (Thimann and Curry, 1960). Various speculations regarding the micro-environment of either a flavin or carotenoid chromophore have been invoked to account for the presence of both multiple peaks in the blue light range and the peak at 360 nm.
Based on these criteria, the presence of the 360 nm peak in the action spectrum for stomatal opening in broad bean argues against a carotenoid and in favor of a flavin as the chromophore involved in the response. However, if the guard cell blue light photoreceptor is a flavoprotein, it cannot be any of the flavoprotein photoreceptors that have previously been identified. Blue-light-induced stomatal opening has been shown to be normal in Arabidopsis single and double mutants with defective genes for the flavoprotein photoreceptors that regulate blue-light-induced growth inhibition or phototropic bending, including CRY1 (Chory, 1992; Liscum and Hangarter, 1994), CRY2, CRY1CRY2, NPH1, and NPH1CRY1 (Lascève et al., 1999). Alternatively, the guard cell blue light photoreceptor could be a cis-polyene such as cis-zeaxanthin (Molnar and Szabolcs, 1993) or a carotenoid derivative such as cis-retinal (Yoshizawa and Wald, 1966). Genetic evidence in support of zeaxanthin as the blue light photoreceptor in Arabidopsis has recently been presented by Zeiger and Zhu (1998).
A peak of activity at 280 nm has previously been observed for other blue light responses such as phototropism (Baskin and Iino, 1987), fruit body formation in Coprinus congregatus (Durand and Furuya, 1985), and perithecial formation in Gelasinospora reticulispora (Inoue and Watanabe, 1984). One possible interpretation of the peak at 280 nm is that it represents UV absorption by the protein component of the blue light photoreceptor with efficient energy transfer to the chromophore. Alternatively, the peak at 280 nm could represent a separate UV-B photoreceptor. If the latter were true, the effects of blue light plus 280 nm light should be additive. However, there was no additivity when saturating 287 and 450 nm (blue) light were mixed. This suggests that the two wavelengths act via the same blue light photoreceptor, and argues against a separate UV-B photoreceptor.
If the peak at 280 nm represents absorbance by the protein portion of the blue light photoreceptor, energy transfer must occur between the protein and the chromophore. It is striking that stomatal opening was about three times more sensitive to 280 nm light than to 459 nm light. This suggests that multiple Trp residues may be located close to the chromophore. Alternatively, the chromophore itself might absorb at 280 nm. Identification and characterization of the blue light photoreceptor of guard cells will be necessary in order to choose between these two alternatives.
Because of the potential of UV light to cause cellular damage, it was necessary to work at very low fluence rates to avoid inhibitory effects. Nevertheless, it is surprising that we observed light saturation of stomatal opening at around 1.0 μmol m−2 s−1 in the blue region and at <0.2 μmol m−2 s−1 at 280 nm. These values are substantially lower than the fluence rates normally employed to induce stomatal opening (20–100 μmol m−2 s−1) (Zeiger, 1983). Earlier studies by Sharkey and Raschke (1981) showed that stomatal conductance increased exponentially with the fluence rate of monochromatic blue light up to 1 mmol m−2 s−1. However, these studies were not carried out in the presence of saturating red light, so the results reflect the contributions of two photoreceptors: the blue light photoreceptor at the lower fluence rates and chlorophyll at the higher fluence rates.
The blue light photoreceptor is preferentially activated at lower fluence rates and saturates at much lower fluence rates than does photosynthesis (Zeiger, 1983; Schwartz and Zeiger, 1984; Shimazaki et al., 1986). For example, in the presence of saturating red light, blue-light-induced proton extrusion from guard cell protoplasts of broad bean saturated at a fluence rate of 50 μmol m−2 s−1 when given as a 30-s pulse, which is equivalent to a total fluence of 1.5 mmol m−2. In our studies, blue-light-induced stomatal opening saturated at a fluence rate of approximately 1.0 μmol m−2 s−1 given over a 1-h time period, equivalent to a total fluence of 3.6 mmol m−2. Assuming that reciprocity holds (and preliminary data suggests that it does), our measurements of saturation for blue-light-induced stomatal opening are comparable to those obtained for blue-light-induced proton extrusion by guard cells, the process that drives stomatal opening.
The lower saturation fluence rate for UV-B may reflect the greater sensitivity of the photoreceptor for UV-B versus blue light. It is also possible that the low fluence rate for saturation observed with 280 nm light reflects a balance between stimulation and inhibition of opening. For example, UV-B caused stomatal closure in Tef (Eragrostis tef) plants at 2 μmol m−2 s−1 in 1 h (Negash and Bjorn, 1986).
Under our conditions, the threshold for stomatal opening by blue light was extremely low, around 0.01 μmol m−2 s−1. Blue light is apparently unable to induce stomatal opening at such low fluence rates in the presence of saturating red light (E. Zeiger, personal communication). It should be noted that the activity of 459 nm light based on a fluence response curve measured between 0.2 and 1.0 μmol m−2 s−1 was identical (that is, occurred at the same point on the action spectrum) to the activity of blue light measured between 0.02 and 0.10 μmol m−2 s−1 (data not shown), suggesting that the same photoreceptor is involved over the entire range of the fluence rates employed.
The observed threshold for stomatal response may be used to estimate the minimum concentration of photoreceptor pigment necessary to elicit the physiological response. At least one photon must be absorbed within the cell or cell organelle to cause the observed response. The calculation was based on the following assumptions: (a) that the receptor is located within a chloroplast; (b) that the quantum efficiency for photochemistry is 1; (c) that the extinction coefficient is approximately 50,000 m−1 cm−1; and (d) that the threshold for a response is 0.01 μmol m−2 s−1. Based on these assumptions, we calculated that over a 1-h light stimulus period, just a few receptor molecules per chloroplast are sufficient to absorb a photon. If the photoreceptor is located on the guard cell plasma membrane, a few hundred receptor molecules are sufficient (Thimann and Curry, 1960; Spudich and Bogomolni, 1984).
The high sensitivity of guard cells to blue light determined in our experiments carried out in the absence of background red illumination is comparable to that of the first positive curvature of phototropism. It is possible that background red light may desensitize guard cells to blue light, as has been found with phototropism in oat coleoptiles (Zimmermann and Briggs, 1963). For example, in the phototropic response of oat coleoptiles, red light shifts the curve for the first-positive curvature to 10-fold higher fluence rates. Since the effect of red light can be reversed by far-red light, phytochrome is implicated in the desensitization of oat coleoptiles to blue light (Zimmermann and Briggs, 1963).
Zeiger and Zhu (1998) have shown that red light increases total zeaxanthin levels in guard cells. It is possible that bulk zeaxanthin might absorb blue light, thus shielding the blue light photoreceptor and reducing the response. On the other hand, the observation that the npq1 mutant of Arabidopsis, which is blocked in the xanthophyll cycle, is also blocked in blue-light-induced stomatal opening, suggests that the blue light photoreceptor of guard cells may be a specific protein-carotenoid complex involved in zeaxanthin epoxidation (Zeiger and Zhu, 1998). Since most of the zeaxanthin in the chloroplast is in the trans form, which does not absorb UV-A, and our action spectrum clearly shows a peak in the UV-A region, the blue light photoreceptor of guard cells is probably not bulk zeaxanthin. However, our results and those of Zeiger and Zhu (1998) would be consistent with a subpopulation of cis-zeaxanthin acting both in the xanthophyll cycle during photosynthesis and as a photosynthesis-independent blue light photoreceptor for stomatal opening.
ACKNOWLEDGMENTS
We wish to thank Parag Wasudeo Paranjpe and Yorda Kidaue for technical assistance during this project. We also thank Winslow Briggs and Eduardo Zeiger for valuable discussions.
Footnotes
This research was supported by the U.S. Department of Agriculture (grant no. 94–37100–0755 to L.T.).
LITERATURE CITED
- Baskin TI, Iino M. An action spectrum in the blue and ultraviolet for phototropism in alfalfa. Photochem Photobiol. 1987;46:127–136. [Google Scholar]
- Brauer HD, Schmidt R, Gauglitz G, Hubig S. Chemical actinometry in the visible (475–610 nm) by meso-diphenylhelianthrene. Photochem Photobiol. 1983;37:595–598. [Google Scholar]
- Chory J. A genetic model for light-regulated seedling development in Arabidopsis. Development. 1992;115:337–360. [Google Scholar]
- Durand R, Furuya M. Action spectra for stimulatory and inhibitory effects of UV and blue light on fruit-body formation in Coprinus congregatus. Plant Cell Physiol. 1985;26:1175–1183. [Google Scholar]
- Hartman K. Exact action spectra. In: Hoppe W, Lohmann W, Markl H, Ziegler H, editors. Biophysics. New York: Springer-Verlag; 1983. pp. 115–121. [Google Scholar]
- Horwitz BA. Properties and transduction chains of the UV and blue light photoreceptors. In: Kendrick RE, Kronenberg GHM, editors. Photomorphogenesis in Plants. Ed 2. Dordrecht, The Netherlands: Kluwer Academic Publishers; 1994. pp. 327–350. [Google Scholar]
- Inoue Y, Watanabe M. Perithecial formation in Gelasinospora reticulispora. VII. Action spectra in UV region for the photoinduction and the photoinhibition of photoinductive effect brought by blue light. Plant Cell Physiol. 1984;25:107–113. [Google Scholar]
- Karlson PE. Blue light regulation of stomata in wheat seedlings. II. Action spectrum and search for action dichroism. Physiol Plant. 1986;66:207–210. [Google Scholar]
- Kuiper PJC. Dependence upon wavelength of stomatal movement in epidermal tissue of Senecio odoris. Plant Physiol. 1964;39:952–955. doi: 10.1104/pp.39.6.952. [DOI] [PMC free article] [PubMed] [Google Scholar]
- Lascève G, Leymarie J, Olney MA, Liscum E, Christie JM, Vavasseur A, Briggs WR. Arabidopsis contains at least four independent blue-light-activated signal transduction pathways. Plant Physiol. 1999;120:605–614. doi: 10.1104/pp.120.2.605. [DOI] [PMC free article] [PubMed] [Google Scholar]
- Liscum E, Hangarter RP. Mutational analysis of blue-light sensing in Arabidopsis. Plant Cell Environ. 1994;17:639–648. [Google Scholar]
- Lurie S. The effect of wavelength of light on stomatal opening. Planta. 1978;140:245–249. doi: 10.1007/BF00390255. [DOI] [PubMed] [Google Scholar]
- Molnar P, Szabolcs J. (Z/E)-Photoisomerization of C40-carotenoids by iodine. J Chem Soc Perkin Trans. 1993;2:261–266. [Google Scholar]
- Negash L, Bjorn LO. Stomatal closure by UV radiation. Physiol Plant. 1986;66:360–364. [Google Scholar]
- Ogawa T. Blue light response with stomata with starch-containing (Vicia faba) and starch-deficient (Allium cepa) guard cells under background illumination with red light. Plant Sci Lett. 1981;22:103–108. [Google Scholar]
- Ogawa T, Ishikawa H, Shimada K, Shibata K. Synergistic action of red and blue light and action spectrum for malate formation in guard cells of Vicia faba L. Planta. 1978;142:61–65. doi: 10.1007/BF00385121. [DOI] [PubMed] [Google Scholar]
- Schwartz A, Zeiger E. Metabolic energy for stomatal opening: roles of photophosphorylation and oxidative phosphorylation. Planta. 1984;161:129–136. doi: 10.1007/BF00395472. [DOI] [PubMed] [Google Scholar]
- Sharkey TD, Raschke K. Effect of light quality on stomatal opening in leaves of Xanthium strumarium L. Plant Physiol. 1981;68:1170–1174. doi: 10.1104/pp.68.5.1170. [DOI] [PMC free article] [PubMed] [Google Scholar]
- Shimazaki K, Iino M, Zeiger E. Blue light-dependent proton extrusion by guard cell protoplasts of Vicia faba. Nature. 1986;319:324–326. [Google Scholar]
- Short TW, Briggs WR. The transduction of blue light signals in higher plants. Annu Rev Plant Physiol Plant Mol Biol. 1994;45:143–171. [Google Scholar]
- Spudich JL, Bogomolni RA. Mechanism of colour discrimination by a bacterial sensory rhodopsin. Nature. 1984;312:509–513. doi: 10.1038/312509a0. [DOI] [PMC free article] [PubMed] [Google Scholar]
- Teramura AH, Tevini M, Iwanzik W. Effects of ultraviolet-B on plants during mild water stress. I. Effects on diurnal stomatal resistance. Physiol Plant. 1983;57:175–180. [Google Scholar]
- Thimann KV, Curry GM. Phototropism and phototaxis. In: Florkin M, Mason HS, editors. Comparative Biochemistry. I. New York: Academic Press; 1960. pp. 243–306. [Google Scholar]
- Wilmer C, Fricker M. Stomata. Ed 2. London: Chapman and Hall; 1996. p. 135. [Google Scholar]
- Yoshizawa T, Wald G. Visual pigments and the Keilin-Hartree effect. Nature. 1966;197:1279–1286. doi: 10.1038/212483a0. [DOI] [PubMed] [Google Scholar]
- Zeiger E. Biology of stomatal guard cells. Annu Rev Plant Physiol. 1983;34:441–475. [Google Scholar]
- Zeiger E, Zhu J. Role of zeaxanthin in blue light photoreception and the modulation of light-CO2 interactions in guard cells. J Exp Bot. 1998;49:433–442. [Google Scholar]
- Zimmermann BD, Briggs WR. Phototropic dosage-response curves for oat coleoptiles. Plant Physiol. 1963;38:248–253. doi: 10.1104/pp.38.3.248. [DOI] [PMC free article] [PubMed] [Google Scholar]


