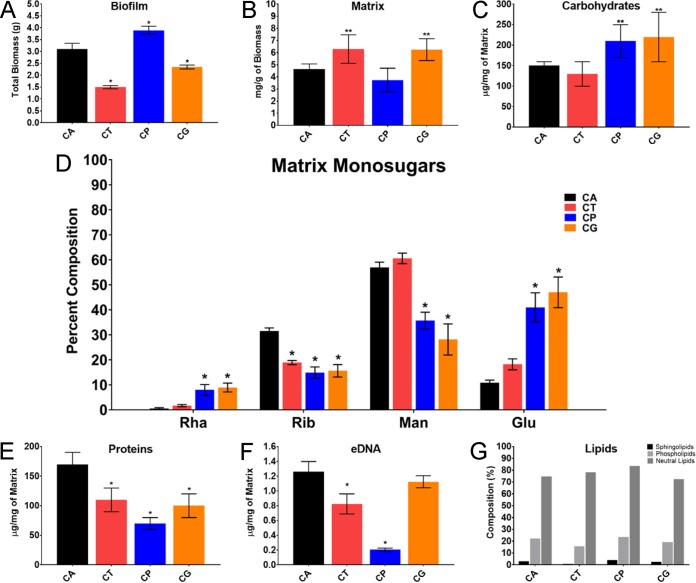
FIG 2 .
NAC form biofilm matrix of variable quantity and quality. (A) Total biofilm mass was assessed by measurements (dry weight) of in vitro biofilms grown in polystyrene roller bottles (three replicates of 20 bottles per species). The four species studied were C. albicans (CA), C. tropicalis (CT), C. parapsilosis (CP), and C. glabrata (CG). The single asterisks indicate statistically significant lower values (P < 0.001) for C. tropicalis and C. glabrata based upon ANOVA using the Holm-Sikak method for pairwise comparison. (B) Biofilm matrix biomass was quantified by the dry weight following matrix separation from biofilm cells. Biofilms were grown in polystyrene roller bottles (three replicates of five bottles per species). Two asterisks indicate statistically lower values for C. tropicalis (P = 0.003) and C. glabrata (P = 0.005) between strains based upon ANOVA using the Holm-Sikak method for pairwise comparison. (C) Biofilm matrix total carbohydrate concentration was assessed using the phenol-sulfuric acid assay. The results were normalized by matrix biomass. The single asterisks indicate statistically lower concentrations for C. parapsilosis (P = 0.009) and C. glabrata (P = 0.002) based upon ANOVA using the Holm-Sikak method for pairwise comparison. (D) Relative percent monosugar composition (Rha, rhamnose; Rib, ribose; Man, mannose; Glu, glucose) in the biofilm matrix of C. albicans, C. tropicalis, C parapsilosis, and C. glabrata. The single asterisks indicate statistically significant differences (P < 0.001) between strains based upon ANOVA. (E) Biofilm matrix total protein concentration was assessed using the BCA protein assay kit. The results were normalized by matrix biomass. The single asterisks indicate statistically lower concentrations for C. tropicalis, C. parapsilosis, and C. glabrata (P < 0.001) than for C. albicans based upon ANOVA using the Holm-Sikak method for pairwise comparison. (F) Biofilm matrix total eDNA. The results were normalized by matrix biomass. The single asterisks indicate statistically lower concentrations for C. tropicalis, C. parapsilosis, and C. glabrata (P < 0.001) than for C. albicans based upon ANOVA using the Holm-Sikak method for pairwise comparison. (G) Biofilm matrix total lipid concentration was assessed by gas chromatography. The results were normalized by matrix biomass.

