Abstract
Objectives:
To evaluate the impact of body mass index (BMI) on high blood pressure among obese children and adolescents in western region, Saudi Arabia.
Methods:
Cross-sectional data were obtained from 306 (female: 140, male: 166) child, between August 2016 and March 2017. A questioner was filled by health professionals at ambulatory pediatric clinic followed by waist-hip circumference, height, weight, and blood pressure measurement. Diastolic blood pressure (DBP) and systolic blood pressure (SBP) were adjusted to gender, height, and age. World Health Organization growth standards were used to calculate BMI z-scores.
Results:
The mean age of subjects was 10.1 years. Body mass index increased SBP by 1.722 mmHg (p=0.001), and DBP by 0.901 mmHg (p=0.006) in boys, and 0.969 mmHg (p=0.036), and DBP by 0.704 mmHg (p=0.045) in girls. Waist hip ratio showed significant difference p=0.041, (p=0.0001) between male and female. Of the baseline characteristics, age >11 years showed significant difference. Symptomatic manifestation of high blood pressure, family history of hypertension, level of activity, income level and post-secondary education in parents, did not show any significant results.
Conclusion:
Elevated BMI is associated with significantly increased diastolic and systolic blood pressure in obese children, especially in children older than 11 years.
Childhood obesity is among the serious challenges being faced in the 21st century. World Health Organization (WHO) stated that overweight and obesity in children and adolescents are in the list of major health issues that are gradually affecting many low and middle-income countries, particularly in urban settings.1 The prevalence of overweight and obesity in children and adolescents has been remarkably increasing since 1980s until now and estimated to be increased by nearly 50%. The current data shows that 10% of children are either obese or overweight worldwide.2 In Saudi Arabia, among children aged 5-18 years, the prevalence of overweight is 23.1%, obesity is 9.3%, and severe obesity is 2%.3 Overweight and obesity, as well as their related complications, are essentially preventable; therefore, require constant awareness. The current accepted standards for measurement of obesity in children of 2 years of age and older is the calculation of body mass index (BMI), which is calculated using the height and weight. Waist-to-hip ratio is also an important clinical measurement of fat distribution.4 It is estimated that the children who are obese or overweight will remain in their adulthood and more likely to develop chronic diseases such as hypertension, diabetes, arthritis, sleep apnea, cardiovascular diseases, cancer and stroke, at a younger age.5,6 Hypertension is a well-established complication, and a great risk factor for many diseases. The relation between obesity and hypertension is somehow complicated. It incorporates activation of the sympathetic nervous system and the Renin Angiotensin Aldosterone System (RAAS), leading to dilatation of the vessels with net increased in renal blood flow and renal sodium retention.7 This leads to a rise in the blood pressure. In this study, we hypothesize that high BMI and waist-hip ratio are associated with increased blood pressure measurements in obese children.
Methods
Cross-sectional data was collected between August 2016 and March 2017 using a questionnaire designed to collect information on self-reported and direct measures of health and wellness. The study population was composed of random females and males between the ages of 4 and 13 years. The sample size for this study was 306 children (female: 140, male: 166). Following appropriate consent, an interview was conducted with children in the presence of their parents, followed by weight, height, hip circumference, waist circumference, and blood pressure measurements at an ambulatory pediatric clinic. Blood pressure measurements were repeated twice at the same ambulatory clinic.
Parents answered questions for participants aged 4 to 10 years. Participants aged 11 to 13 years answered of all the questions directly by themselves. Inclusion criteria included any child with clinical assessment of primary overweight or obesity. Exclusion criteria were dietary or medical intervention, hormonal treatment exposure, endocrinopathies induced secondary obesity; serious intercurrent illness, and insufficiency of data.
Ethical approval was obtained from the Research Ethics Committee at King Abdulaziz University Hospital (KAUH) and was declared appropriate for this study.
The questionnaire comprised of general demographic information, anthropometric measurements, and questions regarding physical activity, diet, social factors, family history, and presence of illnesses or any acute or chronic complication. Level of activity was related to number of hours consumed in playing and participating in sport or school activities. Family history of hypertension (FHH) was determined if any immediate family member under age of 60 have had high blood pressure. Income level was categorized into low, middle, or high. It was carried out on the basis of total income of the family from all sources and the number of people living in the house. A numerical value was not deemed to be necessitated. Parental education was also determined if one parent had completed post-secondary education. Participants with diagnosed hypertension were asked specifically about high blood pressure symptoms (headache, blurred vision, and bleeding, namely, epistaxis or other type of bleeding).
Body mass index measurements
Weight was measured using medical weight scales with the subjects in light clothing. Height was measured in centimeters, using a medical height scale. Body mass index was defined as weight in kilograms divided by height in squared meters.8 It was calculated by means of an online pediatric BMI calculator, which additionally provided percentile values. BMI percentiles were determined for each subject according to the Centers for Disease Control and Prevention (CDC) growth charts.9
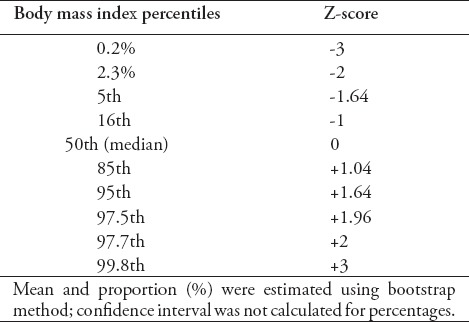
Normal BMI values lie between 5th to 85th percentiles. For overweight, BMI lies between 85th to 95th percentiles. For obesity, the limit is BMI >95th percentile and for severe obesity, it corresponded to a BMI >99th percentile. For simplicity in presenting statistical analysis results, BMI percentiles were converted to Z-scores, namely, standard deviation above the mean, using US reference data. Z-score values of <1.6 for overweight, 1.6 to 2.3 for obesity, and >2.33 for severe obesity were used.10,11 The BMI percentiles and respective Z-scores are presented in Table 1.
Table 1.
List of percentiles and Z-score conversion values.

Waist hip ratio (WHR) is the calculation of the ratio of the circumference of the waist to that of the hips to determine the fat distribution. It is calculated by dividing measurement of the waist by measurement of the hip (W/H). According to WHO, waist circumference can be measured just above the uppermost lateral border of the right ileum. It is done using a stretch-resistant tape. The circumference of the hip is measured around the widest portion of the buttocks, keeping the tape parallel to the floor.12 Women with a WHR of 0.85 or more and men with a WHR of 0.95 or more are at an increased risk of developing cardiovascular diseases. There are no specific definitions or estimations for children, but they are at an increased risk of cardiovascular diseases if they have abdominal adiposity.13 Data analyzed from the third National Health and Nutrition Examination Survey (NHANES III) revealed that the waist-to-hip ratio may indicator in association with total cholesterol, fasting triglycerides, and low-density lipoprotein cholesterol comparative to BMI in children aged 4 to 17 years.14
Blood pressure measurements
Blood pressure was measured in a sitting position, using a mercury sphygmomanometer. A cuff of appropriate size was applied around the non-dominant arm and values of systolic and diastolic measurements were identified from the onset of the first and fifth phases of Korotkoff phases. The 2004 National High Blood Pressure Education Program Working Group guidelines were used for the classification of blood pressure measurements in the children. For both systolic and diastolic, normal blood pressure is BP <90th percentile. Three main stages of hypertension were defined; pre-hypertension, stage 1, and stage 2. Pre-hypertension is systolic and/or diastolic BP ≥90th percentile, but <95th percentile. Stage 1 is systolic and/or diastolic BP between the 95th percentile and 5 mmHg >99th percentile. Stage 2 is systolic and/or diastolic BP ≥99th percentile plus 5 mm Hg.
Statistical analysis
After collecting the data, SPSS Statistics version 16.0 software (IBM Corp., Armonk, NY, USA) was used for data analysis. Standard descriptive statistics were presented as percentages or mean ± SD. For analysis and testing of the normal distribution of variables in the groups, Levine test for equality of variances was utilized. Analysis of Variance was used to analyze the differences among several group means and their associated procedures. The considerable statistically significant value of p<0.05 was taken.
Results
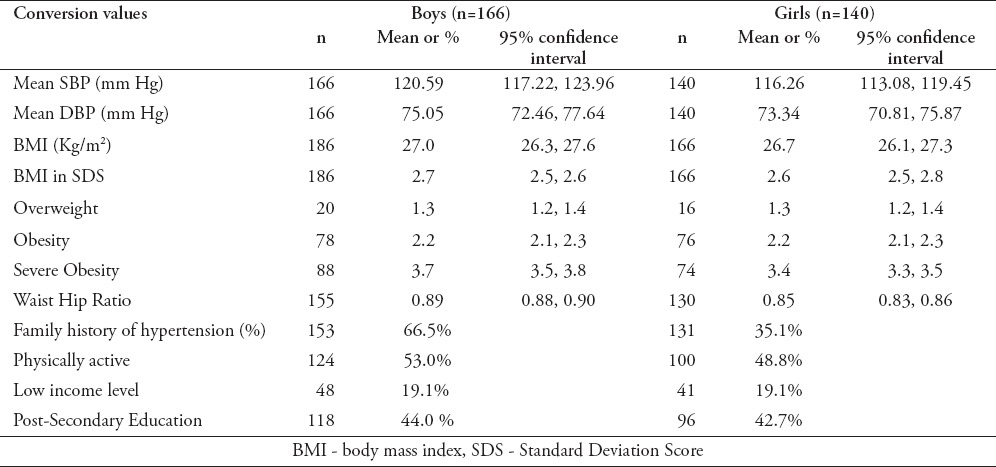
Table 2 illustrates the main characteristics of study population. The mean systolic blood pressure (SBP) and diastolic blood pressure (DBP) were higher in males; 120 mm Hg, 75 mm Hg, than females 116 mm Hg, 73 mm Hg respectively. Body mass index was slightly higher in boys (27 kg/m2) compared to girls (26.7 kg/m2). Waist hip ratio was also slightly higher in males than females. For physical activity measurements, boys were slightly more active than girls. Most subjects reported having a good income level; however 19% had low-income level. Nearly half of the subjects had parents (either mother or father) with post-secondary education.
Table 2.
Baseline characteristics of study population.

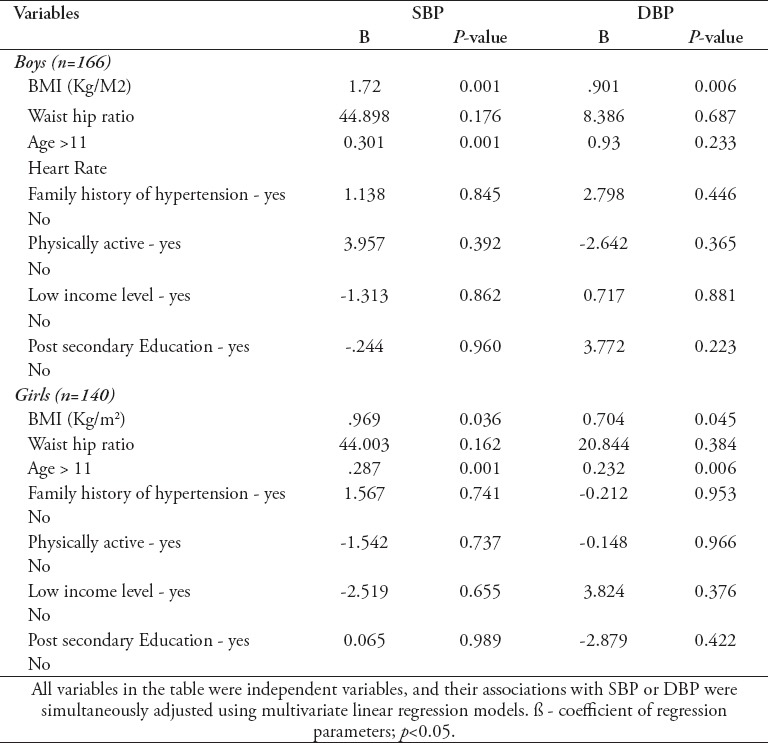
Overall, BMI showed significant relation with SBP and DBP as illustrated by Table 3. Age above 11 was the only parameter with significant results; the older the child, the higher chance of having high blood pressure.
Table 3.
Association of SBP and DBP with relevant variables according to gender.

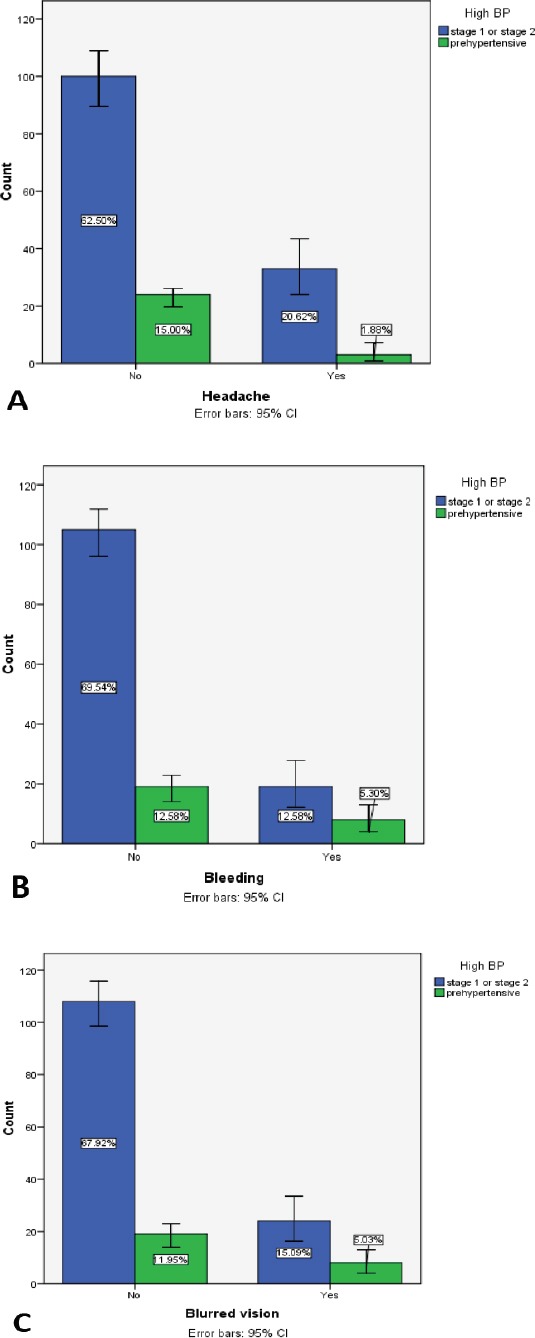
Figure 1 illustrates the presence of high blood pressure symptoms among the study population. Only 20% of the subjects with stage 1 or stage 2 hypertension had symptoms of headache. It was not significant (p=0.118) and can be related to other factors such as: stress, illness, or inappropriate perception of symptom. Headache was found in 1.8% of the subjects with pre-hypertension. For blurred vision, 15% of the subjects with stage 1/stage 2, and 5% of pre-hypertensive subjects had the symptoms. This was not significant (p=0.456). For bleeding, approximately 12% of the subjects had stage 1/stage 2, and only 5% with pre-hypertension had the symptom. This was also not significant with a p-value of 0.888.
Figure 1.

Symptoms of high blood pressure among study population. Values in bar charts were calculated per percentage. 95% CI, confidence interval for standard error is calculated for all bars.
Discussion
In this study, we examined the effect of BMI, waist-to-hip ratio, on SBP and DBP values among obese children.
Significant correlation was found between elevated BMI and both elevated systolic and diastolic blood pressure. Waist hip ratio did not show any significant results. Increase in body fat and consequently BMI is highly related to age, and therefore, it can be a weaker predictor for measurement in children.12 Yet, the risk for cardiovascular diseases is higher in the children who have abdominal adiposity. On the other hand, it is also indicated that in children aged 4 to 17 years, the waist-to-hip ratio may be a better predictor than BMI.
Another significant result was the effect of age on blood pressure. As it was found that ‘subjects with age above 11’ was the only parameter with significant results. This can be attributed to hormonal influence as children approach puberty.15,16 In boys, age increased SBP by 0.301 and DBP by 0.93, and in girls, age increased SBP by 0.287 and DBP by 0.232. Family history of hypertension, level of activity, income level, and post-secondary education in parents did not show any significant results. Heart rate measurements was not added in this study due to insufficient data.
In review of the literature, many studies assert a correlation between obesity and elevated blood pressure. One study by Flynn et al revealed that there is approximately 3-fold increased risk in obese children for developing hypertension rather than non-obese children, in which isolated systolic hypertension is the characteristic fact in most of the children.17 Another study conducted by Aguilar et al18 demonstrated that severe obesity with BMI Standard Deviation Score (SDS) >2.5 had significant impact on the higher SBP and significantly higher mean, compared to mild and moderate obesity (BMI SDS 2.5).18
A study conducted by Friedemannet et al19 revealed a significant increase in blood pressure by 4.54 mm Hg and 7.49 mm Hg in obese children. Another study was conducted to evaluate the gender differences among a population and it was revealed that only obese adolescent boys had higher diastolic blood pressure.15 However, the effect of obesity on blood pressure appeared in the young girls earlier compared to boys. Moreover, this study also evaluated the family history of hypertension and physical activity. The adolescent boys who were less active had SBP which was higher by 3.9 mm Hg and DBP by 4.9 mm Hg than the boys who were physically active.
The studies conducted to determine the metabolic status of children and adolescence showed significant correlation between waist circumference, BMI, and elevated blood pressure (p<0.001).20,21 It was compared with individuals, who were metabolically healthy and normal-weight, metabolically unhealthy normal-weight (MUNW), and the metabolically healthy obese (MHO) individuals had higher waist circumference and BMI.
Furthermore, in our study, a unique trial was tested to evaluate the presence of symptoms when randomly screening the population for hypertension. The number of subjects reporting symptoms was low, and thus, results were not significant. This was predictable as symptomatic subjects will more likely seek medical attention to evaluate underlying etiology of their symptoms. This explains the reason why measuring blood pressure to screen for hypertension is not a standardized medical practice today.
Study limitation
We must point to a limitation in our study as we completed only 2 measurements of blood pressure. The gold standard approach is 3 separate measurements to qualify the diagnosis of hypertension. Yet, here we aimed to report changes in systolic/diastolic blood pressure measurements rather than diagnosing children with hypertension.
In conclusion, obesity is an important predictor of many diseases affecting the human body. High BMI significantly correlates with increased SBP and DBP in obese children. Waist hip ratio, family history of hypertension, level of physical activity, parental education, and income level did not show significant correlation. We recommend healthy diet and regular physical activity to prevent obesity and its harmful comorbidies. Further studies evaluating the effect of obesity in a larger scale, with preventive and management approaches would be highly valuable.
Footnotes
Disclosure.
References
- 1.World Health Organization. Childhood overweight and obesity. Global Strategy on Diet, Physical Activity and Health. [[cited 2017]]. Available from URL: http://www.who.int/dietphysicalactivity/childhood/en/
- 2.World Health Organization. Facts and figures on childhood obesity. Commission on ending childhood obesity. [[cited 2017]]. Available from URL: http://www.who.int/end-childhood-obesity/facts/en/
- 3.Shehri AA, Al Fattani A, Al Alwan I. Obesity among Saudi children. Saudi Journal of Obesity. 2013;1:3–9. [Google Scholar]
- 4.Centers for Disease Control and Prevention. Body mass index. [[cited 2015]]. Available from URL: http://www.cdc.gov/healthyweight/assessing/bmi/
- 5.Al-Dossary SS, Sarkis PE, Hassan A, Ezz El Regal M, Fouda AE. Obesity in Saudi children: a dangerous reality. East Mediterr Health J. 2010;16:1003–1008. [PubMed] [Google Scholar]
- 6.Memish ZA, El Bcheraoui C, Tuffaha M, Robinson M, Daoud F, Jaber S, Mikhitarian S, et al. Obesity and associated factors--Kingdom of Saudi Arabia, 2013. Prev Chronic Dis. 2014;11:E174. doi: 10.5888/pcd11.140236. [DOI] [PMC free article] [PubMed] [Google Scholar]
- 7.Re RN. Obesity-related hypertension. Ochsner J. 2009;9:133–136. [PMC free article] [PubMed] [Google Scholar]
- 8.Flegal KM, Wei R, Ogden CL, Freedman DS, Johnson CL, Curtin LR. Characterizing extreme values of body mass index-for-age by using the 2000 Centers for Disease Control and Prevention growth charts. Am J Clin Nutr. 2009;90:1314–1320. doi: 10.3945/ajcn.2009.28335. [DOI] [PubMed] [Google Scholar]
- 9.Centers for Disease Control and Prevention. Percentile data files with LMS values. [[cited 2009]]. Available from URL: http://www.cdc.gov/growthcharts/percentile_data_files.htm .
- 10.Bassali R, Waller JL, Gower B, Allison J, Davis CL. Utility of waist circumference percentile for risk evaluation in obese children. Int J Pediatr Obes. 2010;5:97–101. doi: 10.3109/17477160903111722. [DOI] [PMC free article] [PubMed] [Google Scholar]
- 11.Almeida SM, Furtado JM, Mascarenhas P, Ferraz ME, Silva LR, Ferreira JC, et al. Anthropometric predictors of body fat in a large population of 9-year-old school-aged children. Obes Sci Pract. 2016;2:272–281. doi: 10.1002/osp4.51. [DOI] [PMC free article] [PubMed] [Google Scholar]
- 12.World Health Organization. Waist circumference and waist-hip ratio: Report of a WHO expert consultation. Geneva: WHO; 2008. [Google Scholar]
- 13.Nambiar S, Hughes I, Davies PS. Developing waist-to-height ratio cut-offs to define overweight and obesity in children and adolescents. Public Health Nutr. 2010;13:1566–1574. doi: 10.1017/S1368980009993053. [DOI] [PubMed] [Google Scholar]
- 14.Browning LM, Hsieh SD, Ashwell M. A systematic review of waist-to-height ratio as a screening tool for the prediction of cardiovascular disease and diabetes:0·5 could be a suitable global boundary value. Nutr Res Rev. 2010;23:247–269. doi: 10.1017/S0954422410000144. [DOI] [PubMed] [Google Scholar]
- 15.Shi Y, de Groh M, Morrison H. Increasing blood pressure and its associated factors in Canadian children and adolescents from the Canadian Health Measures Survey. BMC Public Health. 2012;12:388. doi: 10.1186/1471-2458-12-388. [DOI] [PMC free article] [PubMed] [Google Scholar]
- 16.Skinner AC, Perrin EM, Moss LA, Skelton JA. Cardiometabolic risks and severity of obesity in children and young adults. N Engl J Med. 2015;373:1307–1317. doi: 10.1056/NEJMoa1502821. [DOI] [PubMed] [Google Scholar]
- 17.Flynn JT, Daniels SR, Hayman LL, Maahs DM, McCrindle BW, Mitsnefes M, et al. Update: Ambulatory Blood Pressure Monitoring in Children and Adolescents. Hypertension. 2014;63:1116–1135. doi: 10.1161/HYP.0000000000000007. [DOI] [PMC free article] [PubMed] [Google Scholar]
- 18.Aguilar A1, Ostrow V, De Luca F, Suarez E. Elevated ambulatory blood pressure in a multi-ethnic population of obese children and adolescents. J Pediatr. 2010;156:930–935. doi: 10.1016/j.jpeds.2009.12.028. [DOI] [PubMed] [Google Scholar]
- 19.Friedemann C, Heneghan C, Mahtani K, Thompson M, Perera R, Ward AM. Cardiovascular disease risk in healthy children and its association with body mass index: systematic review and meta-analysis. BMJ. 2012;345:e4759. doi: 10.1136/bmj.e4759. [DOI] [PMC free article] [PubMed] [Google Scholar]
- 20.Lambert M, Van Hulst A, O'Loughlin J, Tremblay A, Barnett TA, Charron H, et al. Cohort profile: the Quebec adipose and lifestyle investigation in youth cohort. Int J Epidemiol. 2012;41:1533–1544. doi: 10.1093/ije/dyr111. [DOI] [PubMed] [Google Scholar]
- 21.Ding WQ, Yan YK, Zhang MX, Cheng H, Zhao XY, Hou DQ, et al. Hypertension outcomes in metabolically unhealthy normal-weight and metabolically healthy obese children and adolescents. J Hum Hypertens. 2015;29:548–554. doi: 10.1038/jhh.2014.124. [DOI] [PubMed] [Google Scholar]


