Abstract
Hepatocyte to biliary transdifferentiation has been documented in various models of bile duct injury. In this process, mature hepatocytes transform into mature biliary epithelial cells by acquiring biliary phenotypic markers. Several signaling pathways including PI3 kinase, Notch, Hes1, Sox9, and Hippo are shown to be involved in the process. However, whether Oct4 is involved in hepatocyte to biliary transdifferentiation is unknown. We investigated the role of Oct4 in hepatocyte to biliary transdifferentiation utilizing an in vitro organoid culture system as a model of transdifferentiation. Oct4 was inhibited using adenovirus containing Oct4 shRNA. Hepatocyte-specific HNF-4α and biliary-specific HNF-1β and CK19 expression were assessed to gauge the extent of transdifferentiation. Oct4 was induced during hepatocyte to biliary transdifferentiation. Oct4 inhibition significantly downregulated the appearance of biliary cells from hepatocytes. This was accompanied by a significant downregulation of signaling pathways including Notch, Sox9, and Hippo. Our findings suggest that Oct4 is crucial for hepatocyte to biliary transdifferentiation and maturation and that it acts upstream of Notch, Sox9, and Hippo signaling in this model. This finding identifies new signaling through Oct4 in plasticity between hepatocytes and biliary epithelial cells, which can be potentially utilized to identify new strategies in chronic biliary diseases.
Key words: Cholangiocyte differentiation, Organoid culture, Signaling pathways, Oval cells, Cholestatic liver diseases
INTRODUCTION
Transdifferentiation, also known as lineage reprogramming, is a process where one mature somatic cell transforms into another mature somatic cell without undergoing an intermediate pluripotent state1. Hepatocyte to biliary transdifferentiation (HBT) is activated when there is extensive loss of functional biliary cells and the resident biliary cells are unable/insufficient to proliferate to compensate for the loss. Under such situations, hepatocytes can transdifferentiate to biliary cells and help regenerate the bile ducts2–4. There is now growing evidence for this pathway, and current and future studies in this area are geared toward identifying the mechanisms and drivers that bring about this change. In recent years, many efforts have been aimed at generating pluripotent stem cells from somatic cells by inducing high expression of a combination of transcription (reprogramming) factors including Sox2, octamer-binding protein 4 (Oct4), Nanog, Klf4, and cMyc5–7. While these reprogramming factors are expressed in stem cells, their expression in adult somatic cells with high potential for clonal expansion such as hepatocytes has been less explored. Our previous study has documented that adult rat liver expresses some of these reprogramming factors in hepatocytes and biliary cells during liver regeneration and hepatocyte proliferation8. We further demonstrated that inhibition of these reprogramming factors affects the survival and proliferation of hepatocytes in culture. Oct4 has been previously shown to be involved with cellular reprogramming in mammalian embryogenesis9,10. High expression of Oct4 is also associated with dedifferentiation of somatic cells in prostrate11 and breast12 tumorigenesis. However, whether Oct4 is involved in HBT (a process involving somatic cell reprogramming) is not known and is the objective of the present study. We chose the in vitro organoid culture model of HBT for this purpose due to ease of mechanistic intervention. Primary hepatocytes, when cultured in roller bottles with chemically defined hepatocyte growth medium (HGM)13, transdifferentiate into biliary epithelial cells over a period of 21 days14,15. In this model, the top/surface layer of hepatocytes facing the culture medium starts transdifferentiating into biliary epithelial cells between days 6 and 1014. Previous studies have established that it is the hepatocytes that transdifferentiate into biliary epithelial cells both in vivo and in this model, using the DPPIV chimeric rat liver in which DPPIV was only expressed in hepatocytes4,14. To investigate the role of Oct4 in HBT, we inhibited Oct4 in this system using adenovirus containing short hairpin RNA (shRNA) for Oct4. Various signaling pathways that have previously been shown to participate in transdifferentiation were also assessed in this model. Notch signaling is involved with liver regeneration16,17 and biliary proliferation18. Recent studies have also identified the role of Notch signaling19 and Hippo pathway20 in in vivo models of HBT. Hence, we looked at the expression of Notch and Yes-associated protein 1 (Yap1, Hippo pathway) in our model before and after Oct4 inhibition. Sekiya and Suzuki have reported that Hes family transcription factor 1 (Hes1) is essential for the conversion of hepatocytes into biliary lineage cells at the onset of intrahepatic colangiocarcinoma21. Thus, we also looked at Hes1 levels before and after Oct4 inhibition. Other studies have identified “liver progenitor cells” that have differentiated into hepatocytes or biliary cells in different cell injury models. These progenitor cells are identified based on the expression of markers such as Lgr522, Afp23, Sox924,25, and OV626, among others. Whether hepatocytes that transdifferentiate to biliary cells express any of these progenitor markers is not known and was also investigated in the present study. Farnesoid X receptor (Fxr) acts as a bile acid sensor27 and, upon binding with bile acids and activation, translocates to the nucleus and induces or inhibits the expression of a variety of genes involved in metabolism and lipid homeostasis28. Fxr-dependent bile acid signaling is also required for normal liver regeneration29. Rat and human primary hepatocyte cultures are known to release bile acids in media30. In the hepatocyte organoid culture (transdifferentiation model), the surface/top layer of hepatocytes (which gets maximum exposure to bile acids in the media) is the one that undergoes transdifferentiation to biliary epithelial cells. To assess if Fxr signaling is altered in hepatocytes during HBT, Fxr levels were also investigated in this model.
MATERIALS AND METHODS
Organoid Cultures
Male Fisher 344 rats (150–200 g) were purchased from Charles River Laboratories (Fredrick, MD, USA). Animals were allowed food and water ad libitum. All animals received humane care according to the criteria outlined in the Guide for the Care and Use of Laboratory Animals prepared by the National Academy of Sciences and our institute. Hepatocytes were isolated by adaptation of the calcium two-step collagenase perfusion technique as previously described13,31. Freshly isolated hepatocytes were added to roller bottles (850-cm2 surface) obtained from Falcon (Franklin Lakes, NJ, USA). Each bottle contained 210,000,000 freshly isolated hepatocytes in 250 ml of HGM medium supplemented with hepatocyte growth factor (HGF; 20 ng/ml) and epidermal growth factor (EGF; 10 ng/m). The bottles were rotated at a rate of 2.5 rotations per minute and kept in an incubator maintained at 37°C, saturated humidity, and 5% CO2. The composition of HGM has been described previously15. Organoid culture tissue was harvested on days 3, 6, 10, 15, and 21 for immunohistochemistry as well as mRNA and protein extraction for further analysis.
Total RNA Extraction
Total RNA was extracted from plated cells according to the manufacturer’s protocol using the RNA Bee reagent (Invitrogen, Carlsbad, CA, USA). The isolated RNA was treated with Turbo DNA-free (Ambion, Austin, TX, USA) according to the manufacturer’s instructions. RNA was quantified by spectrophotometry at 260 nm, and purity was assessed by optical density 260/280 ratio. The RNA was stored at −80°C.
cDNA Synthesis
Five micrograms of RNA per sample was reverse transcribed using random hexamer to cDNA using SuperScriptIII reverse transcriptase (RT; Invitrogen) according to the manufacturer’s protocol. A no RT control was also included.
Real-Time RT-PCR
Gene-specific primers used for rat were obtained from SuperArray Biosciences Corporation as follows: GAPDH (PPR06557B), Oct4 (PPR59727A), HNF-4α (PPR49773A), hepatocyte nuclear factor-1β (HNF-1β; PPR45380A), CK19 (PPR44322A), Sox9 (PPR53329A), Afp (PPR44288A), Notch1 (PPR47971A), Notch2 (PPR51608A), Hes1 (PPR46895C), and Yap1 (PPR54845A). Expression levels were determined by quantitative reverse transcription polymerase chain reaction (qRT-PCR) using SYBR Green, and levels were normalized relative to the expression of GAPDH in each sample. Fold change in gene expression was calculated using the 2 (−ΔΔCt) method32. Reverse-transcribed samples were amplified in parallel on an ABI PRISM 7000 SDS instrument (Applied Biosystems, Foster City, CA, USA). qRT-PCR for each sample was performed in triplicate in a 20-μl reaction with 50 ng of cDNA, 5 pmol of each primer, and 1× SYBR GREEN PCR mix (#330510, Qiagen). The standard conditions for real-time PCR were as follows: 2 min at 50°C, 10 min at 95°C followed by 40 cycles of 15-s denaturation at 95°C, and elongation at 60°C for 45 s. A dissociation curve analysis was performed at the end of every run. A no RT and a no template control were also included in every run. PCR products were resolved on 2% agarose gels and visualized with GelRed™ Nucleic Acid Gel Stain.
Oct4 Inhibition Studies
Adenovirus containing shRNA for Oct4 was made at the University of Pittsburgh virus core facility. shRNA targeting rat Oct4 was cloned in the BamH1–Kpn1 site of adenovirus shuttle vector under the control of the human H1 promoter with enhanced green fluorescent protein (eGFP) marker. Appropriate scrambled shRNA controls were also included. We confirmed authenticity of the clones by digesting with Sfi 1 enzyme and sequencing (M13 forward). Organoid cultures were treated with either adenovirus containing scramble shRNA (AD-Scr, control) or Oct4 shRNA (AD-Oct4). Knockdown efficiency of target genes was confirmed by transfecting primary mouse hepatocytes using standard protocols. Multiplicity of infection (MOI) of 5 was determined to be optimal for infection of primary hepatocytes based on pilot studies. Tissue was collected on day 21.
The rat Oct4 target sequence used was as follows: 5′-GATCCGAACCGTGTGAGGTGGAACTCAAGAGGTTCCACCTCACACGGTTCTTTTTTGGTAC-3′ (forward oligo) and 5′-CAAAAAA GAACCGTGTGAGGTGGAACCTCTTGAGTTCCACCTCACACGGTTCG-3′ (reverse oligo).
Oct4 ELISA
Protein levels in nuclear extracts were assessed by harvesting cells from day 21 organoid cultures treated with AD-Scr and AD-Oct4. Nuclear extracts were prepared using NE-PER Nuclear and Cytoplasmic Extraction Kit according to the manufacturer’s protocol (Cat. No. 78833; Pierce Biotechnology, Rockford, IL, USA). For Oct4 ELISA, 50 μg of total protein was used according to the manufacturer’s protocol (MBS2501619; MyBiosource, San Diego, CA, USA).
Immunohistochemistry on Organoid Culture Tissues
Paraffin-embedded tissue sections (4 μm thick) were used for hematoxylin and eosin (H&E) as well as immunohistochemical staining. Antigen retrieval was achieved by heating the slides in the microwave at high power in 1× citrate buffer for 10 min. The tissue sections were blocked in blue blocker for 20 min followed by incubation with primary antibody overnight at 4°C. The primary antibody was then linked to biotinylated secondary antibody followed by routine avidin–biotin complex method. Diaminobenzidine was used as the chromogen, which resulted in a brown reaction product. Primary antibodies used were as follows: Oct4 (ab27985; 1:100), HNF-4α (H1415; 1:500; R&D), and HNF-1β (SC7411; 1:250).
Statistical Evaluation
The statistical analysis was performed using SPSS v22 (IBM Corp., Chicago, IL, USA). The data were analyzed using repeated-measures one-way analysis of variance (RMANOVA) for time course studies and independent Student’s t-test for Oct4 inhibition studies. The results are expressed as means ± SEM obtained from three independent experiments. A value of p ≤ 0.05 was considered as statistically significant and a value of p ≤ 0.001 as highly significant.
RESULTS
Organization of Organoid Cultures
H&E Stain
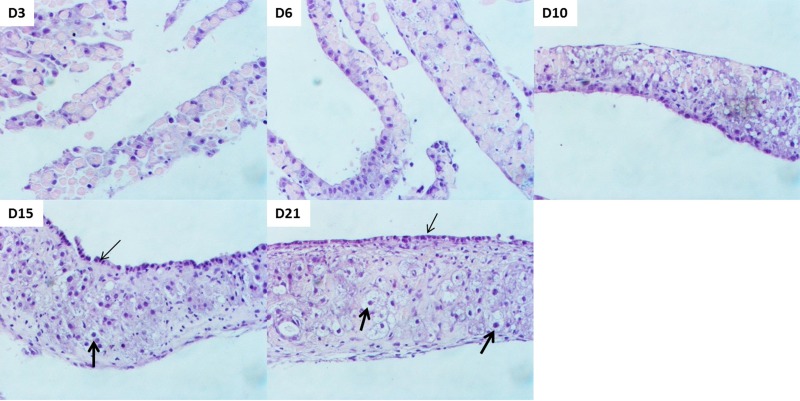
The organoid cultures were started with freshly isolated hepatocytes following liver perfusion. Tissue samples collected over a time course of 21 days exhibited the following development (Fig. 1). At day 3, the hepatocytes formed small islands in a random fashion. Over time, the hepatocytes aligned themselves on top of each other to form a multilayered tissue. By day 6, a more distinct pattern of cells appeared as some hepatocytes aligned themselves to form the top layer. On days 10 and 15, the culture looked more defined with the hepatocyte nuclei of the top layer appearing smaller and cuboidal (potentially undergoing HBT) compared to the bigger and rounder hepatocyte nuclei in the intermediate layer (thick arrows). By day 21, the organoid culture was complete with visibly distinct nuclei of hepatocytes and biliary epithelial cells. It consisted of multilayered cells arranged in a three-dimensional fashion, with the top layer of biliary epithelial cells facing the media (Fig. 1, thin arrows), an intermediate layer of hepatocytes (Fig. 1, thick arrows) and connective tissue, and a basal layer of endothelial cells attached to the inner surface of the bottle. The endothelial cells in this system are most likely from a small number of contaminating cells during liver perfusion and isolation of primary hepatocytes15. These observations are consistent with a previous study establishing this model for HBT14,15.
Figure 1.
Organization of cells in organoid culture. Representative photomicrographs of hematoxylin and eosin (H&E)-stained tissue samples obtained over a time course of 21 days. Biliary cells with smaller cuboidal nuclei appear at the surface layer (thin arrows), whereas hepatocytes with bigger round nuclei form the intermediate later (thick arrows). Original magnification: 200×.
Appearance of Biliary Cells
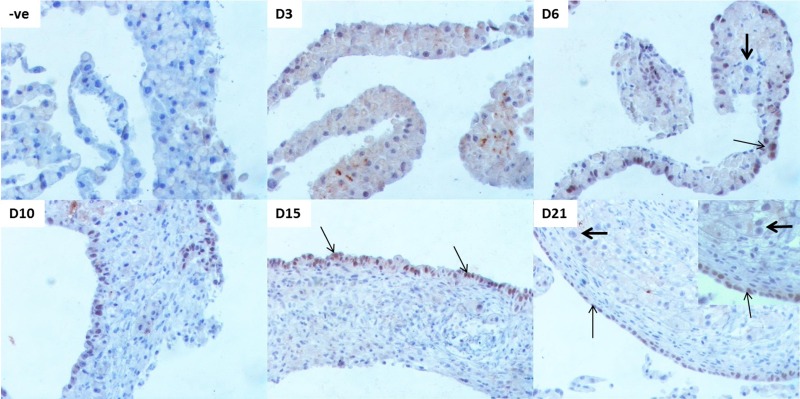
Biliary-specific HNF-1β was used to assess the appearance of biliary epithelial cells in this model. As expected, we did not see any biliary cells at the beginning of hepatocyte culture at day 3 (Fig. 2). By day 6, some nuclei stained positive for this biliary marker. The HNF-1β+ cells were scattered throughout the organoid culture and did not form a distinct layer. Note that many of these nuclei that stained positive for HNF-1β were rounder and bigger (resembling hepatocyte nuclei) rather than cuboidal and smaller (resembling biliary nuclei), indicating the acquisition of biliary markers by hepatocytes (Fig. 2, D6, thin arrow) on their path to becoming biliary cells. These were the cells that would potentially transdifferentiate and mature to a biliary phenotype as the culture progressed. This changed by day 10, when a majority of these positive nuclei had aligned themselves at the surface layer position and the positive nuclei were smaller and cuboidal compared to the bigger and round hepatocyte nuclei in the intermediate later. By day 15, a distinct surface layer of HNF-1β+ nuclei was visible (thin arrows). By day 21, the biliary layer was very well defined (thin arrows). All the nuclei in the intermediate layer were negative for HNF-1β, indicating their commitment to the hepatocytic phenotype (Fig. 2, thick arrows).
Figure 2.
Appearance of biliary cells that form hepatocytes over a time course of 21 days in organoid culture. Representative photomicrographs of biliary-specific marker HNF-1β in organoid culture tissue samples. –ve represents “no primary antibody” control. Thin arrows indicate HNF-1β+ nuclei undergoing/undergone hepatocyte to biliary transdifferentiation (HBT). Thick arrows indicate HNF-1β− nuclei that retain a hepatocytic phenotype. Original magnification: 200×, inset: 400×.
Oct 4 Is Induced During Transdifferentiation
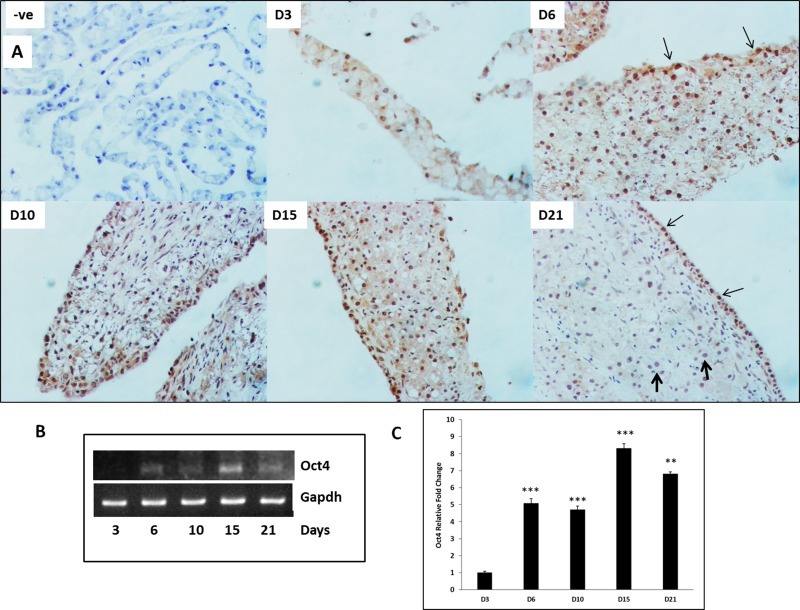
To determine if Oct4 is induced in hepatocytes during transdifferentiation, Oct4 expression was measured at the mRNA and protein levels over a time course in organoid cultures (Fig. 3). Immunohistochemical staining indicated numerous Oct4+ nuclei at day 6 (Fig. 3A) scattered throughout the tissue. By days 10 and 15, the staining pattern became more distinct with nuclei in the surface layer (potential biliary cells, thin arrows) staining stronger than nuclei in the intermediate layer (that remain hepatocytes). Some nuclei remained negative for Oct4, indicating their commitment to the hepatocytic phenotype. By day 21, the newly formed biliary cells that underwent transdifferentiation stained strongly for Oct4 (thin arrows), whereas the hepatocyte nuclei in the intermediate layer that did not transdifferentiate were negative (thick arrows). Oct4 was also significantly induced as early as 6 days in cultures when compared to day 3 (Fig. 3B and C) and remained elevated through day 21 in cultures. Oct4 expression also exhibited two waves of induction, first at day 6 and second at day 15.
Figure 3.
Oct4 expression during HBT over a time course of 21 days in organoid culture. (A) Representative photomicrographs of Oct4 immunohistochemistry in organoid culture tissue samples. –ve represents “no primary antibody” control. Thin arrows indicate Oct4+ nuclei undergoing HBT. Thick arrows indicate Oct4− nuclei that retain hepatocytic phenotype. Original magnification: 200×. (B) Representative blots of polymerase chain reaction (PCR) product and (C) mRNA levels assessed by quantitative reverse transcription (qRT)PCR) and expressed as fold change relative to GAPDH. Significantly different from day 3 (D3) time point: **p ≤ 0.01, ***p ≤ 0.001.
Biliary Markers and Precursors Are Induced During HBT
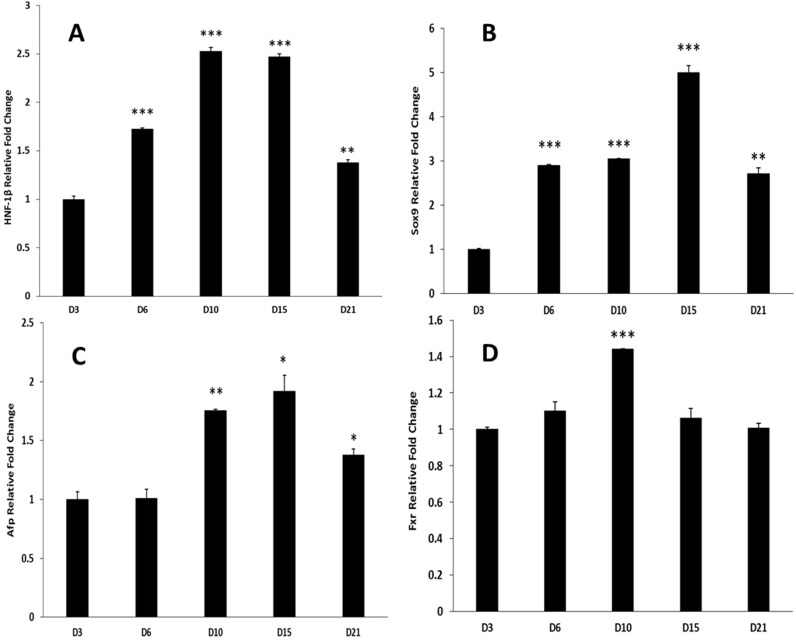
Biliary-specific nuclear factor HNF-1β was significantly induced starting at day 6 and remained elevated through day 21 in cultures (Fig. 4A). This corroborates with the generation of biliary phenotype in this model (Fig. 2). Sox9, which is shown to be a biliary precursor/marker, increased significantly on day 6 compared to day 3 and remained elevated through day 21 in cultures (Fig. 4B). Biphenotypic marker Afp expression was significantly induced at day 10 in culture compared to day 3 and remained induced through day 21 (Fig. 4C). LGR5 and OV6 were assessed but were not detectable in our model. Bile acid receptor Fxr was induced significantly on day 10 and came back to day 3 levels by day 15 (Fig. 4D).
Figure 4.
Genes involved with HBT in organoid culture over a time course of 21 days. mRNA levels of (A) HNF-1β, (B) Sox9, (C) Afp, and (D) Fxr as assessed by qRT-PCR and expressed as fold change relative to GAPDH. Significantly different from D3 time point: *p ≤ 0.05, **p ≤ 0.01, ***p ≤ 0.001.
Oct4 Inhibition Studies
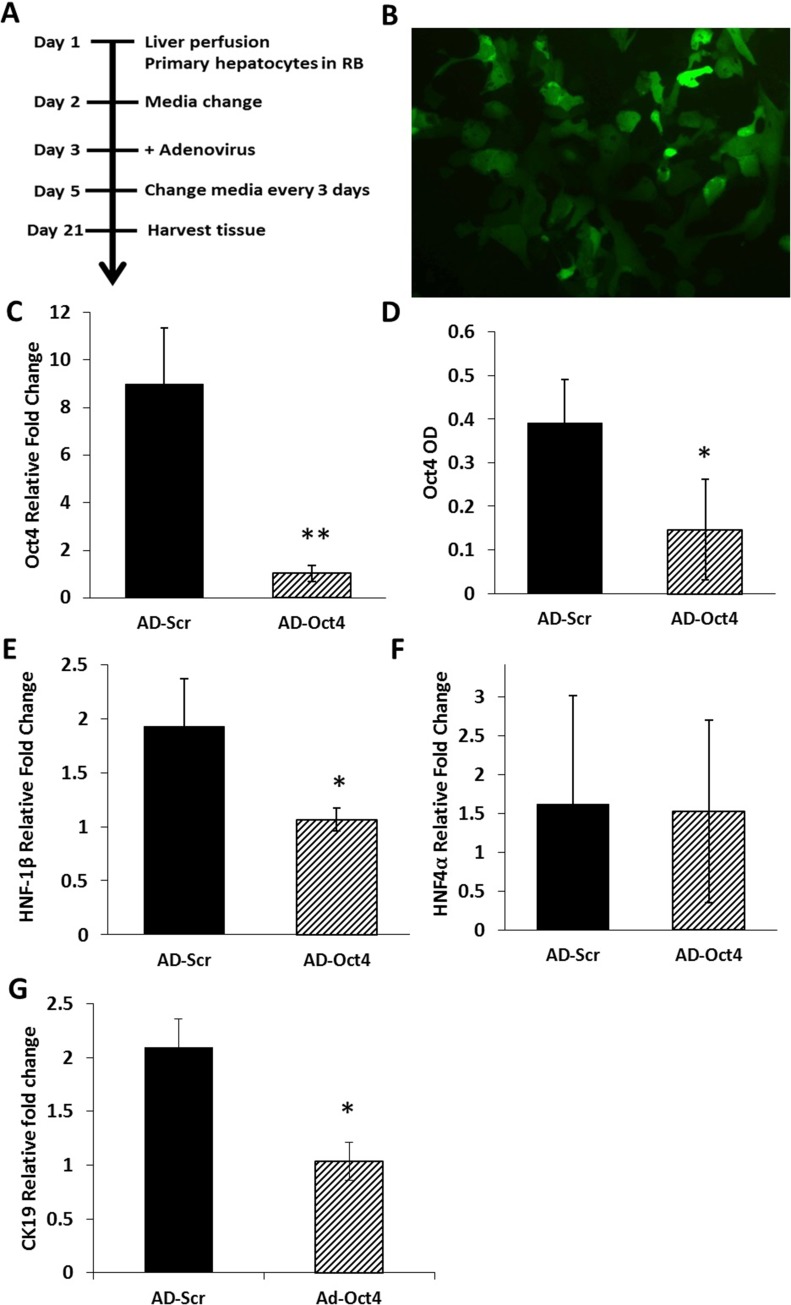
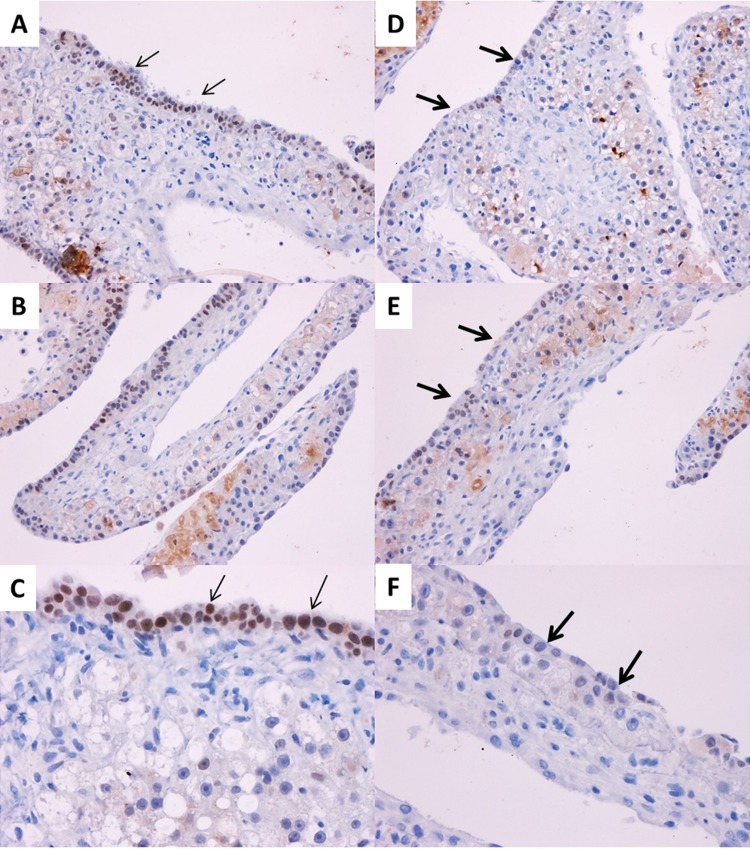
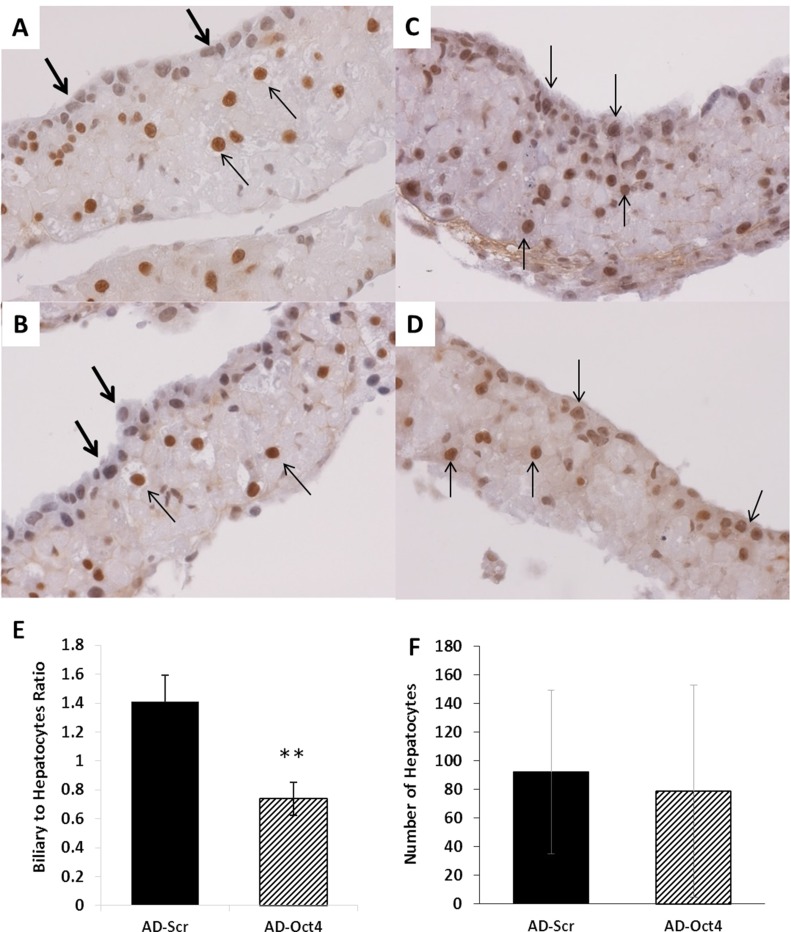
Oct4 was inhibited using adenovirus containing shRNA for Oct4 (AD-Oct4) or scramble controls (AD-Scr) as shown in Figure 5A. Transfection of hepatocyte cultures led to 70% transfection as assessed by eGFP through day 14 in culture without significant toxicity (Fig. 5B). Tissue samples from culture were collected at day 21 for all assessments following Oct4 inhibition. We observed the following: Oct4 expression: Oct4 mRNA (Fig. 5C) and protein (ELISA) (Fig. 5D) on day 21 were significantly lower in the AD-Oct4 group compared to the AD-Scr group, indicating that Oct4 was successfully inhibited using our experimental protocol. Biliary-specific markers HNF-1β and CK19 were significantly downregulated in the AD-Oct4 group compared to AD-Scr controls (Fig. 5E and G). At the same time, there were no significant differences in hepatocyte-specific marker HNF-4α expression between the AD-Scr and AD-Oct4 groups, suggesting that Oct4 inhibition did not negatively affect the hepatocytes (Fig. 5F). Decreased biliary marker expression was further corroborated by HNF-1β staining pattern. While the AD-Scr group exhibited abundant HNF-1β+ biliary cells at the surface layer of cultures (Fig. 6A–C, thin arrows), such cells were very scarce in the AD-Oct4 group (Fig. 6D–F). Moreover, the staining intensity was also lower in the Oct4-inhibited group. We did observe, however, that the cells at the surface of the organoid culture in the AD-Oct4 group, even though mostly negative for HNF-1β, were smaller than hepatocytes with an intermediate morphology (Fig. 6D–F, thick arrows). Most of these HNF-1β− cells turned out to be positive for hepatocyte-specific HNF-4α (Fig. 7C and D), suggesting that these cells were not able to complete their transition from hepatocyte to biliary phenotype. On the contrary, surface layer cells of the AD-Scr cultures were negative for HNF-4α staining (Fig. 7A and B, thick arrows), suggesting their successful transition to biliary lineage.
Figure 5.
Oct4 inhibition in organoid cultures. (A) Timeline for Oct4 inhibition using adenovirus in organoid culture. (B) Enhanced green fluorescent protein (eGFP) in hepatocytes infected with adenovirus containing short hairpin RNA (shRNA) for Oct4, multiplicity of infection (MOI) 5, >70% infection observed at day 14 in culture. Original magnification: 100×. (C–G) Analyzed from D21 samples treated with shRNA for Oct4 (AD-Oct4) or shRNA for scramble control (AD-Scr). (C) mRNA levels of Oct4 assessed by qRT-PCR and expressed as fold change relative to GAPDH. (D) Oct4 protein assessed by sELISA. mRNA levels as assessed by qRT-PCR and expressed as fold change relative to GAPDH of (E) biliary-specific marker HNF-1β, (F) hepatocyte-specific marker HNF-4α, and (G) biliary-specific marker CK19. Significantly different from AD-Scr control: *p ≤ 0.05, **p ≤ 0.01.
Figure 6.
Appearance of biliary cells from hepatocytes following Oct4 inhibition. Representative photomicrographs of biliary-specific marker HNF-1β following Oct4 inhibition in organoid culture tissue samples on day 21. (A–C) Treated with AD-Scr. (D–F) Treated with AD-Oct4. Thin arrows indicate HNF-1β+ biliary cells. Thick arrows indicate lack of HNF-1β+ biliary cells. Original magnification: 200× (A, B, D, and E) and 400× (C, F).
Figure 7.
Effect of Oct4 inhibition on hepatocytes. Representative photomicrographs of hepatocyte-specific HNF-4α following Oct4 inhibition in organoid culture tissue samples on day 21. (A, B) Treated with AD-Scr. (C, D) Treated with AD-Oct4. Thick arrows indicate HNF-4α− cells. Thin arrows indicate HNF-4α+ cells. Original magnification: 400×. Cell counts of hepatocytes and biliary epithelial cells following Oct4 inhibition. (E) Biliary-to-hepatocyte ratio and (F) number of hepatocytes. Significantly different from AD-Scr control: **p ≤ 0.01.
Hepatocytes and biliary cells were counted in tissue sections stained for HNF-1β before and after Oct4 inhibition in organoid culture. The following criteria were used for identification of cells: hepatocytes: HNF-1β− (blue) big round nuclei; biliary cells: HNF-1β+ (brown) small cuboidal nuclei. One ribbon of organoid culture tissue was considered as one unit. The numbers of hepatocytes and biliary cells in each unit were counted. Over 100 such ribbons were assessed from the AD-Scr and AD-Oct4 treatment groups. Following Oct4 inhibition, there was a significant decrease in biliary-to-hepatocyte cell ratio compared to AD-Scr controls (Fig. 7E). The total number of hepatocytes between the two groups was comparable (Fig. 7F), indicating that Oct4 inhibition did not affect the viability of hepatocytes that might have led to decreased biliary cells.
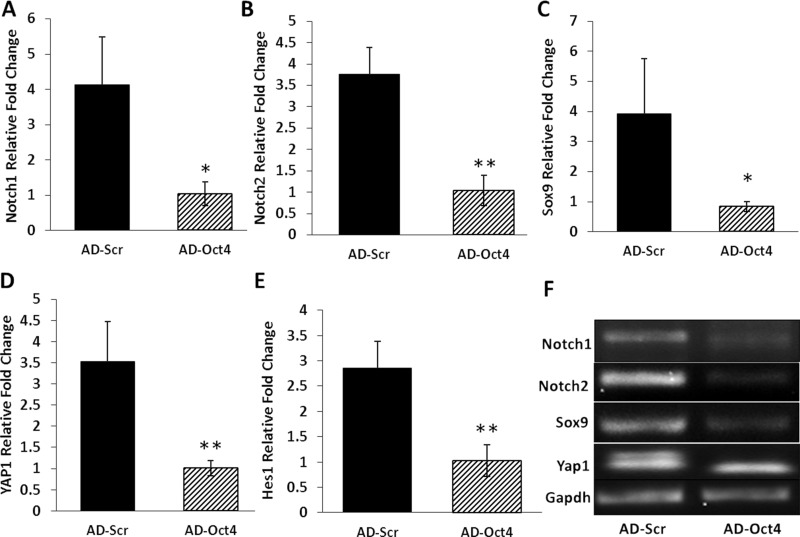
Previous studies have associated Notch signaling with generation of biliary phenotype. For this reason, we assessed the levels of Notch1 and Notch2 in our model. Both of these were significantly downregulated in the AD-Oct4 group compared to AD-Scr controls (Fig. 8A, B, and F). Sox9 (precursor for biliary phenotype) was significantly downregulated in the Oct4-inhibited group compared to control (Fig. 8C and F). Yap1 signaling was also downregulated in the Oct4-inhibited group (Fig. 8D and F). Hes1, previously shown to be required for the conversion of hepatocyte to biliary phenotype, was also downregulated by Oct4 inhibition (Fig. 8E and F).
Figure 8.
Expression of genes associated with HBT following Oct4 inhibition. mRNA levels of (A) Notch1, (B) Notch2, (C) Sox9, (D) YAP1, and (E) Hes1 as assessed by qRT-PCR and expressed as fold change relative to GAPDH on day 21. (F) Representative blots of PCR product following Oct4 inhibition. Significantly different from AD-Scr control: *p ≤ 0.05, **p ≤ 0.01.
DISCUSSION
Our results indicate that Oct4 plays an important role in HBT. In our study, Oct4 expression is induced starting at day 6 in this HBT model. This is also the time point when some cells start expressing the biliary marker HNF-1β in this model14 (Fig. 2, D6). This induction is seen in many hepatocytes in anticipation of transdifferentiation. However, only the surface cells that actually undergo HBT retain Oct4 staining until the end, whereas cells in the intermediate layer that remain as hepatocytes start losing Oct4 induction (Fig. 3). Time course studies in organoid cultures show that induction of Oct4 is accompanied by induction of the biphenotypic marker Afp at day 10 (Fig. 4C). This is suggestive of the phenotypic transformation in hepatocytes during HBT and the presence of an intermediate state. Pathways previously shown to be involved in HBT such as Yap1, Sox9, and Hes1 are upregulated in this study, indicating their involvement in the HBT process and endorsing previous studies reporting their role in HBT. Following Oct4 inhibition, these genes were significantly downregulated, suggesting that they are downstream of Oct4 induction in hepatocytes. This resulted in a decreased number of biliary cells (Figs. 6 and 7E) at the end of the study as assessed by the biliary-specific markers HNF-1β and CK19 (Fig. 5E and G). In our study, the first wave of Oct4 induction is seen around day 6, followed by a much stronger expression again at day 15 (Fig. 3B and C). This could be attributed to previous studies showing that too little or too much Oct4 expression leads to differentiation of cells33. It is possible that the second wave of Oct4 induction at day 15 in our study could drive differentiation and maturation of new biliary cells derived from hepatocytes. The expression of bile acid receptor Fxr in this model is interesting. Fxr receptor expression was significantly induced at day 10 in organoid culture (Fig. 4D). This could be in response to high extracellular bile acid levels in the media generated by hepatocytes. Since increase in Fxr provides negative feedback for bile synthesis, this finding is not surprising in this study utilizing an organoid culture model, which lacks biliary cells at the beginning. Moreover, on day 15 onward, following HBT and appearance of biliary cells, Fxr levels came back to normal, which further corroborates the role of Fxr signaling in intracellular bile production especially in the presence/absence of biliary cells. Based on our data, it appears that Oct4 is a driver for plasticity between hepatocytes and biliary cells in the in vitro organoid culture model of HBT. From the morphology of the cells shown in Figure 6D–F, it appears that early steps toward full biliary transdifferentiation are taken in this process, but the expression of Oct4 is required for other signaling pathways (Sox9, Notch, etc.) to be activated for the fully mature HNF-1β- and CK19-expressing biliary cells to emerge. This is further confirmed by HNF-4α+ cells in the surface layer of Oct4-inhibited cultures (Fig. 7C and D) compared to controls (Fig. 7A and B). These cells, although smaller and cuboidal and similar in shape to controls, are negative for HNF-1β staining. Moreover, CK19, a marker for mature biliary cells, is also significantly downregulated in these cells (Fig. 5G). Further studies are required to elucidate the extracellular signals that drive hepatocytes to undergo phenotypic transformation into biliary cells by upregulating Oct4. Whether increased extracellular bile levels can initiate this signaling in hepatocytes is an interesting avenue for future direction.
ACKNOWLEDGMENTS
This work was supported by a University of Pittsburgh Pathology Postdoctoral Research Training Grant, an American Association of Colleges of Pharmacy New Investigator Award, and a Center for Chronic Disorders of Aging grant, awarded to Vishakha Bhave.
REFERENCES
- 1. Michalopoulos GK. The liver is a peculiar organ when it comes to stem cells. Am J Pathol. 2014;184(5):1263–7. [DOI] [PMC free article] [PubMed] [Google Scholar]
- 2. Michalopoulos GK, Barua L, Bowen WC. Transdifferentiation of rat hepatocytes into biliary cells after bile duct ligation and toxic biliary injury. Hepatology 2005;41(3):535–44. [DOI] [PMC free article] [PubMed] [Google Scholar]
- 3. Sekiya S, Suzuki A. Hepatocytes, rather than cholangiocytes, can be the major source of primitive ductules in the chronically injured mouse liver. Am J Pathol. 2014;184(5):1468–78. [DOI] [PubMed] [Google Scholar]
- 4. Chen YH, Chen HL, Chien CS, Wu SH, Ho YT, Yu CH, Chang MH. Contribution of mature hepatocytes to biliary regeneration in rats with acute and chronic biliary injury. PLoS One 2015;10(8):e0134327. [DOI] [PMC free article] [PubMed] [Google Scholar]
- 5. Park IH, Zhao R, West JA, Yabuuchi A, Huo H, Ince TA, Lerou PH, Lensch MW, Daley GQ. Reprogramming of human somatic cells to pluripotency with defined factors. Nature 2008;451(7175):141–6. [DOI] [PubMed] [Google Scholar]
- 6. Sullivan GJ, Hay DC, Park IH, Fletcher J, Hannoun Z, Payne CM, Dalgetty D, Black JR, Ross JA, Samuel K, Wang G, Daley GQ, Lee JH, Church GM, Forbes SJ, Iredale JP, Wilmut I. Generation of functional human hepatic endoderm from human induced pluripotent stem cells. Hepatology 2010;51(1):329–35. [DOI] [PMC free article] [PubMed] [Google Scholar]
- 7. Takahashi K, Tanabe K, Ohnuki M, Narita M, Ichisaka T, Tomoda K, Yamanaka S. Induction of pluripotent stem cells from adult human fibroblasts by defined factors. Cell 2007;131(5):861–72. [DOI] [PubMed] [Google Scholar]
- 8. Bhave VS, Paranjpe S, Bowen WC, Donthamsetty S, Bell AW, Khillan JS, Michalopoulos GK. Genes inducing iPS phenotype play a role in hepatocyte survival and proliferation in vitro and liver regeneration in vivo. Hepatology 2011;54(4):1360–70. [DOI] [PMC free article] [PubMed] [Google Scholar]
- 9. Nichols J, Zevnik B, Anastassiadis K, Niwa H, Klewe-Nebenius D, Chambers I, Scholer H, Smith A. Formation of pluripotent stem cells in the mammalian embryo depends on the POU transcription factor Oct4. Cell 1998;95(3):379–91. [DOI] [PubMed] [Google Scholar]
- 10. Zeineddine D, Hammoud AA, Mortada M, Boeuf H. The Oct4 protein: More than a magic stemness marker. Am J Stem Cells 2014;3(2):74–82. [PMC free article] [PubMed] [Google Scholar]
- 11. Ben-Porath I, Thomson MW, Carey VJ, Ge R, Bell GW, Regev A, Weinberg RA. An embryonic stem cell-like gene expression signature in poorly differentiated aggressive human tumors. Nat Genet. 2008;40(5):499–507. [DOI] [PMC free article] [PubMed] [Google Scholar]
- 12. Hu T, Liu S, Breiter DR, Wang F, Tang Y, Sun S. Octamer 4 small interfering RNA results in cancer stem cell-like cell apoptosis. Cancer Res. 2008;68(16):6533–40. [DOI] [PubMed] [Google Scholar]
- 13. Block GD, Locker J, Bowen WC, Petersen BE, Katyal S, Strom SC, Riley T, Howard TA, Michalopoulos GK. Population expansion, clonal growth, and specific differentiation patterns in primary cultures of hepatocytes induced by HGF/SF, EGF and TGF alpha in a chemically defined (HGM) medium. J Cell Biol. 1996;132(6):1133–49. [DOI] [PMC free article] [PubMed] [Google Scholar]
- 14. Michalopoulos GK, Bowen WC, Mule K, Lopez-Talavera JC, Mars W. Hepatocytes undergo phenotypic transformation to biliary epithelium in organoid cultures. Hepatology 2002;36(2):278–83. [DOI] [PMC free article] [PubMed] [Google Scholar]
- 15. Michalopoulos GK, Bowen WC, Mule K, Stolz DB. Histological organization in hepatocyte organoid cultures. Am J Pathol. 2001;159(5):1877–87. [DOI] [PMC free article] [PubMed] [Google Scholar]
- 16. Geisler F, Strazzabosco M. Emerging roles of Notch signaling in liver disease. Hepatology 2015;61(1):382–92. [DOI] [PMC free article] [PubMed] [Google Scholar]
- 17. Kohler C, Bell AW, Bowen WC, Monga SP, Fleig W, Michalopoulos GK. Expression of Notch-1 and its ligand Jagged-1 in rat liver during liver regeneration. Hepatology 2004;39(4):1056–65. [DOI] [PMC free article] [PubMed] [Google Scholar]
- 18. Loomes KM, Russo P, Ryan M, Nelson A, Underkoffler L, Glover C, Fu H, Gridley T, Kaestner KH, Oakey RJ. Bile duct proliferation in liver-specific Jag1 conditional knockout mice: Effects of gene dosage. Hepatology 2007;45(2):323–30. [DOI] [PubMed] [Google Scholar]
- 19. Yanger K, Zong Y, Maggs LR, Shapira SN, Maddipati R, Aiello NM, Thung SN, Wells RG, Greenbaum LE, Stanger BZ. Robust cellular reprogramming occurs spontaneously during liver regeneration. Genes Dev. 2013;27(7):719–24. [DOI] [PMC free article] [PubMed] [Google Scholar]
- 20. Yimlamai D, Christodoulou C, Galli GG, Yanger K, Pepe-Mooney B, Gurung B, Shrestha K, Cahan P, Stanger BZ, Camargo FD. Hippo pathway activity influences liver cell fate. Cell 2014;157(6):1324–38. [DOI] [PMC free article] [PubMed] [Google Scholar]
- 21. Sekiya S, Suzuki A. Intrahepatic cholangiocarcinoma can arise from Notch-mediated conversion of hepatocytes. J Clin Invest. 2012;122(11):3914–8. [DOI] [PMC free article] [PubMed] [Google Scholar]
- 22. Huch M, Dorrell C, Boj SF, van Es JH, Li VS, van de Wetering M, Sato T, Hamer K, Sasaki N, Finegold MJ, Haft A, Vries RG, Grompe M, Clevers H. In vitro expansion of single Lgr5+ liver stem cells induced by Wnt-driven regeneration. Nature 2013;494(7436):247–50. [DOI] [PMC free article] [PubMed] [Google Scholar]
- 23. Li J, Xin J, Zhang L, Wu J, Jiang L, Zhou Q, Li J, Guo J, Cao H, Li L. Human hepatic progenitor cells express hematopoietic cell markers CD45 and CD109. Int J Med Sci. 2014;11(1):65–79. [DOI] [PMC free article] [PubMed] [Google Scholar]
- 24. Carpentier R, Suner RE, van Hul N, Kopp JL, Beaudry JB, Cordi S, Antoniou A, Raynaud P, Lepreux S, Jacquemin P, Leclercq IA, Sander M, Lemaigre FP. Embryonic ductal plate cells give rise to cholangiocytes, periportal hepatocytes, and adult liver progenitor cells. Gastroenterology 2011;141(4):1432–8.e4. [DOI] [PMC free article] [PubMed] [Google Scholar]
- 25. Furuyama K, Kawaguchi Y, Akiyama H, Horiguchi M, Kodama S, Kuhara T, Hosokawa S, Elbahrawy A, Soeda T, Koizumi M, Masui T, Kawaguchi M, Takaori K, Doi R, Nishi E, Kakinoki R, Deng JM, Behringer RR, Nakamura T, Uemoto S. Continuous cell supply from a Sox9-expressing progenitor zone in adult liver, exocrine pancreas and intestine. Nat Genet. 2011;43(1):34–41. [DOI] [PubMed] [Google Scholar]
- 26. Oh SH, Hatch HM, Petersen BE. Hepatic oval ‘stem’ cell in liver regeneration. Semin Cell Dev Biol. 2002;13(6):405–9. [DOI] [PubMed] [Google Scholar]
- 27. Karpen SJ. Exercising the nuclear option to treat cholestasis: CAR and PXR ligands. Hepatology 2005;42(2):266–9. [DOI] [PubMed] [Google Scholar]
- 28. Claudel T, Staels B, Kuipers F. The Farnesoid X receptor: A molecular link between bile acid and lipid and glucose metabolism. Arterioscler Thromb Vasc Biol. 2005;25(10):2020–30. [DOI] [PubMed] [Google Scholar]
- 29. Huang W, Ma K, Zhang J, Qatanani M, Cuvillier J, Liu J, Dong B, Huang X, Moore DD. Nuclear receptor-dependent bile acid signaling is required for normal liver regeneration. Science 2006;312(5771):233–6. [DOI] [PubMed] [Google Scholar]
- 30. Ellis E, Goodwin B, Abrahamsson A, Liddle C, Mode A, Rudling M, Bjorkhem I, Einarsson C. Bile acid synthesis in primary cultures of rat and human hepatocytes. Hepatology 1998;27(2):615–20. [DOI] [PubMed] [Google Scholar]
- 31. Seglen PO. Preparation of isolated rat liver cells. Methods Cell Biol. 1976;13:29–83. [DOI] [PubMed] [Google Scholar]
- 32. Livak KJ, Schmittgen TD. Analysis of relative gene expression data using real-time quantitative PCR and the 2(-Delta Delta C(T)) method. Methods 2001;25(4):402–8. [DOI] [PubMed] [Google Scholar]
- 33. Niwa H, Miyazaki J, Smith AG. Quantitative expression of Oct-3/4 defines differentiation, dedifferentiation or self-renewal of ES cells. Nat Genet. 2000;24(4):372–6. [DOI] [PubMed] [Google Scholar]


