

Key Points
Question
How reliably can dementia be predicted in patients with Parkinson disease (PD) with a screening tool made up of clinical predictors?
Findings
In this 4.4-year prospective study on 4 cohorts totaling 607 patients with PD, 70 had a diagnosis converted to dementia. The risk of developing PD dementia was 14-fold for a cutoff point of 4 or greater compared with a negative screen result, and the high-risk group had a 14.9% annual risk of dementia.
Meaning
With simple measures that are assessable in a single office visit, this risk score rapidly and accurately screens for dementia risk in PD.
Abstract
Importance
Parkinson disease dementia dramatically increases mortality rates, patient expenditures, hospitalization risk, and caregiver burden. Currently, predicting Parkinson disease dementia risk is difficult, particularly in an office-based setting, without extensive biomarker testing.
Objective
To appraise the predictive validity of the Montreal Parkinson Risk of Dementia Scale, an office-based screening tool consisting of 8 items that are simply assessed.
Design, Setting, and Participants
This multicenter study (Montreal, Canada; Tottori, Japan; and Parkinson Progression Markers Initiative sites) used 4 diverse Parkinson disease cohorts with a prospective 4.4-year follow-up. A total of 717 patients with Parkinson disease were recruited between May 2005 and June 2016. Of these, 607 were dementia-free at baseline and followed-up for 1 year or more and so were included. The association of individual baseline scale variables with eventual dementia risk was calculated. Participants were then randomly split into cohorts to investigate weighting and determine the scale’s optimal cutoff point. Receiver operating characteristic curves were calculated and correlations with selected biomarkers were investigated.
Main Outcomes and Measures
Dementia, as defined by Movement Disorder Society level I criteria.
Results
Of the 607 patients (mean [SD] age, 63.4 [10.1]; 376 men [62%]), 70 (11.5%) converted to dementia. All 8 items of the Montreal Parkinson Risk of Dementia Scale independently predicted dementia development at the 5% significance level. The annual conversion rate to dementia in the high-risk group (score, >5) was 14.9% compared with 5.8% in the intermediate group (score, 4-5) and 0.6% in the low-risk group (score, 0-3). The weighting procedure conferred no significant advantage. Overall predictive validity by the area under the receiver operating characteristic curve was 0.877 (95% CI, 0.829-0.924) across all cohorts. A cutoff of 4 or greater yielded a sensitivity of 77.1% (95% CI, 65.6-86.3) and a specificity of 87.2% (95% CI, 84.1-89.9), with a positive predictive value (as of 4.4 years) of 43.90% (95% CI, 37.76-50.24) and a negative predictive value of 96.70% (95% CI, 95.01-97.85). Positive and negative likelihood ratios were 5.94 (95% CI, 4.08-8.65) and 0.26 (95% CI, 0.17-0.40), respectively. Scale results correlated with markers of Alzheimer pathology and neuropsychological test results.
Conclusions and Relevance
Despite its simplicity, the Montreal Parkinson Risk of Dementia Scale demonstrated predictive validity equal or greater to previously described algorithms using biomarker assessments. Future studies using head-to-head comparisons or refinement of weighting would be of interest.
This cohort study presents an office-based screening tool for the risk of dementia in Parkinson disease.
Introduction
Despite being classically considered a movement disorder, Parkinson disease (PD) has many nonmotor complications. Whereas there has been considerable progress in treating motor symptoms, nonmotor features, such as dementia, remain debilitating and relatively unmitigated. Parkinson disease dementia (PDD) reduces functional status, quality of life, and survival, contributing significantly to caregiver burden and disability-adjusted life years lost.1 Six times more prevalent in patients with PD than in the general population,2 dementia is the primary cause for nursing home placement in PD.3 Prospective studies have estimated that dementia prevalence is as high as 52% after 4 years of follow-up and 60% after 12 years, increasing with age and disease severity.4 Identifying individuals at high risk of dementia would facilitate therapeutic decisions and life planning for patients and improve cohort selection for randomized clinical trials.
Numerous types of predictors of PDD have been discovered, including clinical, biological, neuropsychological, electrophysiological, or imaging-based predictors. Examples of well-documented predictors are age,5 rapid eye movement sleep behavior disorder (RBD),6,7,8 prodromal dementia symptoms (eg, hallucinations), GBA mutation status,9 and cerebrospinal fluid (CSF) amyloid β42/tau ratio.10 However, most of this knowledge has yet to shape patient-care. Currently, prediction scores that integrate genetic and neuroimaging data are resource-intensive and so are difficult to apply to typical clinical settings.11 To our knowledge, there is still no inexpensive and noninvasive tool that can predict dementia risk within a single office visit. For this purpose, we developed and tested a clinical scale, the Montreal Parkinson Risk of Dementia Scale (MoPaRDS), designed to be a rapid screening tool to predict the risk of dementia in PD.
Methods
MoPaRDS Scale Criteria
Based on a literature review and a 4.4-year prospective cohort study, we identified 8 simple clinical items (eTable 1 in the Supplement) that could be queried in a routine office setting.7 These constituted the items of the MoPaRDS. There are 8 items, defined as: (1) age older than 70 years; (2) male sex; (3) falls and/or freezing (Movement Disorder Society-Unified Parkinson Disease Rating Scale [MDS-UPDRS] 2.12 scoring > 1 and/or MDS-UPDRS 2.13 scoring > 0); (4) bilateral disease onset according to MDS clinical diagnostic criteria (subjective patient or caregiver report12 of bilateral onset and asymmetry index score of <1.5 [ie, higher MDS-UPDRS laterality scores (questions 3.3-3.8)/ lower Side MDS-UPDRS scores]) or a total difference of less than 3 across all MDS-UPDRS lateralized scores (sum of questions 3.3-3.8 on right vs left side); (5) history suggestive of RBD that could be documented on clinical expert interview or with an RBD screening questionnaire score of more than 513 (in the Tottori cohort and the original Montreal cohort, RBD was also confirmed on polysomnogram according to standard criteria, and in the Montreal cohort, the concordance rate between history and polysomnogram was 94%); (6) orthostatic hypotension, defined as a systolic blood pressure drop of more than 10 mm Hg standing compared with supine after 1 to 3 minutes (1 minute was used in Montreal and Tottori cohorts), (7) mild cognitive impairment, defined according to MDS Task Force PD-mild cognitive impairment (MCI) guidelines14 or a Montreal Cognitive Assessment score of less than 26,15 and (8) visual hallucinations (MDS-UPDRS, 1.2 > 0).
Study Participants
We tested the predictive validity of the MoPaRDS in 4 cohorts: our original cohort,7 2 others with established PD, and 1 with de novo PD (Table 1). The 4 cohorts were: (1) 80 patients from Montreal with established PD, on whom the MoPaRDS criteria were developed7; (2) 52 patients from Montreal who were recruited from randomized clinical trials on insomnia and dance therapy in PD that have been described in further detail elsewhere8; (3) 82 patients from Tottori, Japan who have been described previously8 and for whom all variables were available except orthostatic hypotension in some (22 of 82 [26.8%]) and MCI in all (values for these missing variables were imputed as 0.5); and (4) 393 patients with de novo PD derived from the Parkinson Progression Marker Initiative (PPMI),16 an ongoing multicenter observational clinical study evaluating biomarkers of Parkinson progression through imaging, physiological sampling, as well as clinical assessments. The fourth cohort also had extensive assessment of baseline biological and neuropsychological markers, allowing an additional correlation of MoPaRDS with other biomarkers (see ahead). Details of the PPMI have been described elsewhere16; briefly, patients received a diagnosis of PD fewer than 2 years ago, with Hoehn and Yahr stage I or II at baseline, and untreated with dopaminergic medications. Parkinson Progression Marker Initiative data were downloaded on June 1, 2017. The protocol was approved by each site’s institutional review board and all participants provided written consent to participate.
Table 1. Cohort Descriptive Characteristics.
| Characteristic | Cohort, Mean (SD) | ||
|---|---|---|---|
| Original (n = 80) | Established PD Validation (n = 134) | De Novo PD (n = 393) | |
| Age at diagnosis, y | 66.0 (8.2) | 68.5 (10.1) | 61.3 (9.8) |
| Follow-up, y | 4.4 (2.0) | 4.2 (1.9) | 4.4 (1.0) |
| General clinical features | |||
| Disease duration, mo | 67.3 (48.9) | 70.8 (71.3) | 6.7 (6.7) |
| UPDRS part I | 2.3 (2.0) | 1.6 (2.1)a | 5.6 (4.1) |
| UPDRS part II | 10.7 (5.9) | 13.6 (7.2)a | 6.0 (4.2) |
| UPDRS part III | 23.6 (10.4) | 26.3 (12.6)a | 21.0 (9.0) |
| Hoehn and Yahr stage | 3.0 (0.9) | 2.8 (0.8)b | 1.5 (0.5) |
| MoPaRDS score criteria, No. (%) with data | |||
| Male sex | 51 (64) | 67 (50.0) | 258 (65.6) |
| Age ≥70 y | 29 (36) | 76 (56.0) | 79 (20.1) |
| Mild cognitive impairment | 41 (51) | 62 (46.3)c | 85 (21.6) |
| Bilateral disease onset | 17 (21) | 49 (36.6) | 33 (8.4) |
| REM sleep behavior disorder | 47 (59) | 51 (38.1) | 99 (25.2) |
| Hallucinations | 14 (18) | 31 (23.1) | 10 (2.5) |
| Falls or freezing | 31 (39) | 58 (43.3) | 31 (7.9) |
| Orthostatic BP drop >10 mm Hg | 47 (59) | 78 (58.2) | 99 (25.2) |
| MoPaRDS score | 3.5 (2.1) | 3.5 (1.8) | 1.8 (1.2) |
| Outcomes, No. (%) with data | |||
| Final cognitive status | |||
| Without dementia | 53 (66) | 104 (77.6) | 380 (96.7) |
| With dementia | 27 (34) | 30 (22.4) | 13 (3.3) |
Abbreviations: BP, blood pressure; MoPaRDS, The Montreal Parkinson Risk of Dementia Scale; PD, Parkinson disease; REM, rapid eye movement; UPDRS, Unified Parkinson Disease Rating Scale.
Value only available for Montreal cohort.
Value only available for Tottori cohort.
Missing data from Tottori cohort imputed as 0.5—82 missing for mild cognitive impairment; 22 for orthostatic BP drop.
Outcome Assessment
The primary outcome was dementia status at last office visit. All participants were dementia-free at baseline according to the MDS level I criteria. On prospective follow-up, dementia was also defined by level I MDS criteria, namely global cognitive decline (Mini-Mental State Examination score <26) and impairment in more than 1 cognitive domain, resulting in substantial functional limitations to activities of daily living.17 In the original cohort, level II MDS criteria were applied as well because this definition boasts superior sensitivity while remaining comparably specific.17
Statistical Analysis
All patients were assessed for 8 baseline variables predictive of dementia that were identified in our 2 previous studies.7,8 Subsequently, the MoPaRDS was tallied for all patients.
As a proof of concept, a survival analysis was run between participants scoring in the lowest tier (MoPaRDS, 0-3) and those scoring 4 and higher. Using the low-risk group as a reference, the hazard ratio for high-risk patients was calculated through a Cox regression.
To investigate weighting of the score items, participants were randomly split into a training set and a testing set for the purpose of cross-validation. Binary logistic regression analysis was performed on patients in the training set for each variable (eTable 2 in the Supplement) and the resulting odds ratios were proportionally reduced and rounded to integers, representing respective scale weights.
Both the unweighted and weighted models were compared in the testing set with receiver operating characteristic curves predicting final dementia status. Diagnostic accuracy for each cutoff point in the scales was then evaluated using coordinate points of the training set curve. On a second sensitivity analysis, this procedure was repeated on the testing set while excluding participants from the original cohort from whom the MoPaRDS items originated.
The association between the clinical scales and baseline markers of cognitive decline from multiple modalities was explored through bivariate correlations in the PPMI cohort. These included markers of Alzheimer pathology (CSF tau and Aβ42, obtained from T2 magnetic resonance imaging), and neuropsychological markers of limbic and posterior cortical functions, namely semantic fluency, Hopkins verbal learning test (memory) and Mayo Older Americans Normative Studies age-adjusted Benton judgment of line orientation test (visuoperceptual ability).5,18,19 Analyses were performed with IBM SPSS, version 20.0 (IBM). Statistical significance was set at P = .05.
Results
All 8 variables were significantly associated with increased dementia risk over time (eTable 2 in the Supplement). After a mean (SD) follow-up of 4.4 (1.3) years (range 1-8 years), 70 of 607 patients (11.5%) developed dementia. Of the patients with de novo PD, the mean (SD) total MoPaRDS score was 1.8 (1.2), and 13 (3.3%) converted to dementia after 4.4 (1.0) years of follow-up. For the original cohort, mean (SD) MoPaRDS score was 3.5 (2.1) and 27 of 80 (34%) developed dementia during 4.4 (2.0) years of follow-up. In the other established PD cohorts, the baseline score (SD) was 3.5 (1.8), and 30 of 104 patients (22.4%) converted to dementia after 4.2 (1.9) years of follow-up.
When stratifying all patients’ scores according to risk groups, the low-risk group (MoPaRDS, 0-3) demonstrated an annual risk of dementia of 0.6% during follow-up compared with 5.8% in the intermediate (MoPaRDS, 4-5) group and 14.9% in the high-risk group (MoPaRDS, 6-8) (Table 2). When limiting the cohort to patients without MCI (ie, maximum score = 7), average risk scores were notably lower. However, within each tertile, we noted no clear difference in dementia risk estimates compared with the entire cohort (eTable 3 in the Supplement).
Table 2. Montreal Parkinson Risk of Dementia Scale Risk Stratification.
| Risk Group by MoPaRDS Score | All Cohorts | Original Cohort | Established PD Cohort | De Novo PD Cohort | ||||
|---|---|---|---|---|---|---|---|---|
| With/Without Dementia, No. (%) With Dementia | Annual Risk, % | With/Without Dementia, No. (%) With Dementia | Annual Risk, % | With/Without Dementia, No. (%) With Dementia | Annual Risk, % | With/Without Dementia, No. (%) With Dementia | Annual Risk, % | |
| Low-risk (0-3) | 12/453 (2.6) | 0.6 | 1/39 (2.5) | 0.6 | 2/58 (3.3) | 0.9 | 9/356 (2.5) | 0.6 |
| Intermediate-risk (4-5) | 25/74 (27.1) | 5.8 | 10/12 (45.5) | 10.3 | 11/41 (21.1) | 5.0 | 4/21 (16.0) | 3.6 |
| High-risk (6-8) | 28/15 (65.1) | 14.9 | 16/2 (88.9) | 20.20 | 12/10 (54.5) | 13.0 | ISS | ISS |
Abbreviations: ISS, insufficient sample size; MoPaRDS, The Montreal Parkinson Risk of Dementia Scale; PD, Parkinson disease.
Comparing participants who scored in the high- (6-8) and intermediate-risk group (4-5) on the MoPaRDS with the low-risk group (0-3), the elevated risk groups developed dementia faster, with a hazard ratio of 20.8 (95% CI, 10.4-41.6) and 10.6 (95% CI, 5.1-19.8), respectively (P < .001) (Figure 1).
Figure 1. Progression to Dementia by Risk Group.

The hazard ratios for Montreal Parkinson Risk of Dementia Scale (MoPaRDS) scores of 0 to 3, 4 and 5, and 6 to 8 are 1 (Reference), 10.4 (95% CI, 5.1-19.8), and 20.8 (95% CI, 10.4-41.6), respectively. Log rank test, P < .001.
Predictive validity of the MoPaRDS on the testing set, as measured by the area under the curve (AUC) of receiver operating characteristic curves, was 0.879 (95% CI, 0.816-0.942) (Figure 2). Using the weighted MoPaRDS conferred no significant improvement in diagnostic accuracy, with an AUC of 0.885 (95% CI, 0.826-0.943). The optimal cutoff point for the unweighted scale, dictated by the upper leftmost point of the ROC for the training set, was 4 or greater and 13 or greater for the weighted score.
Figure 2. Prediction of Development of Dementia Over Follow-up (4.4 Years).
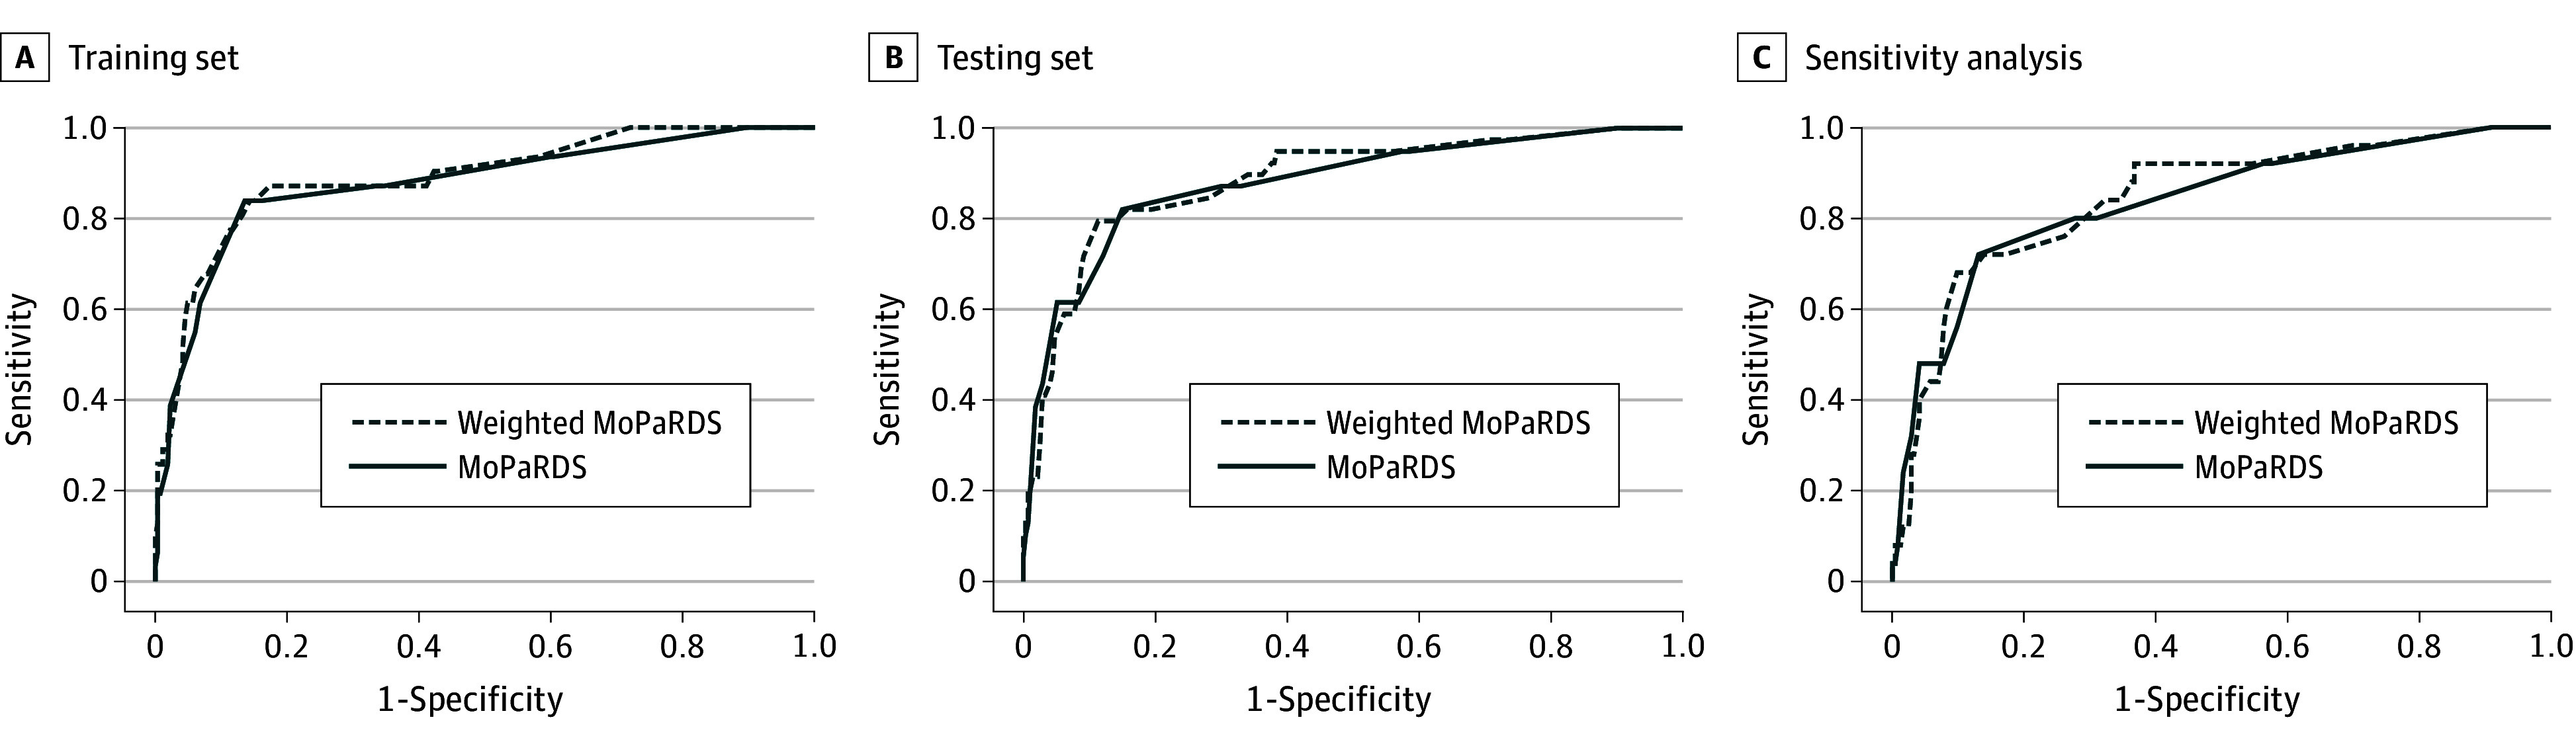
A, The area under the curve (AUC) for weighted Montreal Parkinson Risk of Dementia Scale (MoPaRDS) and MoPaRDS is 0.889 (95% CI, 0.823-0.955) and 0.875 (95% CI, 0.801-0.949), respectively. B, The AUC for weighted MoPaRDS and MoPaRDS is 0.885 (95% CI, 0.826-0.943) and 0.879 (95% CI, 0.816-0.942), respectively. C, The AUC for weighted MoPaRDS and MoPaRDS is 0.845 (95% CI, 0.763-0.928) and 0.837 (95% CI, 0.748-0.926), respectively.
Across all cohorts, a positive screen result (≥4) yielded a sensitivity of 77.1% (95% CI, 65.6-86.3) and a specificity of 87.2% (95% CI, 84.0-89.9) (eTable 4 in the Supplement) for developing dementia over the 4-year follow-up. The positive predictive value was 43.9% (95% CI, 37.8-50.2) and the negative predictive value was 96.7% (95% CI, 95.0-97.9), influenced by the low prevalence of the primary outcome. The positive likelihood ratio was 5.94 (95% CI, 4.08-8.65) and the negative likelihood ratio was 0.26 (95% CI, 0.17-0.40). In our sensitivity analysis, when excluding participants from the validation pool who were in the original cohort, an AUC of 0.837 (95% CI, 0.748-0.926) was generated, and the AUC from the combined Montreal follow-up/PPMI/Tottori cohorts was 0.832 (95% CI, 0.761-0.903). As sex is a strong risk factor for dementia in our cohort, we divided results according to sex (maximum score = 7). Overall, performance of the scale was somewhat better in men (men: AUC, 0.916; 95% CI, 0.873-0.960; women: AUC, 0.805; 95% CI, 0.707-0.903) (eTable 5 in the Supplement).
Among de novo PPMI cohort participants, the MoPaRDS was significantly correlated with baseline values for age, Aβ42/Tau, and Tau protein (Table 3). Of the neuropsychological predictors of cognitive decline, baseline Mayo Older Americans Normative Studies–judgment of line orientation and semantic fluency were correlated with both unweighted and weighted MoPaRDS, while only the unweighted MoPaRDS correlated with verbal learning.
Table 3. Montreal Parkinson Risk of Dementia Scale Correlations With Biomarkers and Neuropsychological Predictors of Dementia in the De Novo Cohorta.
| Characteristic | Age at Baseline, y | Aβ42 | Tau | Aβ42/Tau | Semantic Fluency | Verbal Learning, Total HVLT | Benton JLO, MOANS |
|---|---|---|---|---|---|---|---|
| MoPaRDS | 0.343 | −0.112 | 0.148 | −0.208 | −0.195 | −0.124 | −0.116 |
| P value | <.001 | .023 | .003 | <.0001 | <.001 | .014 | .021 |
| Weighted MoPaRDS | 0.364 | −0.081 | 0.204 | −0.231 | −0.202 | −0.088 | −0.215 |
| P value | <.001 | .104 | <.001 | <.001 | <.001 | .083 | <.001 |
Abbreviations: HLVT, Hopkins verbal learning test; JLO, judgment of line orientation; MOANS, Mayo Older Americans Normative Studies; MoPaRDS, The Montreal Parkinson Risk of Dementia Scale; NA, not applicable.
Values reported as r coefficient (P value, obtained through linear regression).
Discussion
In this study, we presented and validated an office-based screening tool for the risk of dementia in PD. All items independently predicted dementia development at the 5% significance level. Although different variables predicted dementia with varying strengths, weighting did not significantly improve the overall performance of the scale. Therefore, the unweighted scale can be used. At a cutoff of 4 or greater, the scale demonstrated 77.1% sensitivity and 87.2% specificity for dementia risk at 4 years. At this cutoff, a positive test result possesses a likelihood ratio of 5.94. A score of 3 or lower could be also used to “rule out” 4-year dementia risk (ie, negative predictive value = 97.6%), although a positive test result would have low specificity. Therefore, office screening for dementia risk in PD is possible.
As an office-based test, the MoPaRDS compares well with other dementia predictors that use more complex or invasive testing techniques. We found no algorithm predicting cognitive impairment that reported an AUC higher than the 0.88 observed in our study.11 Schrag et al10 studied the PPMI cohort, and found that a combination of lumbar puncture (CSF Aβ42), DaTscan imaging (General Electric Healthcare), and clinical markers could predict a decline in cognition (defined as a 2-point worsening on Montreal Cognitive Assessment, MCI, or dementia) with an AUC of 0.80. A study by Caspeli-Garcia et al20 also found that CSF Aβ42 and DaTscan could predict cognitive impairment, but AUC was not provided. A clinical-genetic risk score that included an analysis of GBA mutation status predicted dementia with an AUC of 0.88 at 10 years.21 In this study, sensitivity for dementia prediction at 10 years was 86%, with a specificity of 72%, a diagnostic performance comparable with the MoPaRDS cutoff of 3 or greater (sensitivity, 87.1%; specificity, 68.2%) and slightly lower than the MoPaRDS cutoff of 4 or greater (sensitivity, 77.1%; specificity, 87.2%).21
The main advantage of the MoPaRDS is its practicality for clinical use. Featuring demographic data as well as motor and nonmotor signs, the items of the scale are already often screened for in a routine office visit of a patient with PD, with no need for biological samples, neuroimaging, or genetic testing. Therefore, compiling results is rapid for the clinician during a single outpatient office visit, and the results are available without delay or requirement for statistical software. In addition to allowing prompt clinical counselling and life planning, this can have practical treatment implications. For example, drugs that can worsen cognition or induce delirium might be more assiduously avoided in those scoring in the high-risk range. Moreover, the decision about whether to use PD drugs that are more prone to causing hallucinations (eg, dopamine agonists, amantadine) will be made easier by understanding risk of developing dementia over the subsequent 4 to 5 years.
Most studies estimate that the mean time from onset of PD to dementia is 10 years,22 and that up to 80% of patients with PD develop dementia during the disease course.20 Therefore, predicting imminent risk may be more informative. Accordingly, the MoPaRDS was assessed for a mean (SD) of 4.4 (1.4) years and can also be used to predict annual dementia conversion rates during this time. In clinical practice, it may be most useful to divide the scale into 3 groups; low risk indicates that the development of short-term dementia is extremely unlikely (0.6% per year), high risk indicates a need for intensive surveillance (14.9% risk per year), and intermediate scores (5.8% risk per year) indicate a need for moderate surveillance and caution in using medications that are prone to cause sedation or hallucinations. Moreover, the MoPaRDS can be measured serially through time. Although some items do not change (sex) or are seen commonly in early disease (RBD, orthostatic hypotension) others, such as MCI or hallucination, more often occur late.23 Therefore, scores should generally rise as dementia becomes imminent (note that we cannot assess this hypothesis directly using the methods of this study). The MoPaRDS may also be useful for randomized clinical trials, both for trials with dementia as an outcome and as a means to stratify patients in nondementia trials. For example, if one were to use a MoPaRDS of 4 or greater in a 3-year parallel-design clinical trial against PDD, an agent that reduces dementia risk by 50% would require a sample size of 69 patients (assuming 80% power with P = .05) to demonstrate a significant benefit (binominal probability, 2 proportions; https://www.stat.ubc.ca/~rollin/stats/ssize/b2.html). By contrast, without using stratification, the same clinical trial would require 568 patients, an 8-fold increase.
On the PPMI subset of the study, we found that the MoPaRDS was correlated with several biological and neuropsychological predictors of impending late-stage cognitive decline. Amyloid markers are of particular interest as dementia predictors, as Alzheimer disease pathology in patients with PD has been shown to be associated with shorter time until dementia onset.11,24,25 In the Deprenyl and Tocopherol Antioxidative Therapy Of Parkinsonism study, late-stage cognitive decline was associated with Tau/Aβ42 ratio values.10 Low CSF Aβ42 predicted dementia at 18 months.26 Furthermore, neuropsychological markers of limbic or posterior cortical impairment—semantic fluency, verbal learning, and visuoperceptual deficits—also predicted dementia at 18 months in another recent study.19 These correlations with the MoPaRDS are unsurprising because individual MoPaRDS items, such as advanced age, RBD, autonomic dysfunction, visual hallucinations, and the severity of nontremor motor symptoms, have separately been linked to cognitive decline.27,28
Limitations
Some limitations of this study should be noted. First, the manner of assessing MoPaRDS criteria was not exactly the same in every cohort. For example, whereas the MoPaRDS requires only clinical history of RBD, polysomnography data were available in 2 cohorts. The predictive value of polysomnogram-diagnosed RBD would be higher, perhaps increasing diagnostic performance. Also, MCI status in the Tottori cohort was only tested with the Mini-Mental State Examination at baseline, which is unreliable; therefore these values were considered missing, and 0.5 was attributed. Second, education has been variably associated with dementia risk5,21,23; however, we did not have precise estimates of education level in 3 of 4 cohorts, so were not able to include it as a possible outcome. However, the predictive value of education is modest and not observed in all studies, so it is uncertain to what degree including education might have improved predictive value.29,30,31,32 Third, MDS level I criteria (ie, office-based diagnosis without neuropsychological testing) was used to diagnose dementia in 3 of 4 cohorts. While valid (and clinically applicable), this is less sensitive than a MDS level II diagnosis; using level II diagnostic criteria would have found higher conversion rates and therefore might have increased sensitivity. Last, in accordance with the disease course, the de novo PD cohort featured few high-risk patients (MoPaRDS, 6-8: 3 of 393 [0.8%]) at baseline visit. Consequently, this cohort contributed less to the assessment of high risk among the 4 longitudinal cohorts, mostly informing low- and intermediate-risk categories. Future studies could evaluate the MoPaRDS in larger cohorts over a longer period to further appraise performance and weighting and evaluate which items are most predictive of rapid cognitive decline.
Conclusions
The primary strengths of our study design are a relatively large sample size selected from diverse populations, increasing robustness and generalizability. Also, participants were monitored prospectively, reducing information bias. Our primary analysis used a “hard” outcome of dementia (rather than surrogate outcomes, such as decline in quantitative testing), an outcome that is well-defined and of obvious immediate clinical importance. Finally, the MoPaRDS itself is a short and easily administered office tool that despite its simplicity can nonetheless accurately screen for dementia risk in PD.
eTable 1. MoPaRDS and Weighted MoPaRDS items and Scoring
eTable 2. Predictive Variables Assessed Across All Cohorts
eTable 3. Risk Stratification in MCI vs. Non-MCI Patients
eTable 4. Diagnostic Evaluation of MoPaRDS and Weighting With Cross-Validation, By Cutoff
eTable 5. Diagnostic Evaluation of MoPaRDS, By Sex
References
- 1.Auyeung M, Tsoi TH, Mok V, et al. Ten year survival and outcomes in a prospective cohort of new onset Chinese Parkinson’s disease patients. J Neurol Neurosurg Psychiatry. 2012;83(6):607-611. [DOI] [PubMed] [Google Scholar]
- 2.Aarsland D, Andersen K, Larsen JP, Lolk A, Nielsen H, Kragh-Sørensen P. Risk of dementia in Parkinson’s disease: a community-based, prospective study. Neurology. 2001;56(6):730-736. [DOI] [PubMed] [Google Scholar]
- 3.Hely MA, Morris JGL, Traficante R, Reid WGJ, O’Sullivan DJ, Williamson PM. The Sydney multicentre study of Parkinson’s disease: progression and mortality at 10 years. J Neurol Neurosurg Psychiatry. 1999;67(3):300-307. [DOI] [PMC free article] [PubMed] [Google Scholar]
- 4.Buter TC, van den Hout A, Matthews FE, Larsen JP, Brayne C, Aarsland D. Dementia and survival in Parkinson disease: a 12-year population study. Neurology. 2008;70(13):1017-1022. [DOI] [PubMed] [Google Scholar]
- 5.Vasconcellos LF, Pereira JS. Parkinson’s disease dementia: diagnostic criteria and risk factor review. J Clin Exp Neuropsychol. 2015;37(9):988-993. [DOI] [PubMed] [Google Scholar]
- 6.Lyashenko E, Poluektov M, Levin O. REM sleep behavior disorder is a predictor of dementia in Parkinson’s disease. Sleep Med. 2015;16:S349. doi: 10.1016/j.sleep.2015.02.456 [DOI] [Google Scholar]
- 7.Anang JB, Gagnon JF, Bertrand JA, et al. Predictors of dementia in Parkinson disease: a prospective cohort study. Neurology. 2014;83(14):1253-1260. [DOI] [PMC free article] [PubMed] [Google Scholar]
- 8.Anang JB, Nomura T, Romenets SR, Nakashima K, Gagnon JF, Postuma RB. Dementia predictors in Parkinson disease: a validation study. J Parkinsons Dis. 2017;7(1):159-162. [DOI] [PubMed] [Google Scholar]
- 9.Liu G, Boot B, Locascio JJ, et al. ; International Genetics of Parkinson Disease Progression (IGPP) Consortium . Specifically neuropathic Gaucher’s mutations accelerate cognitive decline in Parkinson’s. Ann Neurol. 2016;80(5):674-685. [DOI] [PMC free article] [PubMed] [Google Scholar]
- 10.Schrag A, Siddiqui UF, Anastasiou Z, Weintraub D, Schott JM. Clinical variables and biomarkers in prediction of cognitive impairment in patients with newly diagnosed Parkinson’s disease: a cohort study. Lancet Neurol. 2017;16(1):66-75. [DOI] [PMC free article] [PubMed] [Google Scholar]
- 11.Kalia LV. Biomarkers for cognitive dysfunction in Parkinson’s disease. Parkinsonism Relat Disord. 2018;46(suppl 1):S19-S23. [DOI] [PubMed] [Google Scholar]
- 12.Postuma RB, Berg D, Stern M, et al. MDS clinical diagnostic criteria for Parkinson’s disease. Mov Disord. 2015;30(12):1591-1601. [DOI] [PubMed] [Google Scholar]
- 13.Li K, Li SH, Su W, Chen HB. Diagnostic accuracy of REM sleep behaviour disorder screening questionnaire: a meta-analysis. Neurol Sci. 2017;38(6):1039-1046. [DOI] [PubMed] [Google Scholar]
- 14.Litvan I, Goldman JG, Tröster AI, et al. Diagnostic criteria for mild cognitive impairment in Parkinson’s disease: Movement Disorder Society Task Force guidelines. Mov Disord. 2012;27(3):349-356. [DOI] [PMC free article] [PubMed] [Google Scholar]
- 15.Dalrymple-Alford JC, MacAskill MR, Nakas CT, et al. The MoCA: well-suited screen for cognitive impairment in Parkinson disease. Neurology. 2010;75(19):1717-1725. [DOI] [PubMed] [Google Scholar]
- 16.Parkinson Progression Marker I; Parkinson Progression Marker Initiative . The Parkinson Progression Marker Initiative (PPMI). Prog Neurobiol. 2011;95(4):629-635. [DOI] [PMC free article] [PubMed] [Google Scholar]
- 17.Dubois B, Burn D, Goetz C, et al. Diagnostic procedures for Parkinson’s disease dementia: recommendations from the movement disorder society task force. Mov Disord. 2007;22(16):2314-2324. [DOI] [PubMed] [Google Scholar]
- 18.Fereshtehnejad SM, Zeighami Y, Dagher A, Postuma RB. Clinical criteria for subtyping Parkinson’s disease: biomarkers and longitudinal progression. Brain. 2017;140(7):1959-1976. [DOI] [PubMed] [Google Scholar]
- 19.Compta Y, Pereira JB, Ríos J, et al. Combined dementia-risk biomarkers in Parkinson’s disease: a prospective longitudinal study. Parkinsonism Relat Disord. 2013;19(8):717-724. [DOI] [PubMed] [Google Scholar]
- 20.Caspell-Garcia C, Simuni T, Tosun-Turgut D, et al. ; Parkinson’s Progression Markers Initiative (PPMI) . Multiple modality biomarker prediction of cognitive impairment in prospectively followed de novo Parkinson disease. PLoS One. 2017;12(5):e0175674. [DOI] [PMC free article] [PubMed] [Google Scholar]
- 21.Liu G, Locascio JJ, Corvol J-C, et al. ; HBS; CamPaIGN; PICNICS; PROPARK; PSG; DIGPD; PDBP . Prediction of cognition in Parkinson’s disease with a clinical-genetic score: a longitudinal analysis of nine cohorts. Lancet Neurol. 2017;16(8):620-629. [DOI] [PMC free article] [PubMed] [Google Scholar]
- 22.Aarsland D, Kurz MW. The epidemiology of dementia associated with Parkinson disease. J Neurol Sci. 2010;289(1-2):18-22. [DOI] [PubMed] [Google Scholar]
- 23.Zhu K, van Hilten JJ, Marinus J. Predictors of dementia in Parkinson’s disease; findings from a 5-year prospective study using the SCOPA-COG. Parkinsonism Relat Disord. 2014;20(9):980-985. [DOI] [PubMed] [Google Scholar]
- 24.Irwin DJ, Grossman M, Weintraub D, et al. Neuropathological and genetic correlates of survival and dementia onset in synucleinopathies: a retrospective analysis. Lancet Neurol. 2017;16(1):55-65. [DOI] [PMC free article] [PubMed] [Google Scholar]
- 25.Berlyand Y, Weintraub D, Xie SX, et al. An Alzheimer’s disease-derived biomarker signature identifies Parkinson’s disease patients with dementia. PLoS One. 2016;11(1):e0147319. [DOI] [PMC free article] [PubMed] [Google Scholar]
- 26.Compta Y, Buongiorno M, Bargalló N, et al. White matter hyperintensities, cerebrospinal amyloid-β and dementia in Parkinson’s disease. J Neurol Sci. 2016;367:284-290. [DOI] [PubMed] [Google Scholar]
- 27.Barone P, Aarsland D, Burn D, Emre M, Kulisevsky J, Weintraub D. Cognitive impairment in nondemented Parkinson’s disease. Mov Disord. 2011;26(14):2483-2495. [DOI] [PubMed] [Google Scholar]
- 28.Fereshtehnejad SM, Romenets SR, Anang JB, Latreille V, Gagnon JF, Postuma RB. New clinical subtypes of Parkinson disease and their longitudinal progression: a prospective cohort comparison with other phenotypes. JAMA Neurol. 2015;72(8):863-873. [DOI] [PubMed] [Google Scholar]
- 29.Caviness JN, Driver-Dunckley E, Connor DJ, et al. Defining mild cognitive impairment in Parkinson’s disease. Mov Disord. 2007;22(9):1272-1277. [DOI] [PubMed] [Google Scholar]
- 30.Aarsland D, Andersen K, Larsen JP, Lolk A, Kragh-Sørensen P. Prevalence and characteristics of dementia in Parkinson disease: an 8-year prospective study. Arch Neurol. 2003;60(3):387-392. [DOI] [PubMed] [Google Scholar]
- 31.Janvin CC, Aarsland D, Larsen JP. Cognitive predictors of dementia in Parkinson’s disease: a community-based, 4-year longitudinal study. J Geriatr Psychiatry Neurol. 2005;18(3):149-154. [DOI] [PubMed] [Google Scholar]
- 32.Domellöf ME, Ekman U, Forsgren L, Elgh E. Cognitive function in the early phase of Parkinson’s disease, a five-year follow-up. Acta Neurol Scand. 2015;132(2):79-88. [DOI] [PubMed] [Google Scholar]
Associated Data
This section collects any data citations, data availability statements, or supplementary materials included in this article.
Supplementary Materials
eTable 1. MoPaRDS and Weighted MoPaRDS items and Scoring
eTable 2. Predictive Variables Assessed Across All Cohorts
eTable 3. Risk Stratification in MCI vs. Non-MCI Patients
eTable 4. Diagnostic Evaluation of MoPaRDS and Weighting With Cross-Validation, By Cutoff
eTable 5. Diagnostic Evaluation of MoPaRDS, By Sex