This cohort study assesses whether baseline and early therapy circulating tumor DNA measurements differentiate pseudoprogression from true progression in patients with metastatic melanoma treated with anti–programmed cell death 1 antibodies.
Key Points
Question
What is the predictive value of circulating tumor DNA in differentiating pseudoprogression from true progression in patients with metastatic melanoma treated with anti–programmed cell death 1 antibodies?
Findings
In this cohort study of 125 patients with metastatic melanoma who were treated with anti–programmed cell death 1 antibodies, the number of circulating tumor DNA copies was reduced by greater than 10-fold within 12 weeks of treatment and accurately identified patients with pseudoprogression. These profile patterns of circulating tumor DNA were significantly associated with overall survival.
Meaning
Reduction in the number of circulating tumor DNA copies within 12 weeks of anti–programmed cell death 1 inhibitor treatment represents a liquid molecular biomarker profile for prognosis.
Abstract
Importance
Longitudinal circulating tumor DNA (ctDNA) has been shown to predict response and survival in patients with metastatic melanoma treated with anti–programmed cell death 1 (PD-1) antibodies. Pseudoprogression, defined as radiologic finding of disease progression prior to response, has been a challenge to clinicians.
Objective
To establish whether ctDNA at baseline and up to week 12 of treatment can differentiate between the radiologic findings of pseudoprogression and true progression in patients with metastatic melanoma.
Design, Setting, and Participants
This explorative biomarker study examined circulating BRAF and NRAS mutations in a cohort of 125 patients with melanoma receiving PD-1 antibodies alone or in combination with ipilimumab between July 3, 2014, and May 24, 2016. Pseudoprogression was defined retrospectively as radiologic progression not confirmed as progressive disease at the next radiologic assessment. Plasma samples of ctDNA at baseline and while receiving treatment were taken for analysis prospectively over the first 12 weeks of treatment. Favorable ctDNA profile (undetectable ctDNA at baseline or detectable ctDNA at baseline followed by >10-fold decrease) and unfavorable ctDNA profile (detectable ctDNA at baseline that remained stable or increased) were correlated with response and prognosis.
Main Outcomes and Measures
Early differentiation of pseudoprogression from true progression using longitudinal ctDNA profile.
Results
According to guidelines by Response Evaluation Criteria in Solid Tumors (RECIST), progressive disease occurred in 29 of the 125 patients (23.2%). Of the 29 patients, 17 (59%) were 65 years or younger, 18 (62%) were men, 9 (31%) had pseudoprogression, and 20 (69%) had true progression. Of the 9 patients (7%) with confirmed pseudoprogression, all patients had a favorable ctDNA profile. At a median follow-up of 110 weeks, 7 of 9 patients (78%) were alive. All but 2 patients with true progression had an unfavorable ctDNA profile. Sensitivity of ctDNA for predicting pseudoprogression was 90% (95% CI, 68%-99%) and specificity was 100% (95% CI, 60%-100%). The 1-year survival for patients with RECIST-defined progressive disease and favorable ctDNA was 82% vs 39% for unfavorable ctDNA (hazard ratio [HR], 4.8; 95% CI, 1.6-14.3; P = .02). Overall survival was longer in patients with a partial response (54 of 125 patients [43%]) compared with patients with progressive disease and a favorable ctDNA profile (11 of 125 patients [9%]; HR, 0.09; 95% CI, 0.01-0.80; P < .01).
Conclusions and Relevance
The results demonstrate that ctDNA profiles can accurately differentiate pseudoprogression from true progression of disease in patients with melanoma treated with PD-1 antibodies. Results of this blood test performed at regular intervals during systemic treatment reflect tumor biology and have potential as a powerful biomarker to predict long-term response and survival.
Introduction
Anti–programmed cell death 1 (PD-1) antibody alone or in combination with ipilimumab is a standard of care in the treatment of metastatic melanoma.1,2,3 A previous study4 demonstrated that an undetectable circulating tumor DNA (ctDNA) at baseline or within 8 weeks of therapy was an independent predictor of response and survival in PD-1 antibody–treated patients with melanoma.
Pseudoprogression, a response that occurs after the initial development of new lesions or an increase in the size of target lesions, occurs in up to 10% of patients treated with PD-1 antibodies.5 Confirmation of pseudoprogression requires subsequent imaging, imposing an ongoing challenge despite the development of newer criteria, such as the immune-related response criteria (irRC).6
In this study, we sought to determine if baseline and early therapy measurements of ctDNA can differentiate pseudoprogression from true progression in patients with melanoma treated with PD-1 antibodies.
Methods
Patients and Treatment
Patients with stage IV melanoma and established BRAF (GenBank NM_004333.5) or NRAS (GenBank NM_002524.4) mutations treated with pembrolizumab or nivolumab alone or in combination with ipilimumab between July 03, 2014, and May 24, 2016, were included. Approval for this study was obtained from the Melanoma Institute Australia review board. Written informed consent was obtained from all patients under approval of the Royal Prince Alfred Hospital Human Research ethics committee. Patient clinicopathologic features were collected as previously described.4
Response Assessment
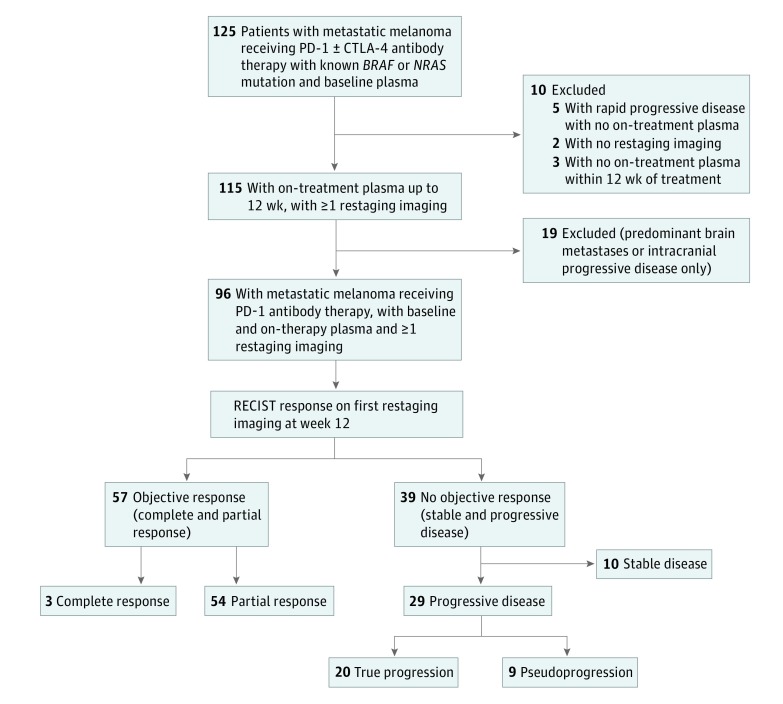
Objective response was assessed retrospectively with computed tomographic scans and/or magnetic resonance imaging of the brain at 12 weekly intervals using the Response Evaluation Criteria in Solid Tumors (RECIST) guideline, version 1.1.7 Patients with progressive disease on the first restaging scan were included. Inclusion and exclusion criteria are outlined in Figure 1 and eMethods 1 and 2 in the Supplement. Survival data were collected on patients with partial response for comparative survival analysis.
Figure 1. Patient Selection Flowchart.
BRAF or NRAS mutations were identified in tumor tissue using commercially available tests (OncoCarta, Oncofocus, V600 AMOY, VE1 IHC). Plasma is defined as plasma-derived circulating tumor DNA (ctDNA) quantification with digital droplet, polymerase chain reaction and is represented as copies per milliliter. Patients with brain metastases were excluded because of previous data suggesting that ctDNA was neither sensitive nor accurate in depicting intracranial activity. Progressive disease is defined as new or growing lesions detectable within 12 weeks of treatment initiation. Confirmation computed tomographic scans were performed for all 9 patients with pseudoprogression to determine durable response. Clinical data collection included age, sex, mutation, treatment type, lactate dehydrogenase, Eastern Cooperative Oncology Group (ECOG) performance status, and American Joint Committee on Cancer (AJCC) tumor stage. CTLA-4 indicates cytotoxic T-lymphocyte protein 4; PD-1, anti-programmed cell death 1; and RECIST, Response Evaluation Criteria in Solid Tumors.
Response was also determined using irRC.6 Pseudoprogression was defined as more than 25% increase in tumor burden at imaging assessment 1 (week 12) and not confirmed as progressive disease per irRC at assessment 2.8
Profile Groups of DNA and LDH
Blood samples were collected prospectively at baseline and at regular intervals during therapy, and ctDNA was processed as previously described (eMethods 3 in the Supplement).4 Patients were classified according to their ctDNA profile. A favorable ctDNA profile was defined as follows: (1) undetectable ctDNA at baseline that remained undetectable or (2) detectable ctDNA at baseline that became undetectable or decreased by at least 10-fold during treatment. An unfavorable ctDNA profile was defined as detectable ctDNA at baseline that remained stable or increased during treatment. Patients were also classified as favorable and unfavorable according to their lactate dehydrogenase (LDH) profile using the model proposed in a previous study (eMethods 4 in the Supplement).9
Statistical Analysis
A Cox proportional hazard model was used to estimate hazard ratios (HRs) conditional to the ctDNA at each landmark time point and included only patients who were alive at that time. The analysis was performed using R, version 4.3.1 (R Development Core Team). Additional statistical methods are described in eMethods 5 in the Supplement.
Results
Patient Characteristics
Of 125 patients, 29 had progressive disease at the first restaging (Figure 1). Of these, 17 (59%) were 65 years or younger and 18 (62%) were men. Median follow-up duration was 84 weeks (range, 13-128 weeks), and 13 of the 29 patients (45%) were alive at the time of analysis. Of the 29 patients, 9 (31%) had pseudoprogression and 20 (69%) had true progression (eTable in the Supplement).
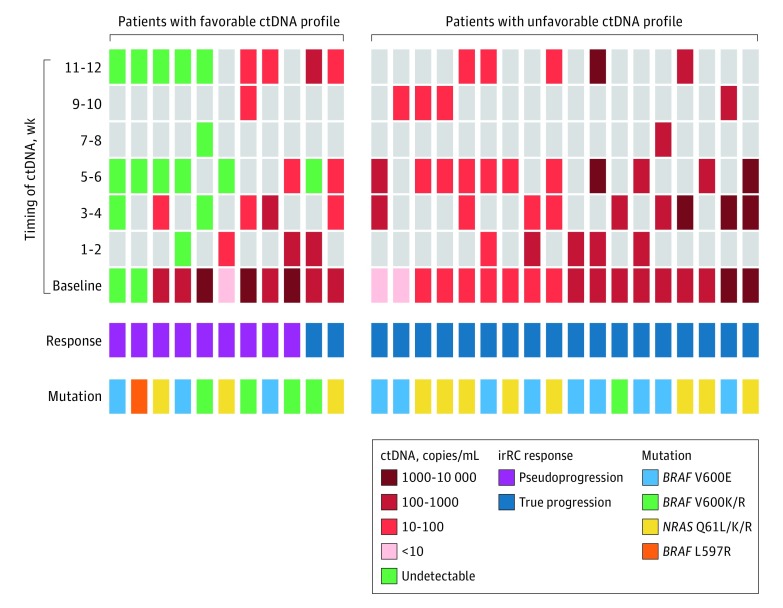
A favorable ctDNA profile was observed in 11 of the 29 patients (38%). Two of these (18%) had an undetectable ctDNA profile at baseline, 5 (45%) had detectable ctDNA at baseline that zeroconverted within 6 weeks, and 4 (36%) had a detectable but 10-fold decrease in their ctDNA by week 12 (Figure 2).
Figure 2. Overview of Mutation Type, Circulating Tumor DNA (ctDNA), and Immune-Related Response Criteria (irRC) Results in 29 Patients.
Columns represent each patient and mutation type, longitudinal quantitative ctDNA results, and irRC results distinguishing between true progression and pseudoprogression. Patients were stratified into favorable (undetectable ctDNA at baseline and during treatment or detectable ctDNA at baseline that became undetectable or decreased ≥10-fold within 12 weeks of treatment) vs unfavorable (detectable ctDNA at baseline that remained stable or increased during treatment) profile groups.
Patients With Disease Pseudoprogression
All 9 patients with pseudoprogression had a favorable ctDNA profile: 2 (22%) with an undetectable ctDNA profile at baseline, 4 (44%) with detectable ctDNA at baseline that zeroconverted, and 3 (33%) with a greater than 10-fold decrease in ctDNA by week 12 (Figure 2). Of these 9 patients, disease in 3 (33%) subsequently progressed at 30, 43, and 78 weeks; 2 patients (22%) died of disease progression at 110 and 128 weeks. Patients whose disease progressed at 30 and 43 weeks had a ctDNA profile that remained detectable despite a 10-fold decrease within 12 weeks. Examples of ctDNA profiles and imaging of patients with pseudoprogression are described in eFigures 1 and 2 in the Supplement.
Patients With True Disease Progression
Of the 20 patients with true disease progression, 18 (90%) had an unfavorable ctDNA profile (Figure 2). At the time of analysis, 6 of 20 patients (30%) were alive; 2 of these (33%) underwent extensive metastectomy of progressing lesions, while the remaining 4 patients (67%) had melanoma with BRAF mutation and received salvage mitogen-activated protein kinase (MAPK) inhibitor therapy. Median survival in patients with true progression was 41 weeks.
Two patients who had true disease progression but a favorable ctDNA profile were further analyzed. Patient 1 had radiologic response in existing lesions with development of a new necrotic lymph node at week 12 (irRC partial response). Analysis depicted elevated baseline ctDNA that zeroconverted at week 6 and became detectable again by week 12 (eFigure 3 in the Supplement). This patient was categorized as having a favorable ctDNA profile because of ctDNA zeroconversion at week 6. The ctDNA increase by week 12 was indicative of true progressive disease and predated radiologic progression at week 27. Patient 2 received combination immunotherapy with disease progression despite a 10-fold decrease from baseline in ctDNA. Treatment was ceased at week 12 and changed to MAPK inhibitor therapy without further radiologic assessment.
Patient Outcome and Survival
The sensitivity of the ctDNA profile in predicting pseudoprogression from true progression was 90% (95% CI, 68%-99%) and the specificity was 100% (95% CI, 66%-100%). The LDH profiles (eFigure 4 in the Supplement) had a lower sensitivity (60%; 95% CI, 36%-81%) and specificity (89%; 95% CI, 52%-100%). The profile of ctDNA had a higher positive (100% vs 92%) and negative (82% vs 50%) predictive value when compared with LDH.
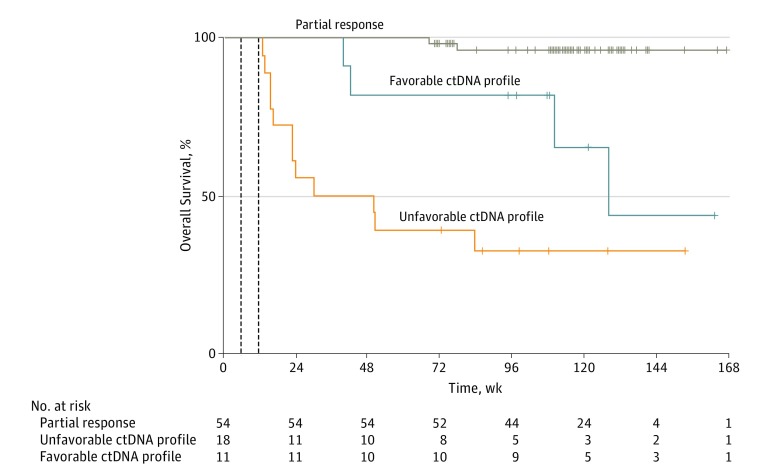
The HR for overall survival of patients with a favorable vs unfavorable ctDNA profile was calculated using landmarked data for 27 patients at week 6 (HR, 3.9; 95% CI, 2.1-14.0; P = .02) and 29 patients at week 12 (HR, 3.3; 95% CI, 1.0-10.5; P = .03). Overall survival was longer in patients with a partial response (54 of 125 patients [43%]) compared with patients with progressive disease (11 of 125 [9%]) with favorable ctDNA profile (HR, 0.09; 95%CI, 0.01-0.80; P < .001). The 1-year survival results were 100% for patients with a partial response, 82% for a favorable ctDNA profile, and 39% for an unfavorable ctDNA profile (Figure 3).
Figure 3. Kaplan-Meier Curves for Overall Survival of Partial Response Patients According to Circulating Tumor DNA (ctDNA) Profile.
A total of 16 deaths occurred in patients with Response Evaluation Criteria in Solid Tumors (RECIST) progressive disease at week 12. All deaths were related to disease progression at a median follow-up of 110 weeks (range: 13-167 weeks). Landmarked data were used to calculate hazard ratio (HR) of overall survival for 27 patients at week 6 and 29 patients at week 12. Results include an unfavorable ctDNA profile at week 6 (HR, 3.9; 95% CI, 2.1-14.0; P = .02) and week 12 (HR, 3.3; 95% CI, 1.0-10.5; P = .03). The 1-year overall survival was 100% for patients with partial response, 81.8% for those with a favorable ctDNA profile, and 38.9% for those with an unfavorable ctDNA profile.
Discussion
Identification of pseudoprogression in patients with melanoma receiving immunotherapy with PD-1 antibodies is a particular challenge. Early recognition of this unique response pattern has important implications for patient management. Recognition of this response pattern prevents premature termination of potentially effective treatment and may influence the selection and administration of optimal sequential therapy in a time-sensitive manner.8 Within 12 weeks of therapy, ctDNA profiles accurately identify pseudoprogression from true progression.
Limitations
Limitations of this study include the retrospective analysis of radiologic responses, the earliest initial restaging scan at 12 weeks for all patients, and the lack of more frequent imaging to match ctDNA time points. The digital droplet, polymerase chain reaction mutation detection technique used to monitor ctDNA is only applicable to the 70% of patients who have an identifiable mutation.4
Conclusions
Circulating tumor DNA has the potential to be an early treatment decision-making tool, and novel clinical trial designs could use ctDNA profiles to identify patients for treatment escalation. The use of ctDNA to identify these unique response measures should be explored for additional diseases beyond melanoma.10,11
eMethods 1. Patient Inclusion and Exclusion Criteria
eMethods 2. Disease Characteristics Assessment
eMethods 3. Plasma Collection and Circulating Tumor DNA (ctDNA) Extraction and Quantification
eMethods 4. Circulating Tumor DNA (ctDNA) and Lactate Dehydrogenase (LDH) Profile Groups
eMethods 5. Statistical Analysis
eTable. Patient and Disease Characteristics at Baseline
eFigure 1. Changes in Circulating Tumor DNA (ctDNA), Lactate Dehydrogenase (LDH) and Disease Volume With Treatment in Patient 1
eFigure 2. Changes in Circulating Tumor DNA (ctDNA), Lactate Dehydrogenase (LDH), and Disease Volume With Treatment in Patient 2
eFigure 3. Changes in Circulating Tumor DNA (ctDNA), Lactate Dehydrogenase (LDH), and Disease Volume With Treatment in Patient 3
eFigure 4. Overview of Serial LDH Results and Response in 29 Patients
References
- 1.Robert C, Schachter J, Long GV, et al. ; KEYNOTE-006 Investigators . Pembrolizumab versus ipilimumab in advanced melanoma. N Engl J Med. 2015;372(26):2521-2532. [DOI] [PubMed] [Google Scholar]
- 2.Weber JS, D’Angelo SP, Minor D, et al. Nivolumab versus chemotherapy in patients with advanced melanoma who progressed after anti-CTLA-4 treatment (CheckMate 037): a randomised, controlled, open-label, phase 3 trial. Lancet Oncol. 2015;16(4):375-384. [DOI] [PubMed] [Google Scholar]
- 3.Larkin J, Chiarion-Sileni V, Gonzalez R, et al. Combined nivolumab and ipilimumab or monotherapy in untreated melanoma. N Engl J Med. 2015;373(1):23-34. [DOI] [PMC free article] [PubMed] [Google Scholar]
- 4.Lee JH, Long GV, Boyd S, et al. Circulating tumour DNA predicts response to anti-PD1 antibodies in metastatic melanoma. Ann Oncol. 2017;28(5):1130-1136. [DOI] [PubMed] [Google Scholar]
- 5.Hodi FS, Sznol M, Kluger HM, et al. Long-term survival of ipilimumab-naive patients (pts) with advanced melanoma (MEL) treated with nivolumab (anti-PD-1, BMS-936558, ONO-4538) in a phase I trial. J Clin Oncol. 2014;32(15)(suppl):9002. doi: 10.1200/jco.2014.32.15_suppl.9002 [DOI] [Google Scholar]
- 6.Wolchok JD, Hoos A, O’Day S, et al. Guidelines for the evaluation of immune therapy activity in solid tumors: immune-related response criteria. Clin Cancer Res. 2009;15(23):7412-7420. [DOI] [PubMed] [Google Scholar]
- 7.Eisenhauer EA, Therasse P, Bogaerts J, et al. New response evaluation criteria in solid tumours: revised RECIST guideline (version 1.1). Eur J Cancer. 2009;45(2):228-247. [DOI] [PubMed] [Google Scholar]
- 8.Hodi FS, Hwu WJ, Kefford R, et al. Evaluation of immune-related response criteria and RECIST v1.1 in patients with advanced melanoma treated with Pembrolizumab. J Clin Oncol. 2016;34(13):1510-1517. [DOI] [PMC free article] [PubMed] [Google Scholar]
- 9.Diem S, Kasenda B, Spain L, et al. Serum lactate dehydrogenase as an early marker for outcome in patients treated with anti–PD-1 therapy in metastatic melanoma. Br J Cancer. 2016;114(3):256-261. [DOI] [PMC free article] [PubMed] [Google Scholar]
- 10.Borghaei H, Paz-Ares L, Horn L, et al. Nivolumab versus Docetaxel in advanced non-squamous non–small cell lung cancer. N Engl J Med. 2015;373(17):1627-1639. [DOI] [PMC free article] [PubMed] [Google Scholar]
- 11.Bettegowda C, Sausen M, Leary RJ, et al. Detection of circulating tumor DNA in early- and late-stage human malignancies. Sci Transl Med. 2014;6(224):224ra24. [DOI] [PMC free article] [PubMed] [Google Scholar]
Associated Data
This section collects any data citations, data availability statements, or supplementary materials included in this article.
Supplementary Materials
eMethods 1. Patient Inclusion and Exclusion Criteria
eMethods 2. Disease Characteristics Assessment
eMethods 3. Plasma Collection and Circulating Tumor DNA (ctDNA) Extraction and Quantification
eMethods 4. Circulating Tumor DNA (ctDNA) and Lactate Dehydrogenase (LDH) Profile Groups
eMethods 5. Statistical Analysis
eTable. Patient and Disease Characteristics at Baseline
eFigure 1. Changes in Circulating Tumor DNA (ctDNA), Lactate Dehydrogenase (LDH) and Disease Volume With Treatment in Patient 1
eFigure 2. Changes in Circulating Tumor DNA (ctDNA), Lactate Dehydrogenase (LDH), and Disease Volume With Treatment in Patient 2
eFigure 3. Changes in Circulating Tumor DNA (ctDNA), Lactate Dehydrogenase (LDH), and Disease Volume With Treatment in Patient 3
eFigure 4. Overview of Serial LDH Results and Response in 29 Patients


