

Abstract
BACKGROUND
We examined the neurobiological mechanisms underlying stress susceptibility using structural magnetic resonance imaging and diffusion tensor imaging to determine neuroanatomic differences between stress-susceptible and resilient mice. We also examined synchronized anatomic differences between brain regions to gain insight into the plasticity of neural networks underlying stress susceptibility.
METHODS
C57BL/6 mice underwent 10 days of social defeat stress and were subsequently tested for social avoidance. For magnetic resonance imaging, brains of stressed (susceptible, n = 11; resilient, n = 8) and control (n = 12) mice were imaged ex vivo at 56 μm resolution using a T2-weighted sequence. We tested for behavior-structure correlations by regressing social avoidance z-scores against local brain volume. For diffusion tensor imaging, brains were scanned with a diffusion-weighted fast spin echo sequence at 78 μm isotropic voxels. Structural covariance was assessed by correlating local volume between brain regions.
RESULTS
Social avoidance correlated negatively with local volume of the cingulate cortex, nucleus accumbens, thalamus, raphe nuclei, and bed nucleus of the stria terminals. Social avoidance correlated positively with volume of the ventral tegmental area (VTA), habenula, periaqueductal gray, cerebellum, hypothalamus, and hippocampal CA3. Fractional anisotropy was increased in the hypothalamus and hippocampal CA3. We observed synchronized anatomic differences between the VTA and cingulate cortex, hippocampus and VTA, hippocampus and cingulate cortex, and hippocampus and hypothalamus. These correlations revealed different structural covariance between brain regions in susceptible and resilient mice.
CONCLUSIONS
Stress-integrative brain regions shape the neural architecture underlying individual differences in susceptibility and resilience to chronic stress.
Keywords: Chronic stress, Cingulate cortex, Depression, DTI, Hippocampus, MRI, Neural circuits, Ventral tegmental area
Chronic stress is a major risk factor for depression (1); however, it is unclear why some individuals are more susceptible to the effects of stress than others. Although numerous target brain structures are implicated in mediating stress susceptibility (2–9), a systems-level analysis of individual neuroanatomic differences of susceptibility and resilience is missing.
Chronic social defeat stress is a well-validated mouse model that consistently generates susceptible and resilient phenotypes (10). Brain reward pathways, including the ventral tegmental area (VTA) and the nucleus accumbens (NAc) (4) as well as the prefrontal cortex (PFC) and the amygdala (11,12), have been implicated in the neural circuitry mediating these differences in stress susceptibility. In particular, phasic firing of dopaminergic neurons from the VTA to the NAc promotes susceptibility, whereas firing of dopaminergic neurons from the VTA to the medial PFC promotes resilience (4). The hippocampus regulates neuroendocrine and behavioral responses to stress (13,14). At the circuit level, hippocampal connections to the hypothalamus inhibit the release of glucocorticoid hormones via suppression of the hypothalamus-pituitary-adrenal (HPA) axis (13–15). However, no study to date has attempted to characterize synchronized differences between the hippocampus and hypothalamus as they relate to susceptibility and resilience to chronic social stress.
Functional neuroplasticity can be accompanied by structural changes in gray matter. For example, increased volume of the posterior hippocampus in taxi drivers (16) is consistent with bilateral activation of the same region during navigational tasks (17). Juggling is associated with changes in gray and white matter structures of complex visual motion (18,19). These data support the view that neuroanatomic differences may be closely related to their functional requirement during conditions in which the volume change can be observed (20).
In this study, we used magnetic resonance imaging (MRI) and diffusion tensor imaging (DTI) (21,22) to detect stress-induced neuroanatomic differences. We first tested whether structural MRI was capable of detecting changes in brain volume previously associated with susceptibility and resilience to chronic stress. We used DTI to investigate diffusion properties associated with differences in tissue microstructure of these brain regions. Next, we examined if synchronized anatomic changes were reflective of previously identified functional connections and whether the hippocampus may be involved in this circuitry. Finally, we used an unbiased approach to ascertain volume differences and tissue diffusion properties of regions not previously implicated in stress susceptibility. This is the first study to our knowledge to provide a comprehensive, systems-level analysis of regional volume and tissue diffusion characteristics that correlate with stress susceptibility and resilience.
METHODS AND MATERIALS
A full description of all experimental procedures is provided in the Supplement.
Mice
Adult male C57BL/6 mice 8 weeks old (Charles River Laboratories, Sherbrooke, Quebec, Canada) were pair-housed on a 12-hour light/dark cycle. CD1 retired breeders (Charles River Laboratories) were single-housed. All procedures were performed according to guidelines of the Canadian Council on Animal Care and approved by the McGill University Animal Care Committee.
Social Defeat Stress Procedure
Adult male C57BL/6 mice (n = 19) were physically defeated by a new CD1 aggressor mouse for 5 minutes every day for 10 days and subsequently housed across a perforated plexiglass divider in the same cage with the aggressor for 24 hours (23). Control mice (n = 12) were housed two per cage across a divider and paired with a new control mouse every day.
Social Interaction Test and Social Avoidance z Scoring
During the first trial, defeated mice were allowed to explore an open field arena (42 cm × 42 cm × 42 cm) containing an empty wire mesh enclosure for 150 seconds. During the second trial, a CD1 mouse was placed into the enclosure, and the experimental mouse was reintroduced for 150 seconds. Social interaction ratios were calculated as time spent in the interaction zone during the second trial/time spent in the interaction zone during the first trial. Mice with social interaction ratios <1 were considered “susceptible” (n = 11); mice with social interaction ratios >1 were considered “resilient” (n = 8) (23). In addition, social avoidance z scores were calculated to integrate the following behavioral outcomes: 1) time spent in the interaction zone during the second trial, 2) time spent in the corner zones during the second trial, and 3) ratio of time spent in the corner zone during the second trial divided by the first trial (Supplemental Figure S1). These integrated z scores were used as a continuous variable for social avoidance across susceptible and resilient groups. This common variable was correlated with brain volume in the MRI analysis and with fractional anisotropy (FA) in the DTI analysis.
Ex Vivo MRI and DTI
A T2-weighted sequence was used to obtain images for deformation-based morphometry. A custom-built 16-coil solenoid array was used to image 16 samples concurrently at 56 μm isotropic voxel resolution (22). The three-dimensional fast spin echo sequence had the following parameters: repetition time = 2000 ms; echo train length = 6; effective echo time = 42 ms; field of view = 25 mm × 28 mm × 14 mm; matrix size = 450 mm × 504 mm × 250 mm. Total imaging time was 11.7 hours. For DTI, brains were scanned with a three-dimensional diffusion-weighted fast spin echo sequence (30 directions with B = 2147 s/mm2; 5 B0 images; repetition time = 270 ms; echo train length = 6; first echo time = 15 ms; echo time = 6 ms for the remaining 5 echoes, two averages; field of view = 25 mm × 14 mm × 14 mm; matrix size = 324 mm × 180 mm × 180 mm, yielding 78 μm isotropic voxels; total imaging time = 12.5 hours).
Image Statistics
The social avoidance z score was regressed against log-Jacobians of each individual at each voxel within a priori regions of interest. Clusters were defined at a voxelwise threshold of p < .05. Jacobians were extracted at points of local maxima/minima on the resulting maps of voxelwise t values, or “peak voxels” for brevity. Correlation plots display the Jacobians versus the behavioral score. Cluster thresholding from random field theory (24) was used to control for multiple comparisons. The search region was restricted to the preselected regions of interest (volume, 90.91 mm3; 517,639 voxels), and a cluster-forming threshold of p < .01 was chosen. Resulting clusters with an extent of 273 voxels at a |t| > 2.57 survived multiple comparisons at p < .05.
RESULTS
Stress Susceptibility Correlates With Neuroanatomic Differences in Candidate Brain Regions
We subjected male C57BL/6 mice (n = 19) to 10 days of chronic social defeat and correlated social avoidance z scores of all 19 stressed animals with the neuroanatomic volume of predetermined regions of interest from across the brain (Supplemental Table S1) to gain a complete view of brain regions associated with individual differences in the stress response (Figure 1; red areas indicate positive correlations, and blue areas indicate negative correlations). We first focused on regions that were previously shown to mediate stress susceptibility or resilience in the same stress model: VTA, cingulate cortex, NAc, and amygdala. Social avoidance scores correlated positively with VTA peak voxel volume (r = .69, p < .001) (Figure 2A), supporting a role of the VTA in promoting stress susceptibility. In addition, we found a significant negative correlation between social avoidance scores and peak voxel volumes of the cingulate cortex (r = −.79, p < .001) (Figure 2B), suggesting that the cingulate cortex is smaller in stress-susceptible mice. Social avoidance scores also correlated negatively with peak voxel volumes of the NAc (r = −.48, p < .05) (Figure 2C) and positively with peak voxel volumes of the amygdala (r = .77, p < .01) (Figure 2D) (25–27). Our DTI analysis revealed that FA correlated with behavioral z scores in opposite directions than anatomic volume in the VTA, NAc, and cingulate cortex. In the amygdala, FA-behavior and volume-behavior correlations had the same direction (Supplemental Figure S2).
Figure 1.
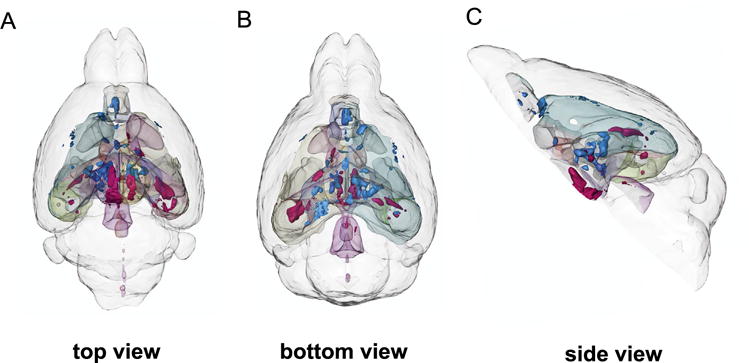
Three-dimensional rendering of all significant volume changes after chronic social defeat stress in 19 mice. Red clusters indicate positive correlations with social avoidance, and blue clusters indicate negative correlations with social avoidance. (A) Top view. (B) Bottom view. (C) Side view.
Figure 2.
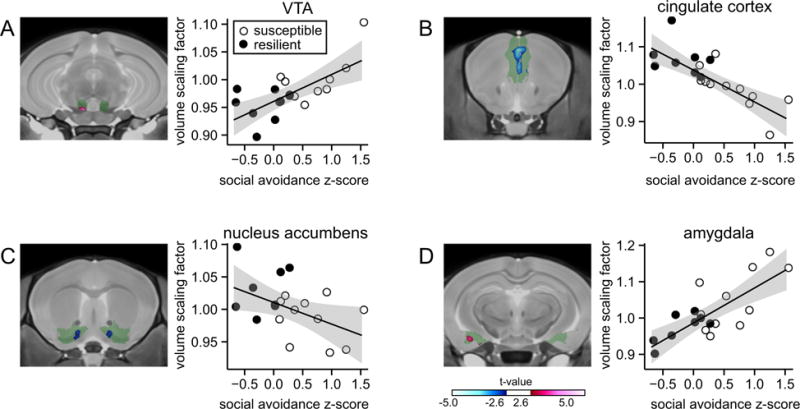
Correlations between social avoidance and volumes of previously established stress-related brain structures. Social avoidance z scores are correlated with anatomic volume at the most significant voxel within selected brain structures. (A) Positive correlation with ventral tegmental area (VTA). (B) Negative correlation with cingulate cortex. (C) Negative correlation with nucleus accumbens. (D) Positive correlation with amygdala. Green areas indicate the entire brain structure; blue and red areas indicate regions with significant volume changes. Open circles indicate susceptible mice (n = 11) and solid circles indicate resilient mice (n = 8) based on social interaction ratio.
We expanded our analyses to the hippocampus and hypothalamus, structures involved in mood and neuroendocrine regulation (14,28–30). We found significant positive correlations between social avoidance scores and peak voxel volumes of the hippocampus (r = .81, p < .001) (Figure 3A) and hypothalamus (r = .77, p < .01) (Figure 3B), suggesting that larger hypothalamus and hippocampal volumes are associated with stress susceptibility. Larger hippocampal volume was specifically observed in CA3 (red areas in Figure 3A), a region of the hippocampus that is particularly vulnerable to the effects of stress (8,31). We found similar correlations when separately analyzing the dorsal (r = .80, p < .001) and ventral (r = .81, p < .001) hippocampus (Supplemental Figure S3). Atlas-based comparisons of group-level structural differences confirmed larger hippocampal volume in susceptible (n = 11) compared with resilient (n = 8) mice (Supplemental Table S1 and Figure S4). In addition, our DTI analysis revealed positive correlations between behavioral z scores and FA in the hippocampus and hypothalamus, indicating that diffusion in these structures is more anisotropic in susceptible mice (Figure 3A, B; graphs on the right). No significant correlations were observed between social avoidance z score and volume of the same brain structures in control mice (n = 12) (Supplemental Figure S5). These data demonstrate that stress susceptibility positively correlates with increased volume and more anisotropic diffusion in the hypothalamus and hippocampal CA3.
Figure 3.
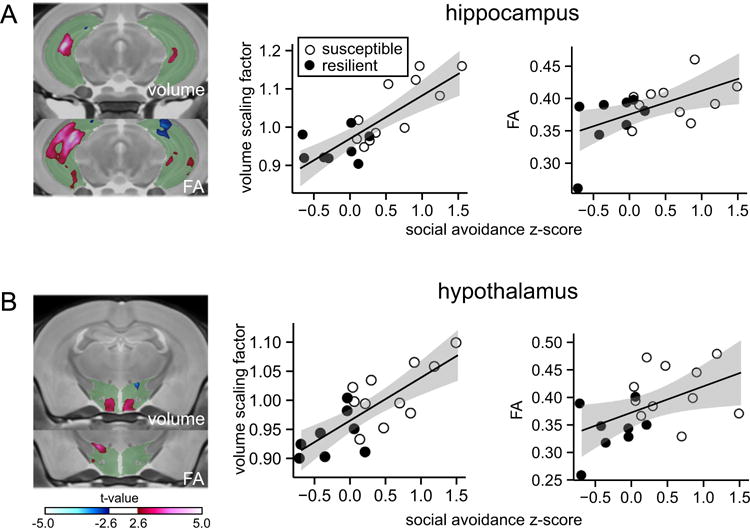
Correlations between social avoidance, hippocampus and hypothalamus volume, and fractional anisotropy (FA). Social avoidance z scores are correlated with anatomic volume and FA at the most significant voxel within selected brain structures. (A) Positive correlation with hippocampal volume and FA. (B) Positive correlation with hypothalamus volume and FA. Green areas indicate the entire brain structure; blue and red areas indicate regions with significant volume changes. Open circles indicate susceptible mice (n = 11) and solid circles indicate resilient mice (n = 8) based on social interaction ratio.
Synchronized Neuroanatomic Differences of Stress-Integrative Brain Regions Are Associated With Susceptibility and Resilience
We tested for networks of anatomic covariance to gain insight into the neural circuitry involved in stress susceptibility and resilience (32). We first correlated peak voxel volumes within the VTA with peak voxel volumes within the cingulate cortex and NAc. We found a negative correlation between peak voxel volumes of the VTA and the cingulate cortex (r = −.61, p = .01) (Figure 4A). Susceptible and resilient mice cluster at opposite ends of this correlation (Figure 4A; open circles, susceptible mice, n = 11; solid circles, resilient mice, n = 8). In susceptible mice, smaller cingulate cortex volume predicts larger VTA volume; in resilient mice, larger cingulate cortex volume predicts smaller VTA volume. These results suggest coordinated, but opposite, changes in VTA and medial PFC volume across experimental groups. We observed a trend toward a small negative correlation between the VTA and NAc in our analysis (r = −.14, p = .06) (Figure 4B).
Figure 4.
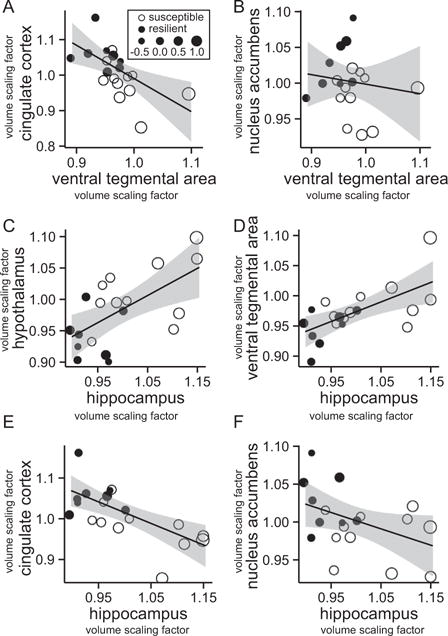
Structural covariance between candidate brain regions. Peak voxel volume correlations are shown for (A) ventral tegmental area and cingulate cortex, (B) ventral tegmental area and nucleus accumbens, (C) hippocampus and hypothalamus, (D) hippocampus and ventral tegmental area, (E) hippocampus and cingulate cortex, and (F) hippocampus and nucleus accumbens. Open circles indicate susceptible mice (n = 11) and solid circles indicate resilient mice (n = 8) based on social interaction ratio. Circle sizes correspond to the social avoidance score of the respective animal.
The hippocampus regulates hypothalamic control over the HPA axis (14,33–35). To investigate whether hippocampus-hypothalamus connectivity may determine individual differences in stress sensitivity, we correlated hippocampal volume with hypothalamus volume and found a positive correlation across all chronically defeated mice (r = .62, p = .005; n = 19) (Figure 4C). Similar to our findings for the VTA and cingulate cortex, susceptible (n = 11, open circles) and resilient (n = 8, solid circles) mice cluster at opposite ends of this correlation, suggesting that stress susceptibility is associated with stronger structural covariance between the hippocampus and hypothalamus.
We then addressed the question whether these brain regions might interact as part of a stress-sensitive neural circuitry. Hippocampal volume is positively correlated with VTA volume (r = .64, p = .003) (Figure 4D) and negatively correlated with cingulate cortex volume (r = −.68, p = .001) (Figure 4E), suggesting an interaction of the hippocampus with the VTA and medial PFC (4). We found a trend toward a negative correlation between the volume of the hippocampus and NAc (r = −.44, p = .06) (Figure 4F). We also used an interaction model to test all structure-structure correlations for group dependences (i.e., to test whether either the susceptible or the resilient mice drive these correlations). Using this analysis, we did not find any interactions that were significant (Supplemental Table S3). In control mice (n = 12), we observed correlations only between the hippocampus and hypothalamus (r = .57, p = .04) (Supplemental Figure S6C) and between the hippocampus and cingulate cortex (r = .6, p = .001) (Supplemental Figure S6E), but not between any of the other brain regions analyzed (Supplemental Figure S6).
Brain-Wide Neuroanatomic Differences Associated With Susceptibility to Chronic Stress
We also detected correlations of social avoidance and peak voxel volume in additional brain regions, which we did not predict a priori to be associated with stress sensitivity. Social avoidance scores correlated negatively with the volume of the bed nucleus of the stria terminals (BNST) (r = −.78, p < .001) (Figure 5A), a brain structure involved in neuroendocrine regulation and anxiety-like behavior (36–39); the raphe nuclei (r = −.64, p = .003) (Figure 5B), which are importantly involved in regulating serotoninergic tone (40,41); the thalamus (r = −.79, p < .001) (Figure 5C), which controls consciousness and information relay; and the corpus callosum (r = −.77, p < .001) (Figure 5D), the central white matter tract connecting both cerebral hemispheres. Social avoidance scores also correlated positively with volume of the habenular commissure (r = .69, p = .001) (Figure 5E), a brain structure associated with depression and antidepressant response (42); the periaqueductal gray (r = .66, p = .002) (Figure 5F), a region involved in fear responses and defensive behavior (43,44); and the cerebellum (r = .78, p < .001) (Figure 5G), which has been implicated in neuropsychiatric disorders (45). Our DTI analysis showed correlations in FA with behavioral z scores for the BNST, thalamus, habenular commissure, periaqueductal gray, and cerebellum (Supplemental Figure S7). Similar to our observation in the VTA, cingulate cortex, and NAc, most of these correlations occurred in opposite directions than anatomic volume, again suggesting that increased volume may be associated with less anisotropic diffusion in these brain regions. We did not find any significant correlations between social avoidance and volume or FA of any of these brain regions in control mice (n = 12).
Figure 5.
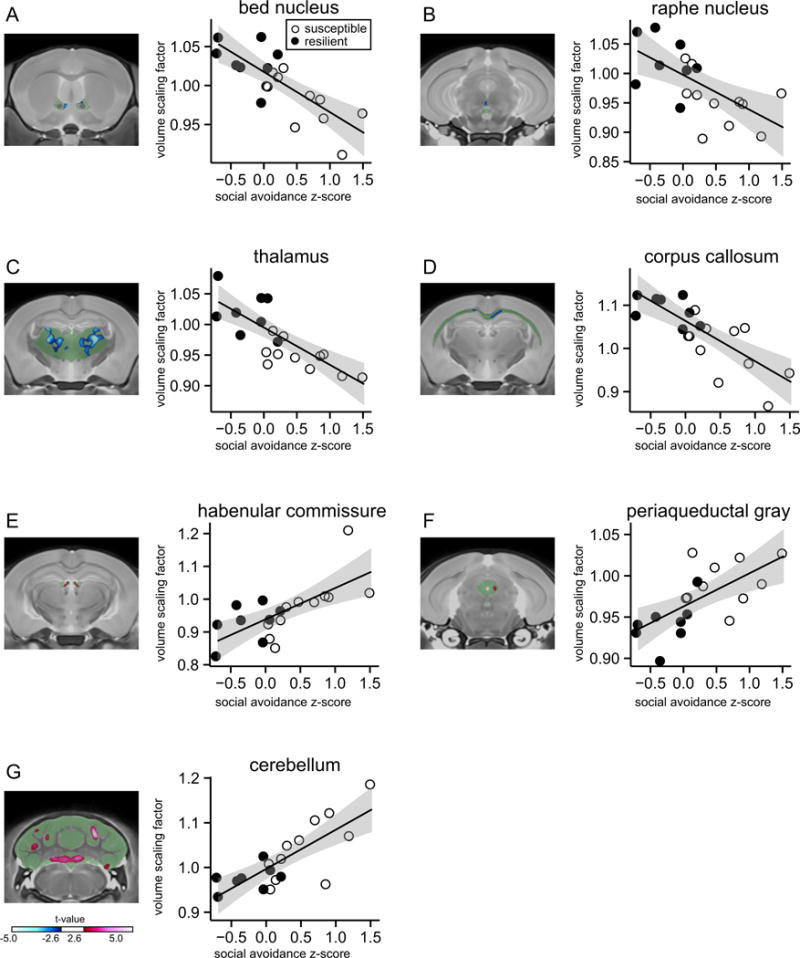
Correlations between social avoidance and volumes of structures not previously associated with social defeat stress. Social avoidance z scores are correlated with anatomic volume at the most significant voxel. (A) Negative correlation with the bed nucleus of the stria terminals, (B) negative correlation with raphe nucleus, (C) negative correlation with thalamus, (D) negative correlation with corpus callosum, (E) positive correlation with habenular commissure, (F) positive correlation with periaqueductal gray, and (G) positive correlation with the cerebellum. Green areas indicate the entire brain structure; blue and red areas indicate regions with significant volume changes. Open circles indicate susceptible mice (n = 11) and solid circles indicate resilient mice (n = 8) based on social interaction ratio.
We also conducted atlas-based comparisons of group-level structural differences between susceptible and resilient mice for these novel brain regions. This additional analysis confirmed smaller BNST and corpus callosum volume in susceptible compared with resilient mice (Supplemental Table S2 and Figure S4).
DISCUSSION
This is the first study to use ex vivo structural MRI and DTI to detect differences in local brain volume and tissue diffusion properties associated with stress susceptibility and resilience. These findings are of particular relevance for our understanding of the neuroanatomy underlying individual differences in stress susceptibility and may provide potential new therapeutic targets for stress-induced psychiatric disorders, such as anxiety and depression.
Social defeat–induced anxiety and depressive-like behaviors were previously associated with decreased neuronal activity in the medial PFC (46) as well as increased VTA and amygdala activity (10–12). Our structural analysis revealed that gray matter volume of the VTA increased as a function of social avoidance, whereas cingulate cortex and NAc volumes declined with increasing social avoidance. These data support the notion that anatomic differences in these brain regions may be associated with their previously established functional role in mediating individual differences in stress susceptibility.
An analysis of structural covariance revealed a negative correlation between VTA and cingulate cortex volume. Specifically, stress-susceptible mice exhibit smaller cingulate cortex volume, predicting larger VTA volume, whereas in resilient mice larger cingulate cortex volume predicts smaller VTA volume. These synchronized anatomic differences may reflect altered connectivity between these regions in susceptible and resilient mice. At the functional level, previous studies showed that dopaminergic connections from the VTA to the medial PFC promote resilience to social defeat, whereas connections from the VTA to the NAc promote susceptibility (4,47). We observed only a trend toward a correlation between VTA and NAc volume in our analysis. The lack of significant correlation between these two nuclei may suggest that, at the structural level, differences in connectivity between the VTA, medial PFC, and NAc may be primarily driven by covariance between the VTA and cingulate cortex. Alternatively, connectivity between these regions could occur as a result of changes in synaptic strength, which might not manifest as detectable volume differences.
The hippocampus governs HPA axis activity by modulating the function of the hypothalamus (30). Social avoidance correlated positively with the volume of the hippocampus and hypothalamus. Although increased hypothalamic volume supports the notion that HPA axis hyperactivity is associated with susceptibility to chronic stress, increased hippocampal volume may appear contrary to previous studies, which have shown smaller hippocampi in depressed patients (48,49) and hippocampal atrophy following stress (8,31,50–52). Some studies have observed an association between the number of stressful life events and increased hippocampal volume in elderly, nondepressed subjects (53). Moreover, men with larger hippocampi show a greater cortisol awakening response and increased cortisol release in response to social stress (54), suggesting that larger hippocampal volume may be associated with greater stress reactivity and HPA axis hyperactivity.
Whether the observed volume differences are the basis for or the result of higher stress susceptibility remains elusive. The fact that social avoidance in our study is not correlated with brain volume in control animals suggests that different anatomy and connectivity may be the consequence of stress exposure. Such stress-induced alterations may result from elevated glucocorticoid levels and potential differences in glucocorticoid release or differences in sensitivity to glucocorticoids between susceptible and resilient mice (55). However, a recent longitudinal study suggested that stress-susceptible mice have larger hippocampal volume than resilient mice before stress onset (56). Our findings, which confirm the result of this study, may at least in part also reflect individual trait differences.
We found structural covariance between hippocampal CA3 and the hypothalamus in stressed as well as control mice, suggesting that structural synchrony between these regions generally exists in nonstressed individuals. However, after stress, susceptible mice show greater volume associations between these regions than resilient mice, as indicated by the finding that susceptible and resilient mice cluster at opposite ends of the correlation (Figure 3). Increased volumes of two of the key regulators of the HPA axis may possibly sensitize susceptible individuals to develop HPA axis abnormalities and social avoidance more so than resilient mice. Nevertheless, it is unclear how increased hippocampal volume may explain increased hypothalamic volume. Glutamatergic hippocampal outputs generally activate GABAergic inhibitory neurons of subcortical relay areas, including the BNST, which consequently inhibit neurons in the paraventricular nucleus of the hypothalamus. Our analysis revealed that the volume of the BNST is reduced as a function of social avoidance. Reduced volume of the BNST in susceptible mice may reflect network abnormalities by which hippocampal information relay to the hypothalamus could be disturbed. Such disturbances in hippocampus-hypothalamus connectivity may be associated with enlarged hippocampal volume as a result of compensatory changes in the hippocampus that are aimed at reducing HPA axis hyperactivity. Such a model of neuroendocrine network abnormalities in the susceptible brain does not exclude the possibility that prolonged periods of stress may reduce hippocampal volume at time periods exceeding the 10-day stress paradigm used in this study.
We also found that hippocampal volume is positively correlated with VTA volume and negatively correlated with cingulate cortex and NAc volume, suggesting that the hippocampus may be part of a comprehensive neuroanatomic network associated with stress sensitivity. Although functional connections from the hippocampus activate VTA neurons (57), it remains to be elucidated whether the correlations of brain volume that we identified in our study are associated with activation of such functional networks.
Our systems-level analysis of anatomic volume differences in susceptible and resilient mice revealed numerous brain regions with potential relevance to anxiety and depression. As described earlier, the BNST is crucially involved in HPA axis regulation and neuroendocrine responses. Moreover, the BNST sends outputs to hypothalamic targets to produce fear responses (38,39), which may be particularly relevant for defeat-induced social avoidance. We also found that susceptible mice exhibit reduced volume of the raphe nuclei, which are critically involved in regulating serotoninergic tone (40,41). Reduced raphe volume may affect serotonin signaling throughout the brain, contributing to stress reactivity and to the development of depressive-like behavior (58). We also found increased volume of the periaqueductal gray as a function of stress susceptibility, pointing toward differences in fear and panic responses between susceptible and resilient mice (43,44,59).
In addition to our peak voxel volume correlations, we also tested for atlas-based group-level differences between susceptible and resilient mice for the same regions that we found significantly correlated with social avoidance in our voxelwise comparisons. This additional analysis confirmed larger hippocampal volume and smaller volume of the BNST and corpus callosum in susceptible mice. However, the differences were less significant, indicating the importance of the z score measure of behavior for differentiating between individuals.
A general consideration for evaluating local volume differences associated with social defeat stress is the underlying tissue microstructure. Our multiparametric approach of combining MRI and DTI data from the same brain regions may provide some first insight into differences in tissue microstructure associated with structural differences between susceptible and resilient brains. Some studies showed that FA can predict cell number and tissue density (60,61) and that higher FA could indicate greater tissue integrity. In our study, local volume and FA correlate in opposite directions with social avoidance in the VTA, cingulate cortex, NAc, BNST, thalamus, periaqueductal gray, and cerebellum. In contrast, local volume and FA positively correlate with social avoidance in the hippocampus and hypothalamus. These data suggest that local brain volume can be associated with either more or less restricted diffusion through the underlying tissue, potentially indicating higher or lower tissue integrity, respectively. A simple distinction between gray and white matter or cortical and subcortical tissue does not seem sufficient to explain the observed behavior-FA and behavior-volume correlations. A larger FA might indicate more pronounced tissue anisotropy, possibly resulting from increased axonal density, increased organization along the dominant axis (e.g., alignment of neurites), decreased interfering processes (e.g., neuritis, glial cells, vasculature), and increased myelination (62,63). A change in overall volume is likely to increase anisotropy in anisotropic compartments if the structure itself resists the overall volume change along the dominant axis of the tissue anisotropy. This hypothesis agrees with an increased FA in compressed brain tissue after hematoma (64).
Microscopic alterations in brain volume and anisotropy can be caused by changes in synaptogenesis, neuronal morphology, fiber density, and axonal branching as well as by extraneuronal changes, such as glial cell number or angiogenesis (65). Future studies should explore further such cellular and molecular foundations for differences in brain volume and anisotropy. The use of immunohistologic techniques to determine numbers of neurons, glia cells, and axons may help identify the cellular origin of FA and local volume, as previously shown (22,66,67). In addition, a direct measure of neuronal activity is not provided by brain structure, anisotropy, or cell number. Although changes in the cellular organization of a specific brain region can result from the molecular processes after neuronal activity (65,68), functional studies employing techniques for chronic activation or inhibition of neurons within the brain regions identified in this study would help to clarify their functional role in mediating stress susceptibility and resilience.
Previous studies used other animal models of chronic stress and MRI-based techniques to examine stress-induced differences in brain anatomy and underlying tissue micro-structure. For example, Delgados y Palacios et al. (69,70) reported an outward displacement at the ventral tip of the hippocampus and observed decreased diffusion kurtosis in the hippocampus after chronic mild stress in rats. Moreover, differences in diffusivity and kurtosis were observed in the amygdala and caudate putamen, but not in the PFC. Using proton magnetic resonance spectroscopy, Hemanth Kumar et al. (71) identified decreased glutamate, glutamine, and gamma-aminobutyric acid levels in the hippocampus and PFC of chronically stressed rats, which may be related to changes in tissue integrity within these structures. In light of our study and this recent work, a consensus seems to emerge between structural alterations, tissue diffusivity, and underlying tissue microstructure in key brain regions, such as the hippocampus. To increase the translational value of MRI-based studies across different rodent stress paradigms, it will be important to identify which specific neural correlates associate with defined stressors and behavioral outcomes in different preclinical models of chronic stress.
In conclusion, new measures of stress susceptibility and resilience in the mouse brain would allow the testing of novel interventions, including psychiatric drugs, for their effects on local brain volume in vivo. Our findings may be a first step toward clinical application, as MRI and DTI could potentially be used as biomedical tools to inform a clinical diagnosis of depression risk based on neuroanatomic abnormalities in patients seeking psychiatric services. In addition to our findings, in vivo longitudinal imaging at baseline and after stress may be a powerful method of translational relevance to detect interindividual variations in brain regions that may characterize susceptible and resilient individuals before stress onset. Identifying neuroanatomic differences that predispose individuals to developing depression after chronic stress may help target stress-preventive measures to alleviate the burden of mental illness.
Supplementary Material
Acknowledgments
DISCLOSURES
This work was supported by the Hope for Depression Research Foundation, Ontario Brain Institute, German Research Foundation (Deutsche Forschungsgemeinschaft) (CA), and Canadian Institute for Advanced Research Child and Brain Development Program/NeuroDevNet (KJO).
Footnotes
The authors report no biomedical financial interests or potential conflicts of interest.
Supplementary material cited in this article is available online at http://dx.doi.org/10.1016/j.biopsych.2015.08.009.
References
- 1.Kessler RC. The effects of stressful life events on depression. Annu Rev Psychol. 1997;48:191–214. doi: 10.1146/annurev.psych.48.1.191. [DOI] [PubMed] [Google Scholar]
- 2.Hermans EJ, van Marle HJ, Ossewaarde L, Henckens MJ, Qin S, van Kesteren MT, et al. Stress-related noradrenergic activity prompts large-scale neural network reconfiguration. Science. 2011;334:1151–1153. doi: 10.1126/science.1209603. [DOI] [PubMed] [Google Scholar]
- 3.Jankord R, Herman JP. Limbic regulation of hypothalamo-pituitary-adrenocortical function during acute and chronic stress. Ann N Y Acad Sci. 2008;1148:64–73. doi: 10.1196/annals.1410.012. [DOI] [PMC free article] [PubMed] [Google Scholar]
- 4.Chaudhury D, Walsh JJ, Friedman AK, Juarez B, Ku SM, Koo JW, et al. Rapid regulation of depression-related behaviours by control of midbrain dopamine neurons. Nature. 2013;493:532–536. doi: 10.1038/nature11713. [DOI] [PMC free article] [PubMed] [Google Scholar]
- 5.Amico F, Meisenzahl E, Koutsouleris N, Reiser M, Moller HJ, Frodl T. Structural MRI correlates for vulnerability and resilience to major depressive disorder. J Psychiatry Neurosci. 2010;36:15–22. doi: 10.1503/jpn.090186. [DOI] [PMC free article] [PubMed] [Google Scholar]
- 6.Sheline YI, Wang PW, Gado MH, Csernansky JG, Vannier MW. Hippocampal atrophy in recurrent major depression. Proc Natl Acad Sci U S A. 1996;93:3908–3913. doi: 10.1073/pnas.93.9.3908. [DOI] [PMC free article] [PubMed] [Google Scholar]
- 7.Videbech P, Ravnkilde B. Hippocampal volume and depression: A meta-analysis of MRI studies. Am J Psychiatry. 2004;161:1957–1966. doi: 10.1176/appi.ajp.161.11.1957. [DOI] [PubMed] [Google Scholar]
- 8.Watanabe Y, Gould E, McEwen BS. Stress induces atrophy of apical dendrites of hippocampal CA3 pyramidal neurons. Brain Res. 1992;588:341–345. doi: 10.1016/0006-8993(92)91597-8. [DOI] [PubMed] [Google Scholar]
- 9.Nestler EJ, Barrot M, DiLeone RJ, Eisch AJ, Gold SJ, Monteggia LM. Neurobiology of depression. Neuron. 2002;34:13–25. doi: 10.1016/s0896-6273(02)00653-0. [DOI] [PubMed] [Google Scholar]
- 10.Krishnan V, Han MH, Graham DL, Berton O, Renthal W, Russo SJ, et al. Molecular adaptations underlying susceptibility and resistance to social defeat in brain reward regions. Cell. 2007;131:391–404. doi: 10.1016/j.cell.2007.09.018. [DOI] [PubMed] [Google Scholar]
- 11.Narayanan V, Heiming RS, Jansen F, Lesting J, Sachser N, Pape HC, et al. Social defeat: Impact on fear extinction and amygdala-prefrontal cortical theta synchrony in 5-HTT deficient mice. PLoS One. 2011;6:e22600. doi: 10.1371/journal.pone.0022600. [DOI] [PMC free article] [PubMed] [Google Scholar]
- 12.Fekete EM, Zhao Y, Li C, Sabino V, Vale WW, Zorrilla EP. Social defeat stress activates medial amygdala cells that express type 2 corticotropin-releasing factor receptor mRNA. Neuroscience. 2009;162:5–13. doi: 10.1016/j.neuroscience.2009.03.078. [DOI] [PMC free article] [PubMed] [Google Scholar]
- 13.Anacker C, O’Donnell KJ, Meaney MJ. Early life adversity and the epigenetic programming of hypothalamic-pituitary-adrenal function. Dialogues Clin Neurosci. 2014;16:321–333. doi: 10.31887/DCNS.2014.16.3/canacker. [DOI] [PMC free article] [PubMed] [Google Scholar]
- 14.Anacker C, Zunszain PA, Carvalho LA, Pariante CM. The glucocorticoid receptor: Pivot of depression and of antidepressant treatment? Psychoneuroendocrinology. 2011;36:415–425. doi: 10.1016/j.psyneuen.2010.03.007. [DOI] [PMC free article] [PubMed] [Google Scholar]
- 15.Anacker C, Pariante CM. Can adult neurogenesis buffer stress responses and depressive behaviour? Mol Psychiatry. 2012;17:9–10. doi: 10.1038/mp.2011.133. [DOI] [PubMed] [Google Scholar]
- 16.Maguire EA, Gadian DG, Johnsrude IS, Good CD, Ashburner J, Frackowiak RS, et al. Navigation-related structural change in the hippocampi of taxi drivers. Proc Natl Acad Sci U S A. 2000;97:4398–4403. doi: 10.1073/pnas.070039597. [DOI] [PMC free article] [PubMed] [Google Scholar]
- 17.Maguire EA, Burgess N, Donnett JG, Frackowiak RS, Frith CD, O’Keefe J. Knowing where and getting there: A human navigation network. Science. 1998;280:921–924. doi: 10.1126/science.280.5365.921. [DOI] [PubMed] [Google Scholar]
- 18.Draganski B, Gaser C, Busch V, Schuierer G, Bogdahn U, May A. Neuroplasticity: Changes in grey matter induced by training. Nature. 2004;427:311–312. doi: 10.1038/427311a. [DOI] [PubMed] [Google Scholar]
- 19.Scholz J, Klein MC, Behrens TE, Johansen-Berg H. Training induces changes in white-matter architecture. Nat Neurosci. 2009;12:1370–1371. doi: 10.1038/nn.2412. [DOI] [PMC free article] [PubMed] [Google Scholar]
- 20.Bressler SL, Tognoli E. Operational principles of neurocognitive networks. Int J Psychophysiol. 2006;60:139–148. doi: 10.1016/j.ijpsycho.2005.12.008. [DOI] [PubMed] [Google Scholar]
- 21.Lerch JP, Sled JG, Henkelman RM. MRI phenotyping of genetically altered mice. Methods Mol Biol. 2011;711:349–361. doi: 10.1007/978-1-61737-992-5_17. [DOI] [PubMed] [Google Scholar]
- 22.Lerch JP, Yiu AP, Martinez-Canabal A, Pekar T, Bohbot VD, Frankland PW, et al. Maze training in mice induces MRI-detectable brain shape changes specific to the type of learning. Neuroimage. 2011;54:2086–2095. doi: 10.1016/j.neuroimage.2010.09.086. [DOI] [PubMed] [Google Scholar]
- 23.Golden SA, Covington HE, Berton O, Russo SJ. A standardized protocol for repeated social defeat stress in mice. Nat Protoc. 2011;6:1183–1191. doi: 10.1038/nprot.2011.361. [DOI] [PMC free article] [PubMed] [Google Scholar]
- 24.Worsley KJ, Marrett S, Neelin P, Vandal AC, Friston KJ, Evans AC. A unified statistical approach for determining significant signals in images of cerebral activation. Hum Brain Mapp. 1996;4:58–73. doi: 10.1002/(SICI)1097-0193(1996)4:1<58::AID-HBM4>3.0.CO;2-O. [DOI] [PubMed] [Google Scholar]
- 25.Alexander B, Warner-Schmidt J, Eriksson T, Tamminga C, Arango-Lievano M, Ghose S, et al. Reversal of depressed behaviors in mice by p11 gene therapy in the nucleus accumbens. Sci Transl Med. 2010;2:54ra76. doi: 10.1126/scitranslmed.3001079. [DOI] [PMC free article] [PubMed] [Google Scholar]
- 26.Tye KM, Mirzabekov JJ, Warden MR, Ferenczi EA, Tsai HC, Finkelstein J, et al. Dopamine neurons modulate neural encoding and expression of depression-related behaviour. Nature. 2013;493:537–541. doi: 10.1038/nature11740. [DOI] [PMC free article] [PubMed] [Google Scholar]
- 27.Ramirez F, Moscarello JM, LeDoux JE, Sears RM. Active avoidance requires a serial basal amygdala to nucleus accumbens shell circuit. J Neurosci. 2015;35:3470–3477. doi: 10.1523/JNEUROSCI.1331-14.2015. [DOI] [PMC free article] [PubMed] [Google Scholar]
- 28.Kheirbek MA, Drew LJ, Burghardt NS, Costantini DO, Tannenholz L, Ahmari SE, et al. Differential control of learning and anxiety along the dorsoventral axis of the dentate gyrus. Neuron. 2013;77:955–968. doi: 10.1016/j.neuron.2012.12.038. [DOI] [PMC free article] [PubMed] [Google Scholar]
- 29.Meaney MJ, Viau V, Bhatnagar S, Betito K, Iny LJ, O’Donnell D, et al. Cellular mechanisms underlying the development and expression of individual differences in the hypothalamic-pituitary-adrenal stress response. J Steroid Biochem Mol Biol. 1991;39:265–274. doi: 10.1016/0960-0760(91)90072-d. [DOI] [PubMed] [Google Scholar]
- 30.Surget A, Tanti A, Leonardo ED, Laugeray A, Rainer Q, Touma C, et al. Antidepressants recruit new neurons to improve stress response regulation. Mol Psychiatry. 2011;16(12):1177–1188. doi: 10.1038/mp.2011.48. [DOI] [PMC free article] [PubMed] [Google Scholar]
- 31.Magariños AM, McEwen BS, Flügge G, Fuchs E. Chronic psychosocial stress causes apical dendritic atrophy of hippocampal CA3 pyramidal neurons in subordinate tree shrews. J Neurosci. 1996;16:3534–3540. doi: 10.1523/JNEUROSCI.16-10-03534.1996. [DOI] [PMC free article] [PubMed] [Google Scholar]
- 32.Alexander-Bloch A, Giedd JN, Bullmore E. Imaging structural co-variance between human brain regions. Nat Rev Neurosci. 2013;14:322–336. doi: 10.1038/nrn3465. [DOI] [PMC free article] [PubMed] [Google Scholar]
- 33.Meaney MJ, Bhatnagar S, Diorio J, Larocque S, Francis D, O’Donnell D, et al. Molecular basis for the development of individual differences in the hypothalamic-pituitary-adrenal stress response. Cell Mol Neurobiol. 1993;13:321–347. doi: 10.1007/BF00711576. [DOI] [PMC free article] [PubMed] [Google Scholar]
- 34.Plotsky PM, Thrivikraman KV, Meaney MJ. Central and feedback regulation of hypothalamic corticotropin-releasing factor secretion. Ciba Found Symp. 1993;172:59–75. doi: 10.1002/9780470514368.ch4. discussion 75–84. [DOI] [PubMed] [Google Scholar]
- 35.Meaney MJ, O’Donnell D, Rowe W, Tannenbaum B, Steverman A, Walker M, et al. Individual differences in hypothalamic-pituitary-adrenal activity in later life and hippocampal aging. Exp Gerontol. 1995;30:229–251. doi: 10.1016/0531-5565(94)00065-b. [DOI] [PubMed] [Google Scholar]
- 36.Crestani CC, Alves FH, Gomes FV, Resstel LB, Correa FM, Herman JP. Mechanisms in the bed nucleus of the stria terminalis involved in control of autonomic and neuroendocrine functions: A review. Curr Neuropharmacol. 2013;11:141–159. doi: 10.2174/1570159X11311020002. [DOI] [PMC free article] [PubMed] [Google Scholar]
- 37.Gungor NZ, Pare D. CGRP inhibits neurons of the bed nucleus of the stria terminalis: Implications for the regulation of fear and anxiety. J Neurosci. 2014;34:60–65. doi: 10.1523/JNEUROSCI.3473-13.2014. [DOI] [PMC free article] [PubMed] [Google Scholar]
- 38.Davis M, Walker DL, Miles L, Grillon C. Phasic vs sustained fear in rats and humans: Role of the extended amygdala in fear vs anxiety. Neuropsychopharmacology. 2010;35:105–135. doi: 10.1038/npp.2009.109. [DOI] [PMC free article] [PubMed] [Google Scholar]
- 39.Sink KS, Walker DL, Yang Y, Davis M. Calcitonin gene-related peptide in the bed nucleus of the stria terminalis produces an anxiety-like pattern of behavior and increases neural activation in anxiety-related structures. J Neurosci. 2011;31:1802–1810. doi: 10.1523/JNEUROSCI.5274-10.2011. [DOI] [PMC free article] [PubMed] [Google Scholar]
- 40.Hornung JP. The human raphe nuclei and the serotonergic system. J Chem Neuroanat. 2003;26:331–343. doi: 10.1016/j.jchemneu.2003.10.002. [DOI] [PubMed] [Google Scholar]
- 41.Pollak Dorocic I, Fürth D, Xuan Y, Johansson Y, Pozzi L, Silberberg G, et al. A whole-brain atlas of inputs to serotonergic neurons of the dorsal and median raphe nuclei. Neuron. 2014;83:663–678. doi: 10.1016/j.neuron.2014.07.002. [DOI] [PubMed] [Google Scholar]
- 42.Shabel SJ, Proulx CD, Piriz J, Malinow R. Mood regulation. GABA/glutamate co-release controls habenula output and is modified by antidepressant treatment. Science. 2014;345:1494–1498. doi: 10.1126/science.1250469. [DOI] [PMC free article] [PubMed] [Google Scholar]
- 43.Ballesteros CI, de Oliveira Galvão B, Maisonette S, Landeira-Fernandez J. Effect of dorsal and ventral hippocampal lesions on contextual fear conditioning and unconditioned defensive behavior induced by electrical stimulation of the dorsal periaqueductal gray. PLoS One. 2014;9:e83342. doi: 10.1371/journal.pone.0083342. [DOI] [PMC free article] [PubMed] [Google Scholar]
- 44.Quintino-dos-Santos JW, Müller CJ, Santos AM, Tufik S, Rosa CA, Schenberg LC. Long-lasting marked inhibition of periaqueductal gray-evoked defensive behaviors in inescapably-shocked rats. Eur J Neurosci. 2014;39:275–286. doi: 10.1111/ejn.12410. [DOI] [PubMed] [Google Scholar]
- 45.Konarski JZ, McIntyre RS, Grupp LA, Kennedy SH. Is the cerebellum relevant in the circuitry of neuropsychiatric disorders? J Psychiatry Neurosci. 2005;30:178–186. [PMC free article] [PubMed] [Google Scholar]
- 46.Vialou V, Bagot RC, Cahill ME, Ferguson D, Robison AJ, Dietz DM, et al. Prefrontal cortical circuit for depression- and anxiety-related behaviors mediated by cholecystokinin: Role of ΔFosB. J Neurosci. 2014;34:3878–3887. doi: 10.1523/JNEUROSCI.1787-13.2014. [DOI] [PMC free article] [PubMed] [Google Scholar]
- 47.Walsh JJ, Friedman AK, Sun H, Heller EA, Ku SM, Juarez B, et al. Stress and CRF gate neural activation of BDNF in the mesolimbic reward pathway. Nat Neurosci. 2014;17:27–29. doi: 10.1038/nn.3591. [DOI] [PMC free article] [PubMed] [Google Scholar]
- 48.MacQueen GM, Campbell S, McEwen BS, Macdonald K, Amano S, Joffe RT, et al. Course of illness, hippocampal function, and hippocampal volume in major depression. Proc Natl Acad Sci U S A. 2003;100:1387–1392. doi: 10.1073/pnas.0337481100. [DOI] [PMC free article] [PubMed] [Google Scholar]
- 49.Sheline YI. Hippocampal atrophy in major depression: A result of depression-induced neurotoxicity? Mol Psychiatry. 1996;1:298–299. [PubMed] [Google Scholar]
- 50.Woolley CS, Gould E, McEwen BS. Exposure to excess glucocorticoids alters dendritic morphology of adult hippocampal pyramidal neurons. Brain Res. 1990;531:225–231. doi: 10.1016/0006-8993(90)90778-a. [DOI] [PubMed] [Google Scholar]
- 51.Gould E, Woolley CS, McEwen BS. Adrenal steroids regulate postnatal development of the rat dentate gyrus: I. Effects of glucocorticoids on cell death. J Comp Neurol. 1991;313:479–485. doi: 10.1002/cne.903130308. [DOI] [PubMed] [Google Scholar]
- 52.Lupien SJ, Nair NP, Brière S, Maheu F, Tu MT, Lemay M, et al. Increased cortisol levels and impaired cognition in human aging: Implication for depression and dementia in later life. Rev Neurosci. 1999;10:117–139. doi: 10.1515/revneuro.1999.10.2.117. [DOI] [PubMed] [Google Scholar]
- 53.Zannas AS, McQuoid DR, Payne ME, Steffens DC, MacFall JR, Ashley-Koch A, et al. Negative life stress and longitudinal hippocampal volume changes in older adults with and without depression. J Psychiatr Res. 2013;47:829–834. doi: 10.1016/j.jpsychires.2013.02.008. [DOI] [PMC free article] [PubMed] [Google Scholar]
- 54.Pruessner M, Pruessner JC, Hellhammer DH, Bruce Pike G, Lupien SJ. The associations among hippocampal volume, cortisol reactivity, and memory performance in healthy young men. Psychiatry Res. 2007;155:1–10. doi: 10.1016/j.pscychresns.2006.12.007. [DOI] [PubMed] [Google Scholar]
- 55.Hare BD, Beierle JA, Toufexis DJ, Hammack SE, Falls WA. Exercise-associated changes in the corticosterone response to acute restraint stress: Evidence for increased adrenal sensitivity and reduced corticosterone response duration. Neuropsychopharmacology. 2014;39:1262–1269. doi: 10.1038/npp.2013.329. [DOI] [PMC free article] [PubMed] [Google Scholar]
- 56.Tse YC, Montoya I, Wong AS, Mathieu A, Lissemore J, Lagace DC, et al. A longitudinal study of stress-induced hippocampal volume changes in mice that are susceptible or resilient to chronic social defeat. Hippocampus. 2014;24:1120–1128. doi: 10.1002/hipo.22296. [DOI] [PubMed] [Google Scholar]
- 57.Lisman JE, Grace AA. The hippocampal-VTA loop: Controlling the entry of information into long-term memory. Neuron. 2005;46:703–713. doi: 10.1016/j.neuron.2005.05.002. [DOI] [PubMed] [Google Scholar]
- 58.Richardson-Jones JW, Craige CP, Guiard BP, Stephen A, Metzger KL, Kung HF, et al. 5-HT1A autoreceptor levels determine vulnerability to stress and response to antidepressants. Neuron. 2010;65:40–52. doi: 10.1016/j.neuron.2009.12.003. [DOI] [PMC free article] [PubMed] [Google Scholar]
- 59.Graeff FG. Serotonin, the periaqueductal gray and panic. Neurosci Biobehav Rev. 2004;28:239–259. doi: 10.1016/j.neubiorev.2003.12.004. [DOI] [PubMed] [Google Scholar]
- 60.Beppu T, Inoue T, Shibata Y, Yamada N, Kurose A, Ogasawara K, et al. Fractional anisotropy value by diffusion tensor magnetic resonance imaging as a predictor of cell density and proliferation activity of glioblastomas. Surg Neurol. 2005;63:56–61. doi: 10.1016/j.surneu.2004.02.034. discussion 61. [DOI] [PubMed] [Google Scholar]
- 61.Kinoshita M, Hashimoto N, Goto T, Kagawa N, Kishima H, Izumoto S, et al. Fractional anisotropy and tumor cell density of the tumor core show positive correlation in diffusion tensor magnetic resonance imaging of malignant brain tumors. Neuroimage. 2008;43:29–35. doi: 10.1016/j.neuroimage.2008.06.041. [DOI] [PubMed] [Google Scholar]
- 62.Beaulieu C. The basis of anisotropic water diffusion in the nervous system—a technical review. NMR Biomed. 2002;15:435–455. doi: 10.1002/nbm.782. [DOI] [PubMed] [Google Scholar]
- 63.Zatorre RJ, Fields RD, Johansen-Berg H. Plasticity in gray and white: Neuroimaging changes in brain structure during learning. Nat Neurosci. 2012;15:528–536. doi: 10.1038/nn.3045. [DOI] [PMC free article] [PubMed] [Google Scholar]
- 64.Osuka S, Matsushita A, Ishikawa E, Saotome K, Yamamoto T, Marushima A, et al. Elevated diffusion anisotropy in gray matter and the degree of brain compression. J Neurosurg. 2012;117:363–371. doi: 10.3171/2012.4.JNS112305. [DOI] [PubMed] [Google Scholar]
- 65.Evans AC. Networks of anatomical covariance. Neuroimage. 2013;80:489–504. doi: 10.1016/j.neuroimage.2013.05.054. [DOI] [PubMed] [Google Scholar]
- 66.Vernon AC, Natesan S, Crum WR, Cooper JD, Modo M, Williams SC, et al. Contrasting effects of haloperidol and lithium on rodent brain structure: A magnetic resonance imaging study with postmortem confirmation. Biol Psychiatry. 2012;71:855–863. doi: 10.1016/j.biopsych.2011.12.004. [DOI] [PubMed] [Google Scholar]
- 67.Vernon AC, Crum WR, Lerch JP, Chege W, Natesan S, Modo M, et al. Reduced cortical volume and elevated astrocyte density in rats chronically treated with antipsychotic drugs—linking magnetic resonance imaging findings to cellular pathology. Biol Psychiatry. 2014;75:982–990. doi: 10.1016/j.biopsych.2013.09.012. [DOI] [PubMed] [Google Scholar]
- 68.Demerens C, Stankoff B, Logak M, Anglade P, Allinquant B, Couraud F, et al. Induction of myelination in the central nervous system by electrical activity. Proc Natl Acad Sci U S A. 1996;93:9887–9892. doi: 10.1073/pnas.93.18.9887. [DOI] [PMC free article] [PubMed] [Google Scholar]
- 69.Delgado y, Palacios R, Campo A, Henningsen K, Verhoye M, Poot D, Dijkstra J, et al. Magnetic resonance imaging and spectroscopy reveal differential hippocampal changes in anhedonic and resilient subtypes of the chronic mild stress rat model. Biol Psychiatry. 2011;70:449–457. doi: 10.1016/j.biopsych.2011.05.014. [DOI] [PubMed] [Google Scholar]
- 70.Delgado Y, Palacios R, Verhoye M, Henningsen K, Wiborg O, Van der Linden A. Diffusion kurtosis imaging and high-resolution MRI demonstrate structural aberrations of caudate putamen and amygdala after chronic mild stress. PLoS One. 2014;9:e95077. doi: 10.1371/journal.pone.0095077. [DOI] [PMC free article] [PubMed] [Google Scholar]
- 71.Hemanth Kumar BS, Mishra SK, Rana P, Singh S, Khushu S. Neurodegenerative evidences during early onset of depression in CMS rats as detected by proton magnetic resonance spectroscopy at 7 T. Behav Brain Res. 2012;232:53–59. doi: 10.1016/j.bbr.2012.03.011. [DOI] [PubMed] [Google Scholar]
Associated Data
This section collects any data citations, data availability statements, or supplementary materials included in this article.