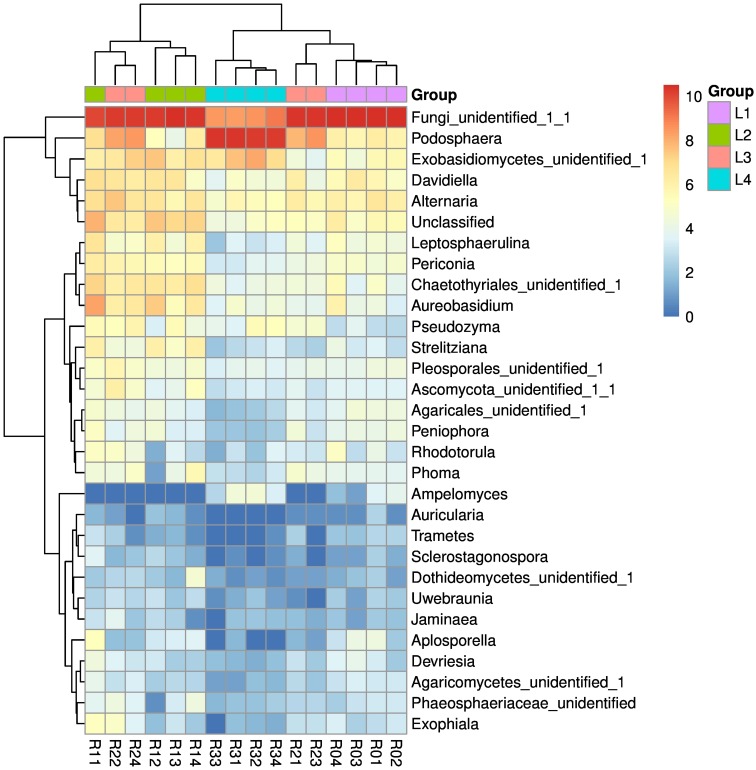
Figure 2. Heat map of the top 30 genera detected in all the samples.
R01–R04, four replicate samples of the L1 level, R11–R14, four replicate samples of the L2 level, R21–R24, four replicate samples of the L3 level, R31–R34, four replicate samples of the L2 level. Different colors represent different relative abundances, red represents the high relative abundance, and green represents the low relative abundance. L1, L2, L3, and L4 are expressed in purple, green, pink, and blue, respectively.

