Abstract
Objective
The study aims to explore long-term dietary effects on increases in body mass and fat depot enlargement through the recruitment of early in life labeled progenitor cells to the adipolineage.
Design and Methods
Neonate male C57BL/6J (B6) mice were injected intraperitoneally with BrdU. From 4 until 30 weeks of age they were fed either low fat diet (LFD) or high fat diet (HFD). BrdU-labeled cells were analyzed by flow cytometric and immunohistochemical assays after 10 days and 4, 8, 16 and 30 weeks.
Results
Mice fed HFD were heavier than mice fed LFD with the most dramatic disparity recorded between week 16 and 30. BrdU-bearing cells showed the decrease in the percentage content of labeled cells in inguinal (iWAT), epididymal (eWAT) and bone marrow (BM) tissues, regardless diets. However, iWAT collected from animals on HFD showed significant increase in labeled-cells at week 16th, which coincides with robust increase in inguinal but not epididymal fat weight between 16 and 30 weeks age.
Conclusions
Cells labeled with BrdU during neonate life of B6 mice persist in fat tissues for long period of time and are recruited to the adipocyte lineage in a favorable (obesogenic) environment in iWAT but not in eWAT.
Keywords: adipocytes, BrdU-labeling, diet, mice, progenitor cells
Introduction
Obesity is characterized by an excessive increase in adipose mass to store energy. The ability of adipose tissues to enlarge in response to an obesogenic environment is achieved by two processes: hypertrophy of existing adipocytes and hyperplasia via the generation of new adipocytes from a pool of adipocyte progenitors/stem cells. Some studies suggest that white adipose tissue (WAT) expansion during adulthood results from increased number of adipocytes [1–3] while others conclude that the pool of fat cells remains constant [4]. Moreover, it has been shown that there are differences in fat tissue expansion not only between inbred strains of mice, but also within an inbred strain and even among fat depots within the same individual. These differences in fat tissue expansion have effects not only on fat mass enlargement and subsequently on body weight, but on the physiological status of individual. In obese individuals, an increase in visceral fat depots, mainly by increases in adipocytes size (hypertrophy), has been associated with insulin resistance and elevated risk of type 2 diabetes [5]. On the contrary, an increase in subcutaneous fat depots is associated with improvement in insulin sensitivity [6]. Anatomical, morphological, physiological and developmental data suggest that subcutaneous and visceral fat depots are essentially two different, independent tissues [7]. This can imply that different precursor cells may give rise to subcutaneous and visceral fat depot. Indeed, in vitro data has shown that cells isolated from stromal-vascular fraction (SVF) of inguinal WAT (iWAT) have greater differentiation potential than those from epididymal WAT (eWAT) [8, 9]. In vivo and in vitro data have revealed that adipogenic progenitors are more abundant in subcutaneous depot than visceral fat [10]. The evidence for differences between fat depots has been strengthened by analysis of gene expression in humans [11] and mice [9, 12]. The differences observed in developmental gene expression between freshly isolated SVF from iWAT and eWAT persisted in in vitro cultures [11, 12].
The analyses of stem cells/progenitor cells in the development of adipose tissue through in vitro studies encounter challenges when applied to in vivo studies. The lack of defined markers for stem cells/progenitor cells has hindered in vivo studies. A goal of adipocyte biology is the identification of a marker(s) for adipogenic progenitors that facilitates the ability to tracking their morphological destinations during development. One method that currently is in use is based on the slow-cell cycling feature of stem cells [10, 13, 14]. Incorporation of [3H] thymidine or 5-bromo-2′-deoxyuridine (BrdU) into cellular DNA during early development allows for the detection of slow-cycling label-retaining cells in adult animals [13, 15]. One methods used to detected [3H]-or BrdU-marked cells in SVF of given tissues is based upon flow cytometry [10, 14]. This method has the potential not only to detect label-retaining cells (LRC) but, additionally, to characterize the immunophenotype of the labeled cells. Flow cytometry analysis has revealed that the stem cell/precursor cell population in the SVF of mice fat depots is Sca-1 positive [10, 14]. Our previous in vitro studies showed that Sca-1 positive cells isolated/sorted from either ear mesenchymal stem cells (EMSC) or SVF of fat depots displayed robust adipogenic potential [16, 17]. In contrast, our in vivo experiments showed only subtle metabolic disorders (glucose intolerance, insulin resistance) between Sca-1 KO and wild type mice [17]. We did not detect either a defect in adipogenic tissue development or an increase in fat mass content between Sca-1 KO and wild type mice in an obesogenic environment. We proposed that the lack of an in vivo phenotype may be explained by compensatory mechanisms that do not operate under in vitro conditions [17, 2]. Although the precise function of Sca-1 is currently unknown, changes in the population of Sca-1 positive cells were detected in the in vivo model. Immunologically challenged Balb/c mice robustly increased the Sca-1 positive population of bone marrow stem cells through Sca-1 positive cell proliferation and through inversion of Sca-1 negative to Sca-1 positive cells [18]. This observation may imply changes in Sca-1 positive population in of SVF of fat depot in obesogenic environment that is accompanied by an increase in inflammatory conditions [19].
Our present study extends previous investigations of in vivo adipose tissue growth [14, 17] by exploring the effect of long term dietary manipulation on the relation of fat depot enlargement to adipogenic progenitor recruitment to the adipolineage. We also tested whether an obesogenic environment caused changes in the population of Sca-1 positive cells in SVF of fat depots in physiological (wild type animals) conditions. The results showed that long term (26 weeks) high fat diet resulted in an increase in body weight secondary to an increase in fat mass content. This increase occurred between 12 and 26 weeks of diet and coincided with a robust development of the inguinal fat depot. Flow cytometric analysis of BrdU-labeled cells in SVF indicated that hyperplasia accounted for inguinal fat mass expansion after 12 weeks on high fat diet. The expansion of fat mass was accompanied by increased Sca-1 positive cell content in SVF of fat depots but not bone marrow.
Methods and Procedures
Animals, diet and treatments
The C57BL/6J (B6) mice were bred and housed in a temperature- and humidity-controlled room (22 ± 2°C and 30–70%, respectively) with a 12-h light/12-h dark cycle at the Pennington Biomedical Research Center, Baton Rouge, LA.
We used the BrdU labeling approach to label and then identify/quantify label retaining cells (LRC) in fat depots by flow cytometry and immunohistochemical assays. Male 3.5 days old B6 mice (n = 72) were injected intraperitoneally with BrdU at a concentration of 50 μg/g of body weight (Sigma Co. St. Louis, MO) twice daily, at 7.00 am and 6.00 pm for 3 consecutive days (total 7 injections). Control animals (n =48) were injected with saline. Chase periods for BrdU-labeled fat tissues were 10 days and 4, 8, 16 and 30 weeks.
After weaning (21 day of age), B6 mice were fed a standard low fat chow diet (LFD - LabDiet 5053, PMI, Brentwood, MO) until 4 weeks of age. Then, mice were randomized into two experimental groups: fed either standard low fat chow diet (LFD) or a high saturated fat diet (HFD - 58 kcal% fat w/sucrose; D12331; Research Diets, New Brunswick, NJ) maintained throughout the experiment. Animals were allowed ad libitum access to food and tap water. Body weight was measured once per week: from 4 until 30 weeks. At 8, 16 and 30 weeks of animal age, body composition was analyzed by nuclear magnetic resonance (NMR; Bruker, The Woodlands, TX). At the age of 10 days, 4, 8, 16 and 30 weeks selected mice were euthanized by CO2 asphyxiation followed by cervical dislocation. Inguinal (iWAT) and epididymal (eWAT) fat depots were dissected and weighed before FACS or histochemical analyses.
All experiments involving animals were reviewed and approved by the Pennington Biomedical Research Center Institutional Animal Care and Use Committee prior to implementation in accordance with NIH guidelines. All procedures were designed to minimize the suffering of experimental animals.
BrdU flow cytometry assay
The frequency of LRC cells were analyzed in the SVF of fat depots and bone marrow (BM) as described below. Epididymal and inguinal fat depots were collected, minced, and digested with collagenase type I (2 mg/ml; Worthington Biochemical Corp., Freehold, NJ). Bone marrow cells were collected from tibia and femurs. Cell isolates were suspended in red blood cell lysing buffer (Sigma Co. St. Louis, MO) to remove erythrocyte contamination before analysis by flow cytometry. Cells were first incubated with phycoerythrin (PE) conjugated anti-Sca-1 antibodies (BD Pharmingen San Diego, CA). Next the cells were fixed, treated with DNase to expose BrdU epitopes, and incubated with FITC-conjugated anti-BrdU antibodies following instruction of the manual (FITC BrdU Flow Kit BD Pharmingen San Diego, CA). The flow cytometry assay was performed using a FACScan flow cytometer (Becton Dickinson, San Jose, CA) and data were analyzed with a Macintosh G5 workstation (Apple Computer, Cupertino, CA), which contains Cellquest graphics software (Becton Dickinson, San Jose, CA) for data acquisition and analysis. Gates were always set using cells isolated from animals that received injections of saline instead of BrdU, but the samples were processed and stained alongside the experimental samples. The data were expressed as a percent of BrdU and Sca-1 positive cells per gated cells. FACS plots and data are representative of four separate experiments, each experiment consisting of a pool of cells collected from 2 animals.
Immunohistochemical analysis of BrdU labeled fat depot
Formalin-fixed inguinal and epididymal fat depots were embedded in paraffin and sectioned at 5 Qm. Dewaxed sections were treated with 1N HCl at room temperature for 10 min to denaturate DNA, then with 2N HCl at 37ºC for 20 min followed by incubation in 0.1M borate buffer. Primary anti-BrdU antibody (rat anti-mouse ab6326 Abcam) at a dilution of 1:400 was applied overnight at 4ºC.
Immunohistological detection of antibody binding was achieved with the ABC complex (Vectastain ABC kit, Vector Laboratories, Inc., Burlingame, CA). Two types of controls were performed: (a) the primary antibody was substituted with non-specific immunoglobulin G (IgG) during the procedure, and (b) fat depot sections from saline treated animals were subjected to BrdU detection. Samples were counterstained with hematoxylin. Sections were visualized with a Zeiss microscope (Axioskop 40) using Plan-Neofluor 10 × objective and photographed with a Kodak digital camera (DC290 Zoom). Quantitative analyses of adipocytes and immunopositive cells were made using Metamorph software. For LRC quantitation, adipocytes and BrdU positive cells were counted from 5-fields and the label-retaining cells expressed as a percentage of total adipocytes counted. The size of the cells was quantified using the public domain image-processing program ImageJ (National Institutes of Health, Bethesda, MD). The cells were measured in 5 randomly chosen fields. Results are expressed as mean ± SD pixel area per cell.
Statistical Analysis
Data were analyzed with Prism 5 (GraphPad Software, Inc., San Diego, CA) and expressed as mean ± SD. Student’s t-test was used to compare between two groups. A value of P < 0.05 was considered statistically significant.
Results
Diet
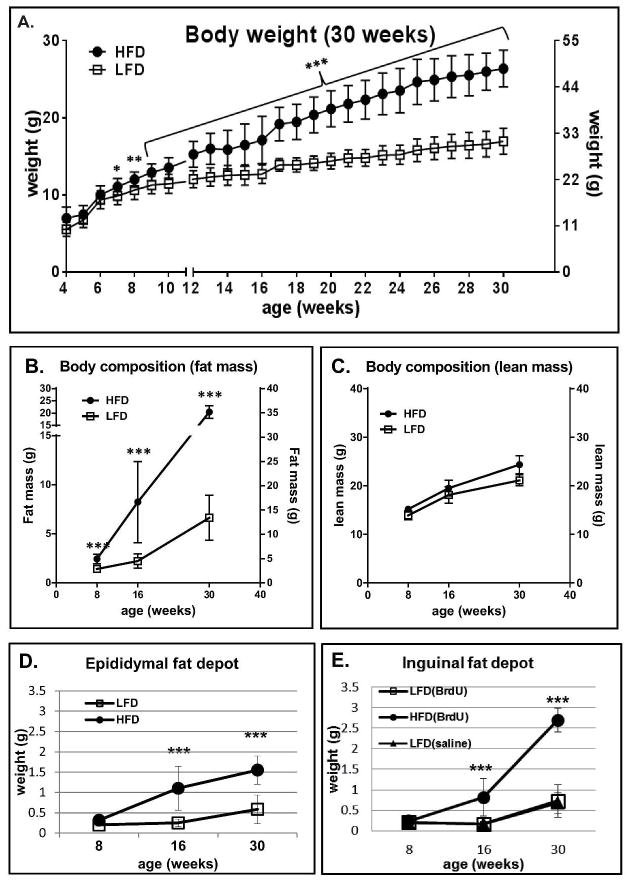
Over the course of the experiment mice fed high fat diet were heavier than mice fed chow diet (Fig. 1A). The differences in body weight gain between HFD and LFD fed animals reached statistical significance at week 7th (p<0.05), became more prominent at week 8th (p<0.01) and continued to increase (p<0.001) until the end of the experiment (week 30th). However the largest differences were recorded from week 16 until week 30. Mice on LFD gained 13.0g (±2.2) at weeks 4–16 and 7.6g (±4.0) at weeks 16–30, whereas HFD fed mice gained 19.4g (±4.9) weeks 4–16 and 15.7g (±6.6) weeks 16–30. The weight gain in BrdU-treated animals was indistinguishable from that of saline-treated controls (data not-shown) and matched the weight gain of B6 controls fed LFD and HFD, based on analyses from our previous experiment ([17].
Figure 1.
Effect of HFD vs LFD diet on body weight (A), fat mass by NMR (B), lean mass by NMR (C) and weight of the epididymal fat depot (D) and inguinal fat depot (E) of B6 mice. B6 mice were fed LF and HF diets beginning at 4 weeks of age. Body weight (n=9–13 animals per time point) was measured weekly until week 30 (A). Body composition was analyzed by nuclear magnetic resonance (NMR) at week: 8th, 16th and 30th (B and C). Fat depot weight was measured at 8, 16 and 30 weeks of age for BrdU-treated (D and E) and saline-treated (E) mice. At each time point (week 8th, 16th, and 30th) tissues were collected from n=6–8 animals. Data are mean ±SD; *p<0.05, **p<0.001, ***p<0.001 LFD vs HFD.
Body composition
At 8, 16 and 30 weeks of animal age, NMR was performed to assess body composition. Consistent with the body weight differences, NMR showed the expected increase in percentage body fat for mice fed HFD (Fig. 1 B). The statistically significant differences in body fat content between animals fed HF vs LF diet were observed at 8 weeks (p<0.01). The largest difference in fat mass content in HFD vs LFD mice were observed between week 16th and 30th, in agreement with the differences in body weight (compare Fig. 1 A). Whereas mice on LFD increased fat mass from 2.2g (±0.72) at week 16 to 6.6g (±2.3) at week 30th, HFD mice displayed 8.23g (±4.1) and 20.4g (±2.5) of fat content, respectively. Regardless of diet, all mice demonstrated an equivalent pattern of lean mass increase (Fig. 1C).
Fat depot
The differences in total body fat mass between HFD and LFD fed animals correlated with proportional differences in epididymal and inguinal fat depot weight (Fig. 1 D and E). Gradual increases in the epididymal fat depot weight were observed in HFD fed mice between 8 (0.31g±0.08), 16 (1.1g±0.53) and 30 (1.55g±0.34) weeks of age.. The increases in the inguinal fat depot weight in HFD animals between week 8th (0.23g±0.04) and 16th (0.81g±0.35) were similar to the epididymal depot (compare Fig. 1D and E) and more robust at 30th week (2.7g±0.28). The major differences in weight between the inguinal and epididymal fat depots were observed between 16 and 30 weeks. Whereas weight of the epididymal fat increased 1.4 times (from 1.1g to 1.5g) between 16 and 30 week, inguinal fat tripled (3.3 times increase) its weight during the same time (from 0.81g to 2.7g; Fig 1. E). The analysis of saline injected mice fed a LFD showed no differences in inguinal fat depot weight compared to LFD fed mice injected with BrdU (Fig. 1E).
Flow cytometric analysis of LRC (BrdU-labeled cells) frequency
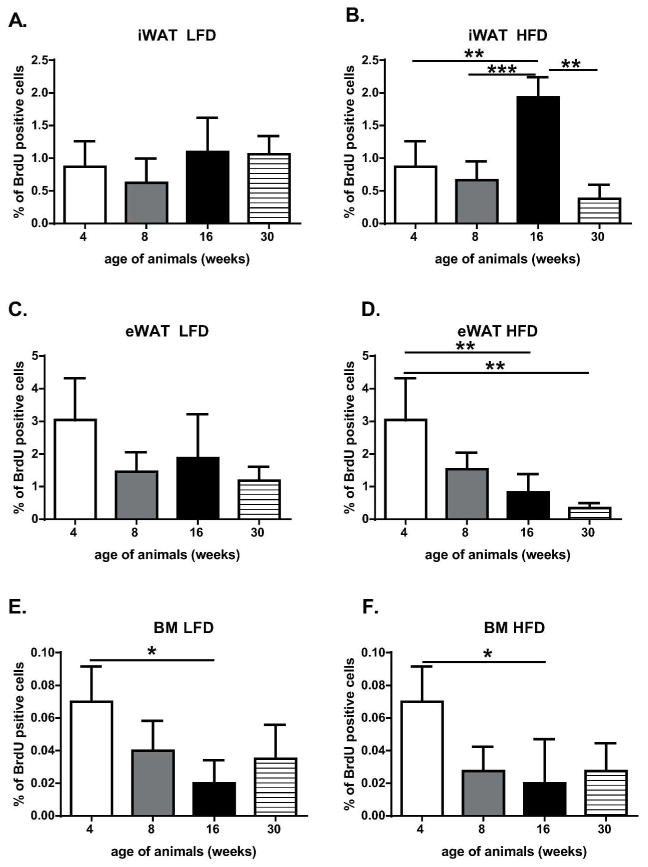
To quantify the adipose progenitor cells/stem cells within fat depots we used the BrdU labeling approach to label and then quantify LRC in fat depots as a function of developmental age (up to 30 weeks) and diet (LFD vs HFD) using flow cytometry detection methods. The method of BrdU detection in SVF of fat tissues was optimized previously in our laboratory [14]. To achieve the highest rate of BrdU cell labeling, 3.5 to 6 days old animals received 7 intraperitoneal injections of BrdU every 12 hours. The detection of SVF cells labeled by BrdU using flow cytometry was initially performed using 4 week old mice just before the animals were subjected to LF or HF diets (Fig. 2 and Fig. 3A). At 4 week the LRC represented 0.87% (±0.3) of the SVF of iWAT, 3.04% (±1.2) of eWAT and 0.07% (±0.02) of BM (Fig. 2, Table 1). Subsequent flow cytometry was performed on 8 week old animals that had been subjected for 4 weeks to HF or LF diets. Analysis of LRC showed decreases in the percentage content of LRC in iWAT (Fig. 3B and C), eWAT and BM SVF, regardless HFD vs LFD (Fig. 2, Table 1). The major decreases in the percentage of BrdU-labeled cells at 8 weeks were recorded for eWAT: 1.46% (±0.59) for LFD and 1.53% (±0.51) for HFD (Fig. 2C and 2D, Table 1).
Figure 2.
Quantitation of BrdU retaining cells from SVF of iWAT (A and B), eWAT (C and D) and BM (E and F) based on flow cytometric analysis. Panels A, C and E represent animals fed LFD, panels B, D and F animals on HFD. The data represent the mean of four experiments ±SD; each experiment consisted of a pool of cells from two animals; *p<0.05, **p<0.01, ***p<0.001.
Figure 3.
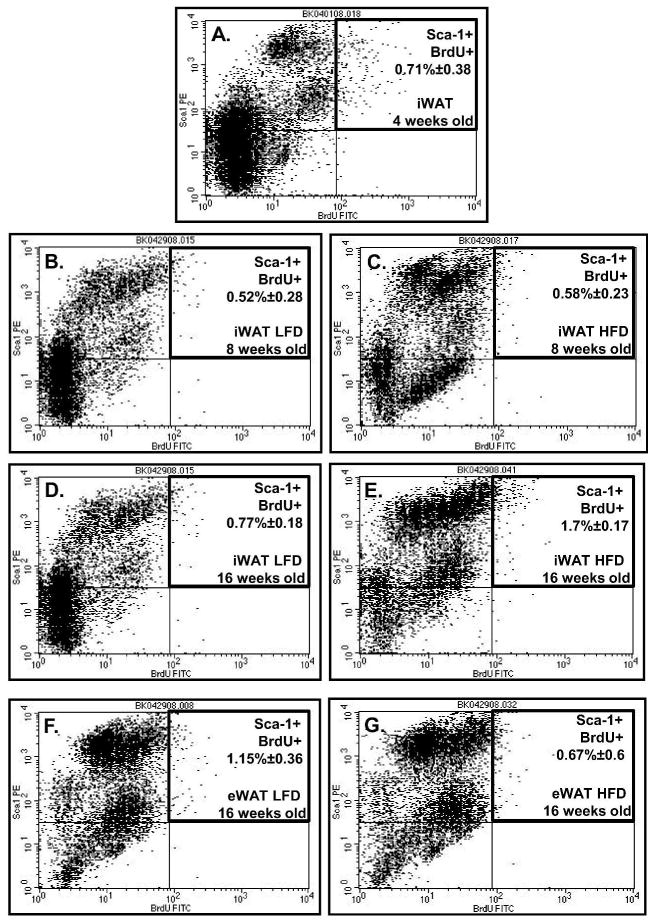
Flow cytometric analysis of cells from SVF of fat depot selected for BrdU retention and Sca-1 positive expression. Representative flow cytometric analysis of iWAT (A–E) and eWAT (F–G) collected from: 4 week old (A), 8 week old (B and C) and 16 week old (D, E and F, G) animals. Panel B, D and F represent data from LFD animals, panel C, E and G from HFD animals.
Table 1.
Estimation of the percentage of BrdU- and Sca-1 positive cells in stromal-vascular fraction of epididymal and inguinal fat tissues and bone marrow in respect to animals age and diets.
| EPIDYDYMAL FAT DEPOT | INGUINAL FAT DEPOT | BONE MARROW | % of cells stained by BrdU+Sca1 vs BrdU alone | |||||||||||||
|---|---|---|---|---|---|---|---|---|---|---|---|---|---|---|---|---|
| age | diet | % of BrdU | % of Sca1+BrdU | % of BrdU | % of Sca1+BrdU | % of BrdU | % of Sca1+Brdu | eWAT | iWAT | BM | ||||||
| 4 weeks | LFD | 3.04 | (±1.28) | 2.28 | (±1.05) | 0.87 | (±0.36) | 0.71 | (±0.38) | 0.07 | (±0.02) | 0.042 | (±0.02) | 75 | 81.6 | 60 |
| 8 weeks | LFD | 1.46 | (±0.59) | 1.3 | (±0.57) | 0.62 | (±0.34) | 0.52 | (±0.28) | 0.04 | (±0.01) | 0.025 | (±0.01) | 89.1 | 83.8 | 62.5 |
| 8 weeks | HFD | 1.53 | (±0.51) | 1.3 | (±0.37) | 0.66 | (±0.26) | 0.58 | (±0.23) | 0.02 | (±0.01) | 0.02 | (±0.01) | 84.9 | 87.9 | 100 |
| 16 weeks | LFD | 1.22 | (±0.39) | 1.15 | (±0.36) | 1.09 | (±0.26) | 0.77 | (±0.18) | 0.02 | (±0.01) | 0.01 | (±0.01) | 94.3 | 91.7 | 50 |
| 16 weeks | HFD | 0.69 | (±0.60) | 0.67 | (±0.60) | * ###1.93 | (±0.15) | * ###1.7 | (±0.17) | 0.01 | (±0.01) | 0 | (±0) | 97.1 | 94.4 | 0 |
| 30 weeks | LFD | 1.19 | (±0.21) | 1.16 | (±0.20) | 1.06 | (±0.14) | 0.98 | (±0.12) | 0.04 | (±0.01) | 0.025 | (±0.01) | 97.5 | 92.5 | 71.4 |
| 30 weeks | HFD | ** #0.35 | (±0.07) | ** #0.34 | (±0.07) | **0.38 | (±0.11) | **0.37 | (±0.11) | 0.03 | (±0.01) | 0.02 | (±0.01) | 97.1 | 97.4 | 74.1 |
Percentage of cells from SVF of epididymal (eWAT), inguinal (iWAT) and bone marrow (BM) that stained positive for: BrdU; BrdU+Sca-1; and BrdU+Sca-1 vs BrdU alone based on flow cytometric analysis. The data represents the mean of four experiments ±SD; each experiment consisted of a pool of cells from two animals;
p<0.05 LFD vs HFD at 16 weeks of age
p<0.01 LFD vs HFD at 30 weeks of age,
p<0.05 4 vs 30 weeks of age,
p<0.001 8 vs 16 weeks of age on HFD.
The frequency of BrdU-positive cells at week 16th revealed that SVF of iWAT collected from animals on HFD showed a significant increase in LRC (Fig. 2B and 3E, Table 1; p>0.001). The percentage of BrdU-labeled cells at 8 weeks was 0.66 (±0.24) vs 1.93 (±0.27) at 16 weeks (Fig. 2B, compare Fig. 3C and 3E). Although not statistically significant, an increase in BrdU-labeled iWAT was observed for animals on LFD: 0.62(±0.32) at 8 weeks and 1.0(±0.45) at 16 weeks (Fig. 2A, compare Fig. 3B and 3D). Cells either from BM (Fig. 2E and 2F) or eWAT (Fig. 2C and 2D; Fig. 3F and 3G) showed no differences in LCR content between 8 vs 16 weeks or a statistical significant decrease in the percentage of labeled cells. By 30 week BrdU-labeled cell content reached its lowest level (Fig. 2 B, C and D) or remained unchanged (Fig. 2A, E and F). The frequency of BrdU positive cells depended on diet as well (Table 1). HFD caused statistically significant increases in BrdU positive cells in the inguinal fat depot (p<0.05) but not in epididymal fat collected from animals at 16 weeks of age (Table 1). At age of 30 weeks both depots, inguinal and epididymal, showed a significant decrease in BrdU positive cells collected from animals fed HFD (p<0.01). Interestingly, double-label analyses determined that cells from SVF either iWAT, eWAT or BM that is positive for BrdU simultaneously expressed stem cell antigen-1 (Sca-1) (Fig. 3 and Table 1). Moreover, the double positivity increased with the developmental age of animals in SVF of fat tissues but not BM (Table 1).
Immunohistochemical analysis of BrdU labeled fat depots
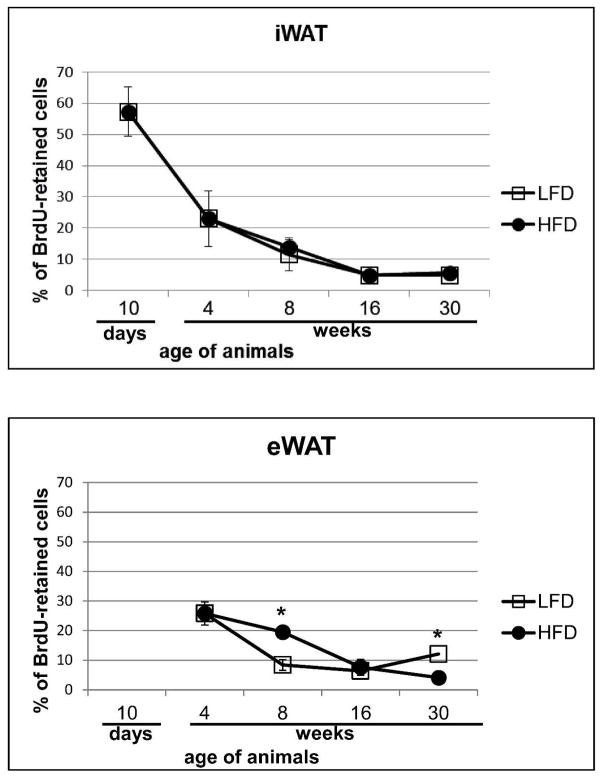
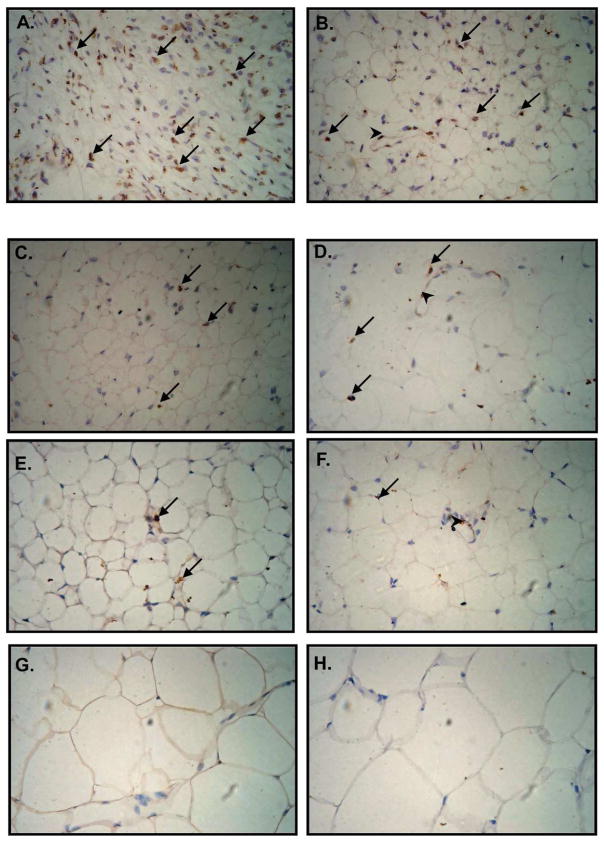
As an alternative approach, the number of BrdU-retaining cells in white fat depot was quantified on histological sections and values expressed as a percentage of the total number of adipocytes per field. The analysis of iWAT showed a high percentage of BrdU-labeled cells (57.2%±7.8%) at day 10 confirming the high efficiency of the BrdU-labeling procedure (Fig. 4A and 5A). Further analyses of immunohistochemically detected LRC in iWAT showed a developmental decrease in the percentage of labeled cells with no differences between HF vs LF diet: 23.04% (±8.8%) at 4 weeks, 11.5% (±5.2%) LFD and 13.8% (±2.4%) HFD at 8 weeks, 4.8% (±0.48%) LFD and 4.83% (±1.03%) HFD at 16 weeks to reach 4.85% (±0.92%) HFD and 5.62% (±0.87%) LFD at 30 weeks (Fig. 4A and Fig. 5).
Figure 4.
Quantification of BrdU-retaining cells in iWAT (A) and eWAT (B) on histological sections and expressing them as a percentage of the number of counted adipocytes. Data are mean ±SD; *p<0.05 LFD vs HFD.
Figure 5.
Immunohistochemical analysis of BrdU-retaining cells in iWAT. Neonate (3.5 – 6 day old) male B6 mice received 7 (every 12 hours) intraperitoneal BrdU injections. Tissues were collected from 10 day (A) and 4 week (B) old animals fed standard diet. Then tissues from mice fed low fat diet (LFD; C, E and G) or high fat diet (HFD; D, E and F) were collected at 8 (C, D), 16 (E, F) and 30 (G, H) weeks of age. BrdU-labeled nuclei localize to blood vessels walls (arrowheads) and spread among adipocytes (arrows). During immunohistochemical procedure sections were counterstained with hematoxyline to detect cells nuclei (blue color).
Epididymal WAT of 4 week old mice showed 25.79% (±6.4%) of BrdU-labeled cells (Fig. 4B). In general, the percentage of labeled cells decreased with increasing age: 8 weeks 8.4%±1.4% (LFD) and 19.4%±3.9% (HFD); 16 weeks 6.6%±1.7% (LFD) and 7.6%±1.7% (HFD); and 30 weeks 4.09%±2.7% (HFD) (Fig. 4B). In contrast, an increase in the percentage of LRC was detected at 30th week in animals fed LFD (12.08%±0.93%).
BrdU-labeled cells detected immunohistochemically were located both in close proximity to blood vessels (Fig. 5 B, D and F) and as individual cells scattered among mature adipocytes (Fig. 5 A–F).
Depot-specific effect of HFD on number and size of adipocytes
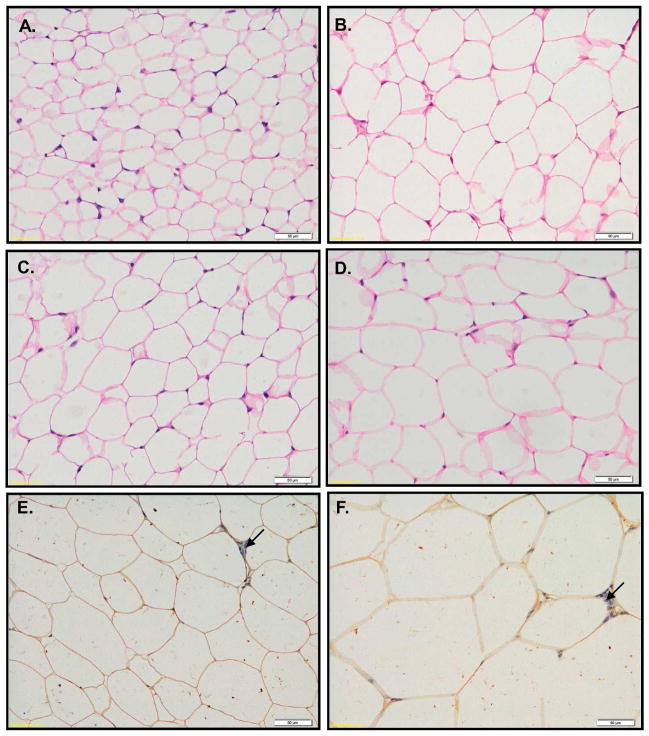
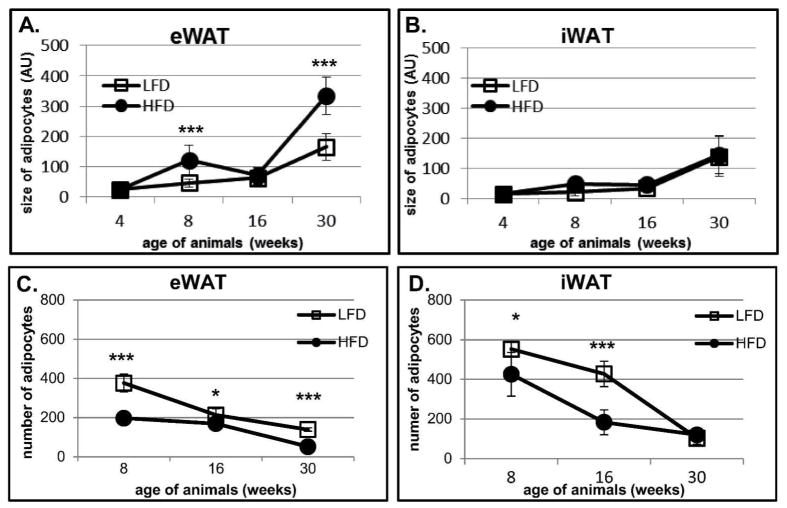
To evaluate how HFD and LFD effects fat depots, we analyzed the size and the number of adipocytes on histological sections collected from eWAT and iWAT (Fig. 5, 6, 7). HFD induced increases in adipocyte size in eWAT at 8 (p<0.001) and 30 (p<0.001) but not at 16 weeks of age (Fig. 6, 7A). The largest effect of HFD was detected at 30 weeks where the size of eWAT adipocytes doubled (p<0.001) in comparison to LFD animals (Fig. 6E–F, 7A). The increase in adipocyte size in eWAT correlated with a decrease in the number of adipocytes counted in a histological section, with larger effects in mice fed a HFD (Fig. 7A and 7C). It suggests that the increase in epididymal fat depot results from hypertrophy. The changes in adipocyte size in iWAT were modest (Fig. 5, 7B, 7D). Only a slight increase in iWAT adipocyte size was observed from 4 to 8 and from 8 to 16 weeks (Fig. 7B). Larger increases in iWAT adipocyte size were detected between week 16 and 30; however the size of adipocytes at 30 weeks was not as large as those measured in corresponding samples from eWAT (compare Fig. 7A and 7B). Interestingly, there were no differences in iWAT adipocyte size between animals fed LF or HF diets (Fig. 7B). The number of adipocytes quantified on iWAT histological sections was significantly lower in HFD animals at 8 and 16 weeks (Fig. 5, Fig. 7D). There were no differences in adipocyte number between HFD and LFD animals at 30 weeks of age (Fig. 5G and H, Fig. 7D), that is, when estimates are made from analysis of histological slide. However, when we factor in the large differences in inguinal fat depot weight (see Fig. 1E) and the BrdU evidence indicating increased proliferation (Fig. 2B, 3E Table 1), the depots itself must have more cells in mice fed a HFD than LFD. We conclude that the size of the inguinal fat depot is determined by adipocyte hyperplasia rather than hypertrophy.
Figure 6.
Histological analysis of eWAT collected from BrdU-treated B6 mice. Tissues were collected from 8 (A–B), 16 (C–D) and 30 (E–F) weeks old animals fed LFD (A, C, E) and HFD (B, D, F). Histological sections were stained with H&E (A–D) or immunostained for BrdU-detection (E–F). Immunohistolgical slices (E–F) were counterstained with hematoxyline to visualize cells nuclei (blue color – arrows).
Figure 7.
Quantification of adipocytes size (A–B) and adipocytes number (C–D) performed on histological sections from eWAT (A, C) and iWAT (B, D) collected from BrdU-treated animals. Fat depots from two animals (n=2) per time point and per diet were submitted to histological analyses. The size and the number of adipocytes were measured in 5 randomly chosen fields. Results are expressed as mean ± SD pixels per cell (A and B) and as mean ± SD number of adipocytes per field (*p<0.05, ***p<0.001).
Discussion
Our central finding is that after 12th weeks of HFD (which is equal 16th week of age), an increase in neonatally BrdU-labeled cells was observed in SVF of iWAT. This correlated with subsequent (between 16 and 30 weeks) increases in iWAT depot weight, fat mass content and an overall increase in body weight of the B6 mice. Additionally, the data showed that BrdU labeled SVF cells are Sca-1 positive regardless diet or source (eWAT, iWAT or BM). We determined that double positivity for Sca-1 and BrdU for SVF cells from iWAT and eWAT but not BM increased with the developmental age of animals. At 30 weeks of age almost all eWAT and iWAT SVF cells that are BrdU positive are simultaneously Sca-1 (97%) positive.
Several studies support the idea that different fat depots (ie.:eWAT vs iWAT) originate from distinct precursor cells. It has been shown that the chronological appearance of specific fat depots during development is different; for example, we found that iWAT proceeded eWAT appearance [14]. Microarray analysis of adipocyte precursor cells (SVF cells) from epididymal and inguinal fat depots of mice revealed depot-specific expression of genes involved in embryonic development and pattern specification [12]. Furthermore, in vitro studies have shown improved adipogenic differentiation capacity of subcutaneous as compared to visceral adipocyte precursors [7, 9]. Macotela et al., showed that stromal vascular cells from visceral fat depot which are poorly differentiated by a classical induction cocktail adipocyte can be induced to differentiate by addition of bone morphogenetic protein (BMP-2 or BMP-4; [9]).
The current data now provides in vivo evidence that the obesogenic environment differentially influences fat depot development. While long term HFD (12 weeks) stimulated recruitment of adipogenic precursors to adipocyte lineage in iWAT, this was not observed in eWAT. Similar observations have been made by others. Joe et al. [10] found that mature B6 mice submitted for 60 days to HFD and treated for last 10 days with BrdU showed increases in immunohistochemically detected BrdU adipocyte-associated nuclei primarily in the subcutenuous fat depot. Sakai et al., reported an increase in adipocytes size after 10 weeks of high fat diet; however an increase in adipocyte numbers was detected only after 26 weeks of high fat diet as measured by Coulter counter [3]. They concluded that an initial increase in adipocyte size (hypertrophy) preceded the increase in adipocyte number (hyperplasia). These data suggest that while fat tissue expansion in adulthood is initially achieved by hypertrophy, a long term obesogenic environment stimulates fat tissue hyperplasia. Moreover, fat tissue enlargement is depot specific with a hyperplastic mechanism characteristic for subcutaneous fat tissues. In contrast, the study by Macotela et al., showed that two weeks of high fat diet increased adipogenic progenitor cells in both fat depots with the strongest effects being found in subcutaneous fat depot (iWAT) of young B6 mice [9]. Our current study has shown that cells labeled (BrdU-marked) in neonate life at the time of fat depot formation persist in fat tissues for a long period of time and are capable of being recruited to the adipocyte lineage in favorable (obesogenic) environment.
It is accepted that excessive caloric intake can lead to the development of insulin resistance [20]. One of the hypotheses explaining this phenomenon is an inability of (subcutaneous) fat tissues to expand and store the excess of fat that has to be stored in nonadipose tissues [21]. Support for this hypothesis comes from studies of inbred murine strains. While B6 is a common mouse model used to study obesity, they do not develop severe insulin resistance despite weight gained after exposure to an obesogenic environment. It has been shown that genetic background B6 vs FVB influences the severity of insulin resistance, since B6 ob/ob mice display less insulin resistance relative to FVB ob/ob [22]. An independent study revealed that in spite of comparable degrees of obesity, 8 weeks of high fat diet feeding caused severe insulin resistance only in the AKR/J but not in the B6 strain [23]. Morphological analyses of the epididymal fat depot as well as cell number content and cell size showed no significant differences between AKR/J and B6 strains of mice. Rossmeisl and co-authors concluded that the data did not support the conclusion that differences in insulin sensitivity were determined by differences in adipocyte number [23]. Our long term feeding study (26 weeks of diet) showed that after at least 12 weeks of HFD iWAT but not eWAT significantly increased fat storage. Flow cytometric analyses indicate that it was achieved through the generation/recruitment of new adipocytes from a pool of precursor cells residing within iWAT. This data support the hypothesis that the ability to expand subcutaneous fat tissue allows for fat storage and protects against the development of insulin resistance. The discrepancy between Rossmeisl et al., and ourselves can be explained by differences in the length of the term feeding schedule (short vs long term) and methods of tissues analysis [23]. Additional supporting evidence for our conclusions comes from transplantation studies where introduction of subcutaneous fat depots into the visceral region of B6 mice had a beneficial effect on glucose and insulin levels. The observed effect was fat depot specific since transplantation of visceral (epididymal) fat into the visceral cavity had no effect on insulin and glucose levels or changes in body fat [24].
Other noteworthy observations made during our studies were that the percentage of BrdU and Sca-1 double positive cells in SVF increased with age of animals and that fat tissue enlargement occurred in fat depots but not within the BM niche. Although our previous in vivo analysis of the Sca-1 KO mice model indicated that the Sca-1 protein was not essential for obesity development, the present study shows that Sca-1 can serve as an indicator of fat tissue enlargement. Moreover, an increase in the Sca-1 positive cell population in the enlarged fat mass may reflect a link between the increase in fat content and the inflammatory response as it was shown in BM of immunologically challenged mice [18]. Consistent with this, in vivo and in vitro studies by Zhang et al. showed that the response to bacterial infection in general and to TNFα and INFγ in particular stimulated proliferation of Sca-1 positive hematopoietic precursor cells and inversion of Sca-1 negative to Sca-1 positive cells [18]. It is well established that adipose tissue during obesity develops an inflammatory milieu which ultimately leads to insulin resistance [19]. Obesity-associated insulin resistance has been associated with elevated levels of proinflammatory cytokines such as TNFα, INF-γ, IL-6, and IL-1β [19]. Our previous study showed that Sca-1-deficient but not Sca-1-positive (wild type) mice exhibited glucose intolerance and insulin resistance [17]. Present experiments showed the gradual increase in Sca-1 positive cells in SVF of enlarging fat depot in wild type mice. Whether Sca-1 positivity plays a protective role in the development of insulin resistance under an obesogenic environment will require further studies.
In summary, our results using cell labeling approaches and determination of surface immunophenotypes confirm and extend prior work associating the hyperplasia of stem and progenitor cells within subcutaneous adipose depots with mechanisms underlying the long term response to a high fat diet. Additional studies using transgenically labeled progenitor cells for fate mapping will be required to advance these questions in the future.
What is already known about this subject?
BrdU-marked adipocyte progenitors in adult mice undergo proliferation in an obesogenic environment.
Diet induced obesity in mice involves both hypertrophy and hyperplasia of adipocytes
Hyperphasia occurs late in the process of developing DIO (25 weeks)
What this studies adds?
First study to label DNA of progenitor cells in adipose tissue during the early post-natal period and quantify their retention during long-term development in adult mice fed a high fat or low fat diet
Hyperplasia preferentially occurs in subcutaneous fat depots
Demonstrated that following an initial increase in adipose mass by hypertrophy, a secondary response to an obesogenic environment is hyperplasia of label-retaining cell after 12 weeks of being fed a high fat diet.
Acknowledgments
The research in the Gawronska-Kozak laboratory has been partially supported by: National Institutes of Health; Grant 346 No. RO1 1 P20 RR021945 COBRE, the European Community’s Seventh Framework Programme REGPOT – 2010-1; Grant No. 264103 REFRESH and grant from Narodowe Centrum Nauki (NCN, Poland) DEC-2012/05/B/NZ5/01537.
Footnotes
Conflicts of interest
J.M.G. is the co-founder and CSO of LaCell, LLC, a for-profit biotechnology company focusing on the use of adipose-derived stromal/stem cells for tissue engineering and regenerative medical applications. All other authors declare no conflict of interest.
Authors’ contributions
B. Gawronska-Kozak: conception and design of the study; carried out the flow cytometry and immunohistochemical assays; acquisition, analysis and interpretation of data; writing and approving of the final version of the manuscript.
J. Staszkiewicz: carried out the in vivo experiment (BrdU-labelling, measurement of body weight and body composition), analysis of data; generation of figures, helped to draft the manuscript; approved the final version of the manuscript.
J. Gimble: analysis and interpretation of data; literature search, helped to draft and approve of the final version of the manuscript
H. Kirk-Ballard: carried out the in vivo experiment (measurement of body weight and body composition) and immunohistochemical analysis; generation of figures, helped to draft the manuscript; approved the final version of the manuscript.
References
- 1.Faust IM, Johnson PR, Stern JS, Hirsch J. Diet-induced adipocyte number increase in adult rats: a new model of obesity. Am J Physiol. 1978;235(3):E279–286. doi: 10.1152/ajpendo.1978.235.3.E279. [DOI] [PubMed] [Google Scholar]
- 2.Miller WH, Jr, Faust IM, Hirsch J. Demonstration of de novo production of adipocytes in adult rats by biochemical and radioautographic techniques. J Lipid Res. 1984;25(4):336–347. [PubMed] [Google Scholar]
- 3.Sakai T, Sakaue H, Nakamura T, Okada M, Matsuki Y, Watanabe E, Hiramatsu R, Nakayama K, Nakayama KI, Kasuga M. Skp2 controls adipocyte proliferation during the development of obesity. J Biol Chem. 2007;282(3):2038–2046. doi: 10.1074/jbc.M608144200. [DOI] [PubMed] [Google Scholar]
- 4.Spalding KL, Arner E, Westermark PO, Bernard S, Buchholz BA, Bergmann O, Blomqvist L, Hoffstedt J, Naslund E, Britton T, et al. Dynamics of fat cell turnover in humans. Nature. 2008;453(7196):783–787. doi: 10.1038/nature06902. [DOI] [PubMed] [Google Scholar]
- 5.Wang Y, Rimm EB, Stampfer MJ, Willett WC, Hu FB. Comparison of abdominal adiposity and overall obesity in predicting risk of type 2 diabetes among men. Am J Clin Nutr. 2005;81(3):555–563. doi: 10.1093/ajcn/81.3.555. [DOI] [PubMed] [Google Scholar]
- 6.Miyazaki Y, Mahankali A, Matsuda M, Mahankali S, Hardies J, Cusi K, Mandarino LJ, DeFronzo RA. Effect of pioglitazone on abdominal fat distribution and insulin sensitivity in type 2 diabetic patients. J Clin Endocrinol Metab. 2002;87(6):2784–2791. doi: 10.1210/jcem.87.6.8567. [DOI] [PubMed] [Google Scholar]
- 7.Gesta S, Tseng YH, Kahn CR. Developmental origin of fat: tracking obesity to its source. Cell. 2007;131(2):242–256. doi: 10.1016/j.cell.2007.10.004. [DOI] [PubMed] [Google Scholar]
- 8.Prunet-Marcassus B, Cousin B, Caton D, Andre M, Penicaud L, Casteilla L. From heterogeneity to plasticity in adipose tissues: site-specific differences. Exp Cell Res. 2006;312(6):727–736. doi: 10.1016/j.yexcr.2005.11.021. [DOI] [PubMed] [Google Scholar]
- 9.Macotela Y, Emanuelli B, Mori MA, Gesta S, Schulz TJ, Tseng Y-H, Kahn CR. Intrinsic differences in adipocyte precursor cells from different white fat depots. Diabetes. 2012;61(7):1691–1699. doi: 10.2337/db11-1753. [DOI] [PMC free article] [PubMed] [Google Scholar]
- 10.Joe AW, Yi L, Even Y, Vogl AW, Rossi FM. Depot-specific differences in adipogenic progenitor abundance and proliferative response to high-fat diet. Stem Cells. 2009;27(10):2563–2570. doi: 10.1002/stem.190. [DOI] [PubMed] [Google Scholar]
- 11.Tchkonia T, Lenburg M, Thomou T, Giorgadze N, Frampton G, Pirtskhalava T, Cartwright A, Cartwright M, Flanagan J, Karagiannides I, et al. Identification of depot-specific human fat cell progenitors through distinct expression profiles and developmental gene patterns. Am J Physiol Endocrinol Metab. 2007;292(1):E298–307. doi: 10.1152/ajpendo.00202.2006. [DOI] [PubMed] [Google Scholar]
- 12.Gesta S, Bluher M, Yamamoto Y, Norris AW, Berndt J, Kralisch S, Boucher J, Lewis C, Kahn CR. Evidence for a role of developmental genes in the origin of obesity and body fat distribution. Proc Natl Acad Sci U S A. 2006;103(17):6676–6681. doi: 10.1073/pnas.0601752103. [DOI] [PMC free article] [PubMed] [Google Scholar]
- 13.Chan RW, Gargett CE. Identification of label-retaining cells in mouse endometrium. Stem Cells. 2006;24(6):1529–1538. doi: 10.1634/stemcells.2005-0411. [DOI] [PubMed] [Google Scholar]
- 14.Staszkiewicz J, Gimble J, Cain C, Dietrich M, Burk D, Kirk-Ballard H, Gawronska-Kozak B. Flow cytometric and immunohistochemical detection of in vivo BrdU-labeled cells in mouse fat depots. Biochem Biophys Res Commun. 2009;378(3):539–544. doi: 10.1016/j.bbrc.2008.11.092. [DOI] [PMC free article] [PubMed] [Google Scholar]
- 15.Braun KM, Niemann C, Jensen UB, Sundberg JP, Silva-Vargas V, Watt FM. Manipulation of stem cell proliferation and lineage commitment: visualisation of label-retaining cells in wholemounts of mouse epidermis. Development. 2003;130(21):5241–5255. doi: 10.1242/dev.00703. [DOI] [PubMed] [Google Scholar]
- 16.Staszkiewicz J, Gimble J, Manuel JA, Gawronska-Kozak B. IFATS Series: Stem Cell Antigen-1 Positive Ear Mesenchymal Stem Cells (EMSC) Display Enhanced Adipogenic Potential. Stem Cells. 2008 doi: 10.1634/stemcells.2008-0270. [DOI] [PMC free article] [PubMed] [Google Scholar]
- 17.Staszkiewicz J, Gimble JM, Dietrich MA, Gawronska-Kozak B. Diet-induced obesity in stem cell antigen-1 KO mice. Stem Cells Dev. 2012;21(2):249–259. doi: 10.1089/scd.2010.0507. [DOI] [PMC free article] [PubMed] [Google Scholar]
- 18.Zhang P, Nelson S, Bagby GJ, Siggins R, 2nd, Shellito JE, Welsh DA. The lineage-c-Kit+Sca-1+ cell response to Escherichia coli bacteremia in Balb/c mice. Stem Cells. 2008;26(7):1778–1786. doi: 10.1634/stemcells.2007-1027. [DOI] [PMC free article] [PubMed] [Google Scholar]
- 19.Patel PS, Buras ED, Balasubramanyam A. The role of the immune system in obesity and insulin resistance. J Obes. 2013;2013:616193. doi: 10.1155/2013/616193. [DOI] [PMC free article] [PubMed] [Google Scholar]
- 20.Kim JY, van de Wall E, Laplante M, Azzara A, Trujillo ME, Hofmann SM, Schraw T, Durand JL, Li H, Li G, et al. Obesity-associated improvements in metabolic profile through expansion of adipose tissue. J Clin Invest. 2007;117(9):2621–2637. doi: 10.1172/JCI31021. [DOI] [PMC free article] [PubMed] [Google Scholar]
- 21.Danforth E., Jr Failure of adipocyte differentiation causes type II diabetes mellitus? Nat Genet. 2000;26(1):13. doi: 10.1038/79111. [DOI] [PubMed] [Google Scholar]
- 22.Haluzik M, Colombo C, Gavrilova O, Chua S, Wolf N, Chen M, Stannard B, Dietz KR, Le Roith D, Reitman ML. Genetic background (C57BL/6J versus FVB/N) strongly influences the severity of diabetes and insulin resistance in ob/ob mice. Endocrinology. 2004;145(7):3258–3264. doi: 10.1210/en.2004-0219. [DOI] [PubMed] [Google Scholar]
- 23.Rossmeisl M, Rim JS, Koza RA, Kozak LP. Variation in type 2 diabetes--related traits in mouse strains susceptible to diet-induced obesity. Diabetes. 2003;52(8):1958–1966. doi: 10.2337/diabetes.52.8.1958. [DOI] [PubMed] [Google Scholar]
- 24.Tran TT, Yamamoto Y, Gesta S, Kahn CR. Beneficial effects of subcutaneous fat transplantation on metabolism. Cell Metab. 2008;7(5):410–420. doi: 10.1016/j.cmet.2008.04.004. [DOI] [PMC free article] [PubMed] [Google Scholar]


