

Abstract
Myotonic dystrophy Type 1 (DM1) is a rare genetic disease caused by the expansion of CTG trinucleotide repeats ((CTG)exp) in the 3' untranslated region of the DMPK gene. The repeat transcripts sequester the RNA binding protein Muscleblind-like protein 1 (MBNL1) and hamper its normal function in pre-mRNA splicing. Overexpressing exogenous MBNL1 in the DM1 mouse model has been shown to rescue the splicing defects and reverse myotonia. Although a viable therapeutic strategy, pharmacological modulators of MBNL1 expression have not been identified. Here, we engineered a ZsGreen tag into the endogenous MBNL1 locus in HeLa cells and established a flow cytometry-based screening system to identify compounds that increase MBNL1 level. The initial screen of small molecule compound libraries identified more than thirty hits that increased MBNL1 expression greater than double the baseline levels. Further characterization of two hits revealed that the small molecule HDAC inhibitors, ISOX and vorinostat, increased MBNL1 expression in DM1 patient-derived fibroblasts and partially rescued the splicing defect caused by (CUG)exp repeats in these cells. These findings demonstrate the feasibility of this flow-based cytometry screen to identify both small molecule compounds and druggable targets for MBNL1 upregulation.
Introduction
Myotonic dystrophy (DM) is a genetic disorder that affects at least 1 in every 8,000 people worldwide and is the most common muscular dystrophy in adults (1,2). Patients suffer from multi-systemic symptoms including myotonia, muscle wasting, cardiac arrhythmia, dysphagia, cataracts, insulin resistance, sleep dysregulation, cognitive decline and premature death (3). Currently, there is no approved treatment. Genetically, there are two sub-types of DM. Type 1 (DM1) is caused by the CTG-trinucleotide repeat expansion ((CTG)exp) in the 3' untranslated region (UTR) of Dystrophia Myotonica Protein Kinase (DMPK) gene (4–7). Type 2 (DM2) is associated with a (CCTG)exp in intron 1 of Zinc Finger Nuclease 9 (ZNF9) (8). Both types are autosomal dominantly inherited with overlapping symptoms but different prevalence. DM1 is more common among patients with more severe symptoms and earlier onset (9,10). In vivo studies indicate that the toxic RNA gain-of-function is the main cause of DM1 rather than the DMPK loss of function (11,12). In affected cells, (CUG)exp transcripts sequester RNA-binding protein Muscleblind-like proteins (MBNL) into nuclear aggregates, up-regulate CUGBP and Elav-like family members (CELF), and further disrupts alternative splicing (13–16). These splicing perturbations have a physiological connection to DM symptoms and highlight their potential use as biological markers for both disease characterization and drug treatment. In particular, Sarcoplasmic/endoplasmic reticulum calcium ATPase 1 (SERCA1) protein is responsible for regulating calcium concentration in cells, and the splicing disruption of its transcript could contribute to muscle weakness (17–19). Furthermore, the exon 11 skipped insulin receptor (INSR) isoform has lower tyrosine kinase signaling capability which is implicated in the insulin resistance phenotype in DM1 (20). Although other mechanisms such as Repeat Associated Non-ATG Translation (RAN translation), microRNA deregulation and transcription misregulation are also involved in DM1 (21–23), the spliceopathy induced by MBNL1 sequestration and CELF upregulation is believed to be the primary mechanism of (CUG)exp RNA toxicity and the common cause of the multi-systemic symptoms.
MBNL proteins are a family of multifunctional RNA binding proteins that regulate precursor alternative splicing and polyadenylation, RNA stability, localization and microRNA biogenesis (24–30). In mammals, there are three highly conserved paralogues MBNL1, MBNL2 and MBNL3 (31). They share the structure similarity and recognize the common consensus sequences in both pre-mRNAs and (C(C)UG)exp transcripts (30–34). MBNL3 is primarily expressed in reproductive organs. MBNL1 and MBNL2 are ubiquitously expressed, while MBNL1 is highly abundant and plays major role in most tissues except brain where MBNL2 is predominantly expressed (35–37). The single- and compounded- loss of MBNL(s) in mouse models recapitulate many of the DM multi-systemic phenotypes including splicing disruptions (38–41). A splicing microarray analysis comparing splicing changes in MBNL1 knockout (Mbnl1Δ3/Δ3) mice to a DM1 mouse model (HSALR poly(CUG) mice) revealed that ∼80% of splicing pathology is MBNL1 dependent (42). Most of these splicing disruptions can be rescued by AAV-mediated MBNL1 overexpression in the HSALR mouse model along with the reversion of myotonia (43). Moreover, a transgenic MBNL1 mouse model using a ubiquitous promoter for constitutively high expression demonstrated that both early and long-term increase of MBNL1 levels are well-tolerated suggesting that this is a practical therapeutic strategy for DM1 treatment (44). Based on these evidence, we established a flow-based cytometry screen using a ZsGreen-MBNL1 reporter cell line monitoring the endogenous MBNL1 expression and its functional activity. Our initial findings demonstrate the feasibility of using this cell-based screening system to identify small molecule modulators and druggable targets for MBNL1 upregulation.
Results
Generation of ZsGreen-MBNL1 reporter cells to measure endogenous MBNL1 expression
Previous work demonstrated that modifying a MBNL1 transgene with an N-terminal GFP did not affect its splicing capability in murine adult skeletal tissue (43). Based on this evidence, we took advantage of the CRISPR/Cas9 gene-editing system to insert a ZsGreen fluorescent tag into the N-terminus of the MBNL1 coding sequence in HeLa cells. We selected HeLa cells to build the reporter system for the following three reasons: 1) as an alternative splicing regulator, the molecular mechanism of MBNL1 function is universal and has been studied in cancer cell lines (26); 2) HeLa cells express MBNL1 at a moderate level which sets a lower signal starting point and allows a signal increase to be measured; 3) HeLa cells are easy to engineer and compatible with most cell-based screening platforms at medium to high throughput.
To increase specificity of the insertion, the D10A double nickase strategy was used to generate two staggered cuts on DNA strands using two guide RNAs targeting sequences upstream and downstream of human MBNL1 exon 2 start codon and the ZsGreen-MBNL1 construct containing the donor sequences was co-transfected (Fig. 1A) (45). After integration, the cells expressing ZsGreen-MBNL1 fusion protein showed medium level green fluorescent signal accumulated in the nuclei (Supplementary Material, Fig. S1A). Flow cytometry quantification revealed a modest but distinguishable fluorescent signal from the non-fluorescent parental HeLa cells that were enriched following fluorescence-activated cell sorting (FACS) (Supplementary Material, Fig. S1B). Next, single cell clones were isolated via FACS and expanded to establish stable cell lines.
Figure 1.
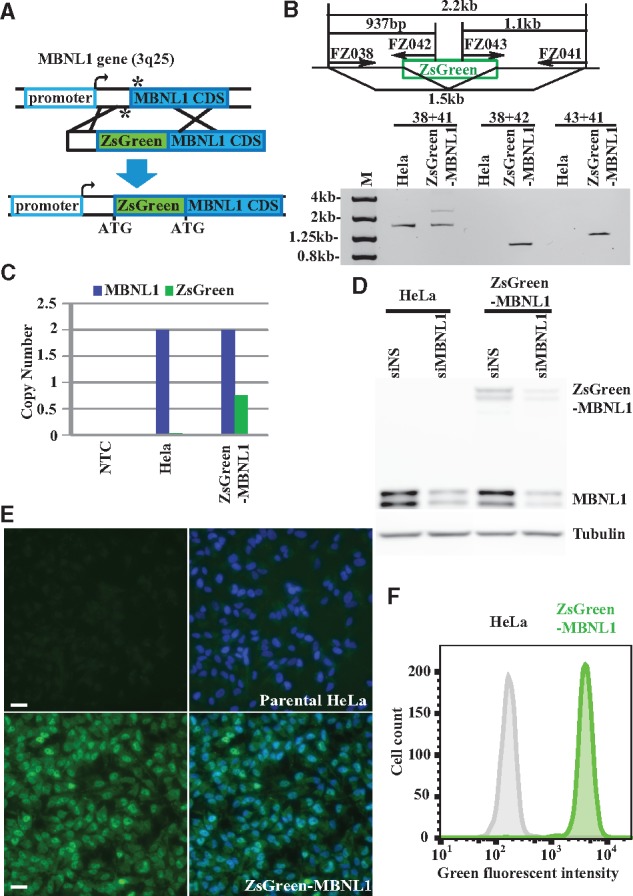
Site-specific integration of ZsGreen into endogenous MBNL1 locus generates ZsGreen-MBNL1 cells expressing green fluorescent fusion protein. (A) Schematic diagram of the strategy to insert a ZsGreen cassette into the MBNL1 locus (not to scale). The asterisks indicate the position of the single-strand breaks generated by Cas9 nickase/sgRNAs. The middle diagram shows the donor vector that contains the left and right homologous MBNL1 arms and the ZsGreen reporter. (B) ZsGreen integration in MBNL1 locus is confirmed by PCR followed by agarose gel analysis. Primer sets and PCR products are indicated in the upper diagram. (C) Droplet digital PCR (ddPCR) quantifying MBNL1 and ZsGreen copy number in no-template control (NTC), parental HeLa and ZsGreen-MBNL1 genomic DNA and plotted on the bar graph. (D) Immunoblotting shows MBNL1 and ZsGreen-MBNL1 protein expression in parental HeLa and ZsGreen-MBNL1 cells. MBNL1-silencing siRNA (siMBNL1) and non-silencing siRNA (siNS) control were used to demonstrate MBNL1 antibody specificity. Tubulin was used as a loading control. (E) Fluorescent microscopy images of parental HeLa and clonal ZsGreen-MBNL1 #27 using the same exposure. The green fluorescent images are on the left; the merged images of green and blue (DAPI staining) signal are on the right. Scale bar is 20 µm. (F) Flow cytometry quantification of green fluorescent signal in parental HeLa cells and ZsGreen-MBNL1 clone #27.
To confirm the site-specific integration, we isolated genomic DNA from both parental HeLa cells and colonized ZsGreen-MBNL1 cells followed by PCR amplification using primers spanning the insertion sites in MBNL1 gene and performed gel electrophoresis analysis. Both HeLa and ZsGreen-MBNL1 cells carried the unmodified MBNL1 allele indicated by the 1.5 kb fragment amplified by the primer set FZ038 and FZ041, while the ZsGreen-MBNL1 cells had an additional 2.2 kb fragment (Fig. 1B). Two fragments (0.9 kb and 1.1 kb) were detected in ZsGreen-MBNL1 cells but not in HeLa cells using ZsGreen specific primers (Fig. 1B). The sequences at the insertion junction were confirmed by Sanger sequencing. To test if this integration was unique to the MBNL1 gene, we used Droplet Digital PCR (ddPCR) to quantify the copy numbers of MBNL1 and ZsGreen in the genome of ZsGreen-MBNL1 cells. Both parental HeLa and ZsGreen-MBNL1 cells had two copies of MBNL1 while only ZsGreen-MBNL1 cells carried ZsGreen with its copy number close to one (Fig. 1C). Collectively, these data demonstrated that our CRISPR/Cas9 system uniquely integrated ZsGreen into one MBNL1 allele in HeLa cells. Several of the ZsGreen-MBNL1 expressing clones showed similar fluorescence and integration PCR results, so we decided to perform further characterization and screening on a single clone, #27.
To confirm our reporter cell line expressed the ZsGreen-MBNL1 fusion protein, we performed immunoblotting analysis using an antibody against MBNL1. Parental HeLa cells expressed the native MBNL1 (40–42 kDa), while the ZsGreen knock-in cells expressed both the wild type and ZsGreen-MBNL1 fusion proteins (65–67 kDa) with the total MBNL1 level equivalent to the parental HeLa cell. All MBNL1 forms were proportionally knocked down by a siRNA against MBNL1 (Fig. 1D). Fluorescent microscopy revealed a homogenous level of green fluorescent signal among ZsGreen-MBNL1 cells that was distinguishable from the minimal cell autofluorescence signal from the parental HeLa cells (Fig. 1E). Furthermore, we observed the enhanced nuclear accumulation of ZsGreen-MBNL1 which is consistent with endogenous MBNL1 functioning as a nuclear splicing factor. Flow cytometry analysis of ZsGreen-MBNL1 cells showed a narrow fluorescent signal peak, which is readily separated from the background signal in parental HeLa cells (Fig. 1F). The narrow width of the fluorescent signal provided a means to measure shifts indicating either increases or decreases in ZsGreen-MBNL1 expression.
(CUG)exp repeat transcripts sequester ZsGreen-MBNL1 in nuclear foci and disrupt splicing in reporter cells
In DM1, sequestration of MBNL1 protein from its splicing regulatory complexes by the disease-specific (CUG)exp repeats is followed by splicing disruption. This molecular disease mechanism has been reconstituted in multiple cell and animal models and provides important evidence for MBNL1 function in DM1. To determine whether the ZsGreen-MBNL1 fusion protein maintains the same functional properties as native MBNL1, we transfected the stable ZsGreen-MBNL1 line with constructs expressing (CUG)400 RNA and then detected the cellular localization of ZsGreen-MBNL1 and native MBNL1 by MBNL1 antibody staining. Both ZsGreen-MBNL1 and native MBNL1 showed diffuse nuclear distribution in mock-transfected cells. Following transfection with (CUG)400 RNA constructs, both MBNL1 forms co-localized in nuclear foci (Fig. 2A). Furthermore, the uniform nuclear background signals were significantly lower than the mock-transfected controls suggesting recruitment into foci (Fig. 2A). Detection of the (CUG)exp via in situ hybridization with fluorescently labeled probes revealed accumulation in nuclear foci and partial co-localization with ZsGreen-MBNL1 (Fig. 2B). These results demonstrated that our ZsGreen-MBNL1 reporter fusion protein has similar RNA-binding activity to native MBNL1. Alternative splicing of SERCA1 transcripts has been shown to be regulated by MBNL1, and SERCA1 exon 22 skipping increases when MBNL1 is sequestered by (CUG)exp repeats in DM1 cells (17,18). To examine the splicing pattern in our ZsGreen-MBNL1 cells, we quantified the spliced SERCA1 mRNA by RT-PCR using primers spanning exon 22. In mock-transfected cells, exon 22 was included in 86% of SERCA1 transcripts (Fig. 2C). However, in cells expressing the (CUG)400, the percentage of transcripts containing exon 22 decreased to 63% (Fig. 2C). These data gave us confidence that our ZsGreen-MBNL1 reporter system not only recapitulates the endogenous expression level of MBNL1 but also maintains its essential function as an RNA-binding splicing regulator.
Figure 2.

Reconstitution of the DM1 phenotype in ZsGreen-MBNL1 cells. Representative fluorescent images of ZsGreen-MBNL1 cells transfected with pcDNA-DMPK-(CTG)400 plasmid or no construct. (A) Localization of MBNL1 with labeled antibody (red) and ZsGreen-MBNL1 (green) at nuclear foci in (CUG)400 expressing cells. Scale bar is 2 µm. (B) Fluorescent in situ hybridization with probes against (CUG)exp repeats (red) show ZsGreen-MBNL1 (green) is partially co-localized with CAG-Cy3 labeled RNA foci. Nucleus was stained by DAPI (blue). Scale bar is 2 µm. (C) RT-PCR analysis to detect SERCA1 exon 22 alternative splicing in ZsGreen-MBNL1 cells transfected with no plasmid or plasmid expressing (CUG)400 RNA . Exon 22+ and exon 22− transcripts are shown in the diagram on the right with RT-PCR primer sets indicated by arrows. The band intensity was quantified by ImageJ and the percentage numbers of exon 22 inclusions are listed below. Biological triplicates of each treatment are indicated by 1, 2 and 3.
Flow cytometry-based screen identifies small molecule MBNL1 up-regulators
At the time we were developing the screening assay, a positive control tool compound, reported to increase MBNL1 levels, was not available. We hypothesized that epigenetic modulators may likely alter endogenous MBNL1 expression as these compounds control accessibility of the transcriptional machinery to genes and play an important role in gene transcription states (46,47). We initiated screening with a compound set that contains 61 epigenetic modulators covering 44 targets including regulators of histone methyltransferases, demethylases, acetyltransferases and deacetylases, chromodomain proteins, arginine deiminases, sirtuins and DNA methyltransferases and identified nine compounds that showed significant increases in ZsGreen signal (Supplementary Materials, Fig. S2A and Table S1). Seven of these compounds are HDAC inhibitors suggesting histone deacetylation plays an important role in MBNL1 regulation. Each positive compound was confirmed independently, and full dose response curves were generated up to 100 μM with an EC50 and maximum fold increase determined (Supplementary Material, Table S1). Using the dose response data, the HDAC inhibitor ISOX and vorinostat showed 2.0 and 1.8 times maximal increase of ZsGreen-MBNL1 signal compared with DMSO treated cells, respectively, with an EC50 calculated at 2.3 µM for ISOX and 2.9 µM for vorinostat (Fig. 3A and B). We chose ISOX as a positive control for our subsequent screens since it increased MBNL1 to a higher level with a lower EC50. Fluorescent microscopy image analysis of ISOX-treated ZsGreen-MBNL1 cells also showed a significant increase of nuclear ZsGreen signal in compound treated cells (Supplementary Material, Fig. S2B).
Figure 3.

Cell-based screen identifies small molecules that up-regulate MBNL1 expression. (A, B) Dose response in ZsGreen-MBNL1 cells following ISOX (A) and vorinostat (B) treatment. ZsGreen-MBNL1 and parental HeLa cells were treated with compound and the mean fluorescent intensity (MFI) of the cells was quantified by flow cytometry 48 h after treatment. MFIHeLa was subtracted from MFIZsGreen-MBNL1 and the resulting MFI relative to DMSO treatment is plotted. (C) Box plot of the ZsGreen-MBNL1 signal changes in CGL screen. Each compound was screened at 1 µM in replicates. The percentage increase of ZsGreen-MBNL1 after compound treatment was calculated as follows: (MFIcompound -MFIDMSO)/(MFIISOX -MFIDMSO)×100% and plotted on Y axis. The CGL compounds are divided into gene families (listed on X axis) based on each compound’s primary annotated target activity (at 500 nM or less). The black line in each box represents the mean MBNL1 percentage change; each box indicates the distribution of 50% of compounds around the mean; the whiskers indicate the next 25%, and the outliers are plotted as dots. (D) The percentage increase of ZsGreen-MBNL1 signal after the treatment of top 128 compounds. ZsGreen-MBNL1 and parental HeLa cells were treated with each compound at 1 μM followed by flow cytometry quantifications. The MFI increases were calculated by subtracting MFIHela from MFIZsGreen, and then the percentage increases were calculated and plotted to its primary targeting gene family. Each dot represents one compound. Negative control (0.1% DMSO) did not change MBNL levels (indicated as 0% baseline) and the positive control (5 μM ISOX) increased MBNL1 by 100% (indicated by the red line) on the plot C and D.
We miniaturized the assay to a 384-well plate format and adapted it to a robotic high-throughput flow cytometry screening platform which increased the output to ∼8000 compounds/day. Using this screening platform, we expanded the screen to two larger compound libraries, the Pfizer Chemogenomics Library (CGL) and the FDA-approved drug set. The CGL contains 2753 selective small molecules covering over 1000 biological targets. The CGL was created for phenotypic screening with the purpose of expediting target identification. A hit from this set suggests the annotated target(s) of that pharmacological agent may be involved in perturbing the observable phenotype. Multi-parameter optimization was used in the creation of the library to ensure appropriateness of molecules for cell-based screening (including assessments of permeability, solubility, cytotoxicity and selectivity). As CGL compounds were selected based on their potency against their primary annotated target at a concentration equal to or less than 500 nM, we decided to screen the library by treating ZsGreen-MBNL1 cells with 1 µM CGL compounds in duplicate. Since 5 µM ISOX treatment increased the ZsGreen signal close to 100% (Fig. 3A), the percentage change in ZsGreen-MBNL1 levels was calculated by comparing to ISOX treatment (ΔMFIcompound/ΔMFIISOX). To reveal trends, the entire CGL compound set activity was plotted as fold changes of MBNL1 versus 32 annotated primary targeting gene families (Fig. 3C). To remove false positives caused by compound auto-fluorescence, we tested these hits in the non-fluorescent parental HeLa cells, subtracted the treated MFIHela from treated MFIZsGreen and then calculated the percentage increase. A total of 128 positive compounds were identified based on signals that were three standard deviations above the signal of negative controls (Supplementary Material, Table S2). Among these, 24 compounds increased MBNL1 more than 100% (Supplementary Material, Table S2). We plotted the fold increases of the top 128 hits from the CGL screen with their primary targeted gene family indicated (Fig. 3D). Seventy of the top 128 hits targeted kinases with 12 compounds targeting aurora kinase B (AURKB) and cyclin-dependent kinase 2 (CDK2).
The FDA drug set contains 1040 small molecules and is a set of FDA-approved marketed and clinical stage compounds. Use of this compound set in screening may rapidly link an early phenotypic assay endpoint to human patient data and provide a direct path for testing in preclinical animal models. To explore all these possibilities, we screened this set of compounds at 10 µM in duplicates. After the compound fluorescence test in HeLa cells, 34 compounds remained positive with a hit rate of 4.7%. Ten compounds increased the ZsGreen-MBNL1 level more than 100% at 10 µM (Supplementary Material, Table S2). A subset of hits from the FDA drug set (12 compounds) was confirmed in ZsGreen reporter cells in a dose-response manner to determine the EC50 and maximum MBNL1 increase. Eleven compounds increased MBNL1 more than 100% and seven of these showed an EC50 in the single digit or below µM range and below (Table 1). Many of these compounds have been used as cancer, hematologic and dermatologic therapies (Table 1).
Table 1.
The top 12 hits from the FDA drug set screen with their EC50 and maximum percentage increase in MBNL1 over a negative control
| Compound Name | EC50 (µM) | Maximum Percentage Increase | FDA-approved Therapeutic Area |
|---|---|---|---|
| Mycophenolic acid | 1.3 | 119 | Antiarthritic drugs |
| Chlormethine | 1.9 | 158 | Lymphoma therapy |
| Melphalan | 4.0 | 150 | Cancer therapy |
| Cytarabine | 3.1 | 189 | Lymphoma therapy |
| Thiotepa | 12.2 | 159 | Hematologic agents |
| Monobenzone | 50.0 | 123 | Depigmenting agent |
| Bleomycin | 34.0 | 137 | Cancer therapy |
| Chlorambucil | 17.0 | 262 | Lymphoma therapy |
| Floxuridine | 0.001 | 164 | Cancer therapy |
| Mitomycin | 3.4 | 150 | Cancer therapy |
| Methylthioninium chloride | 3.2 | 120 | Alzheimer's dementia treatment |
| Triamcinolone Acetonide | 0.008 | 71 | Analgesic drugs |
DMSO (0.1%) and ISOX (5 µM) treatments were used as inter-plate negative and positive controls. The percentage increase in ZsGreen-MBNL1 levels were calculated by comparing to 5 µM ISOX treatment (100%) and 0.1% DMSO treatment (0%).
Since the CGL contains the original 61 epigenetic compounds from the pilot screen, we evaluated the reliability of our system by comparing the results from these two independent screens (initial 96-well format versus automated 384-well format). We re-identified 8 of the 9 epigenetic hits in the CGL screen performed at 10 µM. Two of the HDAC inhibitors showed a significant increase in ZsGreen-MBNL1 signal from the CGL 1 µM screen which is consistent with the fact that most of these compounds possess EC50s in the >1 µM range (Supplementary Material, Table S1). Box plot analysis revealed that the compounds targeting histone deacetylases showed a distribution shift toward MBNL1 up-regulation (Fig. 3C). These data suggested the high reproducibility of our screening system and highlight the regulation of MBNL1 expression by HDAC enzymes.
Small molecule HDAC inhibitors increase MBNL1 levels and reverse the splicing defect caused by (CUG)exp repeats
We further characterized two of the HDAC inhibitors identified in the pilot screen that increased ZsGreen-MBNL1 signal approximately two-times: vorinostat and ISOX. ISOX is reported to inhibit HDAC6 at low nM concentrations, but also inhibits HDAC1 and other HDACs at high nM concentrations. Vorinostat (suberoylanilide hydroxamic acid, SAHA) is a potent, reversible, pan-HDAC inhibitor (class I and class II HDACs) altering gene transcription and inducing cell cycle arrest and/or apoptosis in a wide variety of cells. Vorinostat was the first HDAC inhibitor approved by the FDA for treatment of cutaneous T cell lymphoma (CTCL) (48). To test whether vorinostat and ISOX can increase endogenous MBNL1 expression in DM1 cells, we treated normal and DM1 fibroblasts with vorinostat or ISOX for 2 days, then quantified the MBNL1 level by immunoblot using an antibody against MBNL1 (Fig. 4A). Following normalization to tubulin, both vorinostat and ISOX treatments increased MBNL1 levels in a statistically significant manner as compared with DMSO-treated controls in both normal and DM1 patient fibroblasts (Fig. 4B).
Figure 4.

Compound ISOX and vorinostat increase MBNL1 expression in DM1-patient-derived fibroblasts. (A) Immunoblot images of MBNL1 levels in DM1 patient-derived (top) and normal (bottom) fibroblasts after 5 μM ISOX or 5 μM vorinostat treatment for 2 days. Three biological replicates were generated for each treatment. Tubulin was used as a loading control. (B) MBNL1 levels from A were normalized to tubulin signal and plotted as a bar graph. Error bars show the standard deviation (SD) of the biological triplicates and statistic differences were characterized by a t test. *P ≤ 0.05; **P ≤ 0.01; ***P ≤ 0.001.
To test if vorinostat and ISOX treatment can rescue the splicing defect caused by DM1 repeats, we characterized SERCA1 exon 22 splicing in ZsGreen-MBNL1 cells transfected with (CUG)400 repeat expressing constructs. ISOX treatment increased the exon 22 inclusion in repeat-expressing cells from 66 to 70%, and vorinostat treatment significantly recovered the exon 22 inclusion to 78%, which is similar to the percentage of untreated cells without the overexpressed repeats (77%) (Supplementary Material, Fig. S3A and B). Interestingly, a similar splicing pattern shift (77–81% after ISOX treatment and 77–87% after vorinostat treatment) was observed in cells without the transfected repeats (Supplementary Material, Fig. S3A and B). To translate our findings to a more disease relevant model, we characterized the SERCA1 exon 22 and INSR exon 11 splicing in normal and DM1 patient-derived fibroblasts. These DM1 fibroblasts express DMPK transcripts containing ∼1000 CUG repeats. In normal fibroblasts, 87% of SERCA1 transcripts had exon 22 while only 58% of SERCA1 transcripts contained this exon in DM1 fibroblasts. Treatment of DM1 fibroblasts with either ISOX or vorinostat increased SERCA1 exon 22 inclusion from 58 to 76% and 74%, respectively (Fig. 5A and B). Likewise, exon 11 was included in 78% of normal fibroblast INSR transcripts versus 47% of DM1 patient fibroblast transcripts. ISOX and vorinostat treatment increased INSR exon 11 inclusions from 47 to 53% and 56%, respectively (Fig. 5A and C). In normal fibroblasts, ISOX and vorinostat treatment increase SERCA1 exon 22 inclusion to more than 96% and INSR exon 11 inclusions to more than 89%. All of the changes were statistically significant (Fig. 5B and C). This suggests that the compounds ISOX and vorinostat not only increased MBNL1 expression but also partially rescued the splicing pattern that is disrupted by sequestration of MBNL1 at repeat transcripts. These results confirm the utility of our screening system which helps provide confidence in future validation experiments for the targets identified in the CGL and FDA drug set screen.
Figure 5.

ISOX and vorinostat partially restore splicing pattern in DM1 patient-derived fibroblasts. (A) ISOX and vorinostat partially rescue mis-splicing of SERCA and INSR in patient-derived DM1 fibroblasts. Human normal fibroblasts (N) and DM1 fibroblasts (DM1) were treated with DMSO (0.1%), ISOX (5 µM) and vorinostat (5 µM) for 2 days. SERCA exon 22 and INSR exon 11 splicing were analyzed by RT-PCR followed by gel electrophoresis. The percentage of exon inclusion is shown below each RT-PCR product. Biological triplicates/replicates of each treatment are indicated by 1, 2 and 3. (B, C) ImageJ quantification of the percent SERCA exon 22 inclusion (B) and INSR exon 11 inclusion (C) from three biological repeats of DM1 fibroblasts and two biological replicates of normal fibroblasts. Error bars show the standard deviation of the biological triplicates/replicates and statistical differences were characterized by a t test. *P ≤ 0.05; **P ≤ 0.01; ***P ≤ 0.001.
As ISOX and vorinostat are generic HDAC inhibitors, in addition to increasing MBNL1 expression, they could directly affect SERCA1, INSR and DMPK transcription as well as directly affect toxic RNA nuclear aggregation. To evaluate these possibilities, we compared the steady state SERCA1, INSR and DMPK mRNA level in ISOX or vorinostat treated fibroblasts with control DMSO treated cells by RT-qPCR. In both normal and DM1 fibroblasts, no significant change of SERCA1, INSR and DMPK mRNA was observed after compound treatment with the exception of a small reduction of INSR mRNA in DM1 fibroblasts after ISOX treatment (Supplementary Material, Fig. S4). These data suggest that ISOX and vorinostat had no effect on SERCA1 and DMPK transcription. To test if ISOX and vorinostat changed toxic RNA nuclear aggregation, we quantified (CUG)exp foci in DM1 fibroblast nuclei by FISH staining. ISOX and vorinostat did not change either the average number or size of foci (Supplementary Material, Fig. S5A and B) while only slightly decreasing the signal intensity at the foci (Supplementary Material, Fig. S5C). Since the DMPK transcript level was not affected (Supplementary Material, Fig. S4C), it is possible that the slight reduction of signal intensity was caused by increasing the overall MBNL1 level in cells thereby blocking the probe accessibility at (CUG)exp foci. These results suggest that ISOX and vorinostat have a very minimal effect on the toxic transcripts and SERCA1/INSR transcription. MBNL1 upregulation is the main mechanism for splicing rescue.
Discussion
As a multi-systemic disease with complicated pathological mechanisms, DM is a challenge to treat. The toxic transcripts and MBNL ribonucleoprotein particle (RNP) aggregates are the common phenomenon in various tissues and both subtype of DMs (49–52). The disrupted splicing caused by MBNL1 sequestration plays central role in DM pathology. Most therapeutic strategies have been focused on degrading toxic (CUG)exp-RNA or disrupting (CUG)exp-RNP formation (53–59). So far, the most advanced therapeutic candidate for DM1 has been the antisense oligonucleotide (ASO) targeting the toxic repeat transcripts (55). Preclinically, small molecules have been identified which block the toxic RNA and MBNL protein interaction (60–62). A small molecule modality remains attractive for a number of reasons: safety with limited or no immune response, ease of administration and tissue delivery, CNS penetration and favorable manufacturing cost. MBNL1 upregulation is a valuable independent approach and can potentially be combined with RNA targeting strategies. Previous work from Kanadia et al. showed two-fold increase in MBNL1 levels by AAV-mediated MBNL1 overexpression is sufficient to reverse myotonia in a mouse model of DM1 (43). While preparing this manuscript, a study demonstrated that the non-steroidal anti-inflammatory drug (NSAID) phenylbutazone (PBZ) increased MBNL1 expression 1.3-fold both in vitro and in vivo to partially rescue aberrant splicing and decrease abnormal central nuclei in muscle fibers (63). These data suggest even a small increase of MBNL1 level can be beneficial to DM1 disease phenotypes. A transgenic MBNL1 mouse model using a ubiquitous promoter for constitutively high expression demonstrated that both early and long-term increase of MBNL1 levels are well-tolerated suggesting this therapeutic strategy is viable (44). Theoretically, this approach of MBNL1 up-regulation could provide two additional benefits in that: 1) solely increasing MBNL1 should not disrupt the (CUG)exp-MBNL aggregates which prevents the toxic transcripts from exiting the nucleus for RAN translation; 2) increasing MBNL1 levels could also functionally compensate for the loss of MBNL2 in CNS since MBNL family proteins are very similar in structure and may be functionally interchangeable (30).
To monitor the endogenous MBNL1 expression, we generated a reporter cell line expressing ZsGreen tagged MBNL1 protein from its native locus. The green fluorescent signal from the fusion protein represents the level of endogenous MBNL1 in cells. Importantly, the ZsGreen-MBNL1 fusion protein functions as the wild type MBNL1 in binding to (CUG)exp transcripts and forming nuclear aggregates. Therefore, we envision that this reporter cell line could also be used to monitor the nuclear foci formation and identify compounds or targets that disrupt foci or block repeat binding, or to track MBNL1 localization in cells or to dissect the RNP complex by performing pull- down experiments.
To identify novel MBNL1 modulators, we developed a cell-based phenotypic screen approach using the ZsGreen-MBNL1 reporter cells. Phenotypic screens do not rely on prior knowledge of a molecular mechanism and have the potential to uncover previously unknown mechanisms of disease state modulation. A cell-based screen has the advantage of analyzing responses to compound treatment in a more physiologically-relevant system than cell-free system. This reporter cell system showed a low variation in the observed fluorescent signal from the ZsGreen tagged endogenous MBNL1 proteins. Although high-content imaging is also compatible with the fluorescent signal quantification of these reporter cells, flow cytometry quantification provided a quick and sensitive way to reliably measure a modest 30% significant increase in whole cell MBNL levels. Miniaturization of the cellular system to a 384-well format was successful with ∼90% reproducibility of initial format. Importantly, we confirmed two of the hits (ISOX and vorinostat) increased endogenous MBNL1 levels in DM1 patient-derived fibroblasts and partially rescued the aberrant splicing. The HDAC inhibitors did not change the DMPK transcript level, which could alter the amounts of sequestered MBNL1, nor did these compounds affect the steady state of the SERCA1 and INSR mRNA transcripts. Furthermore, there was no change in the number and size of nuclear foci in compound treated DM1 cells except for a slight decrease of intensity. Collectively, these data suggest these compounds had a minimal effect on toxic RNA aggregates. These results demonstrated that our medium throughput-screening platform is highly reliable with the required sensitivity to detect modest increases in MBNL1 levels that translate to modulating the pathological phenotype of DM1 patient cells.
The identification of several HDAC inhibitors that increased MBNL1 suggests a regulatory role of HDACs in MBNL1 expression. However, we recognize that the observed activity at the effective concentration ∼1 μM was probably due to inhibition of multiple HDAC family members rather than one sub-type. Furthermore, global inhibition of HDAC activity has a complicated effect on gene transcription which can lead to cell cycle arrest, DNA repair inhibition, apoptosis induction and non-histone protein acetylation; all of these events can lead to downstream alterations in gene expression (64). While we noticed a cell growth inhibition by ISOX and vorinostat in our ZsGreen-MBNL1 reporter HeLa cells, there was a minimal toxic effect on the slower dividing DM1 fibroblasts (data not shown) and the MBNL1 increase was still observed. It is also possible that ISOX and vorinostat may increase MBNL1 level through mechanisms other than inhibiting HDACs.
To reveal additional regulatory pathways, we expanded the screen to two expanded compound libraries (CGL and an FDA drug set) and identified 160 small molecule hits of which 34 compounds increased MBNL1 more than 100%. Although preliminary, the CGL screen identified putative regulative pathways for MBNL1 expression including the kinase family proteins AURKB and CDK2. Interestingly, previous reports have shown that the CDK inhibitors C16 and C51 can reduce nuclear (CUG)exp aggregation and reverse mis-splicing in DM1 (65). In addition, a selective PDE10 inhibitor increased MBNL1 levels close to 2 fold in the ZsGreen reporter cells suggesting this phosphodiesterase may modulate MBNL1 expression. These pilot screens have suggested several novel regulatory mechanisms of MBNL1 expression with the goal of modulating MBNL1 sufficiently to ameliorate DM1 pathology. With the potential of expanding to the larger compound library and/or knockdown screens, it enables future detailed mechanism studies of MBNL1 expression and possible new therapeutic avenues for DM.
Materials and Methods
Generation of CRISPR knock-in constructs
The two CRISPR gRNA sequences (5’-GCAGCCATGTTTAGATTTTAC and 5’-GCACCAATTCGGGACACAAAA) 11bp upstream and 13bp downstream of MBNL1 start codon were synthesized and cloned into Cas9 nickase vector pZGB-RNG5_D10A (ZGENEBIO) to produce pZGB-D10A-MBNL1-Lg and pZGB-D10A-MBNL1-Rg constructs.pUC19-ZsGreen-MBNL1 knock-in constructs were generated by infusion-cloning 3 fragments together. The ZsGreen sequences were amplified from pZsGreen1-1 Vector (Clontech, 632473) using PCR primers (forward: 5’-CTGTAAAATCTAAACATGGCCCAGTCCAAGCAC; reverse: 5’-CATACCAGAACCACCGGGCAAGGCGGAGCC) and CloneAMP HiFi PCR Premix (Clontech, 639298). The genomic sequences spanning translation start codon of human MBNL1 (chr3:152299748∼152300851) were synthesized as two DNA fragments (chr3:152299748∼152300190 and chr3:152300194∼152300851). The three fragments were cloned into pUC19 vector using In-Fusion HD Cloning Kit (Clontech, 638909) following manufacturer’s instructions. ZsGreen was assembled in-frame with MBNL1 before the ATG start codon and flanked by 454bp upstream and 658bp downstream.
Cell culture and stable cell line generation
All cells were maintained at 37 °C with 5% CO2. HeLa cells (ATCC, CCL-2) were cultured in DMEM growth media (Gibco, 10569-010) with 10% fetal bovine serum (FBS) (Sigma, F2442) and 20 mM HEPES (Gibco, 15630-080). pZGB-D10A-MBNL1-Lg (1 µg), pZGB-D10A-MBNL1-Rg (1 µg) and pUC19-ZsGreen-MBNL1 (3 µg) were co-transfected into 3 × 10⁵ HeLa cells in 6-well plate using Lipofectamine® 2000 Transfection Reagent (Thermo Fisher Scientific, 11668019) as per manufacturer’s instructions. Forty-eight hours post-transfection, cells were expanded and harvested using 0.05% Trypsin (Invitrogen, 25300-054) and growth media. Dissociated cells were resuspended at 3x10⁶ cells/ml in sorting buffer which consisted of DPBS (Invitrogen, 14190-144) with 2% FBS (Invitrogen, 16140-071), 20 μg/ml of gentamicin (Invitrogen, 15710-064), and 2 μg/ml of propidium iodide (Invitrogen, P1304MP). A BD SORP Aria II (Becton Dickinson) and an 85 micron nozzle were used for the cell sorts. Cells were first gated through a forward side scatter gate to exclude aggregates followed by a side scatter select a population of events apart from background and debris. A third gate using the 561 laser and 582/15 detector served as the live/dead gate. Next, a marker was established with the parental line using the 488 laser with a 530/30 FITC detector to detect and sort ZsGreen positive cells on a log scale histogram. Sorted pools were grown in culture, and efficiency of the sort was measured on the expanded culture. The presorted ZsGreen had a 2.2% positive population and was enriched to an 86.1% positive population.
Human normal fibroblasts GM00321 (CTG)5 and DM1 fibroblasts GM04033 (CTG)1000 were purchased from the Coriell Institute for Medical Research and maintained in MEM growth media (Sigma, M-5650) supplemented with 15% (GM00321) and 20% (GM04033) FBS (Sigma, F2442), 2 mM L-Glutamine (Gibco, 25030-149) and 1X Penicillin-Streptomycin (Gibco, 15140122).
(CUG)exp expression constructs cloning, transfection and siRNA knockdown
To create constructs expressing DMPK 3’ transcripts with (CUG)5, the genomic fragment containing DMPK exons 11-15 and polyA tail were cloned as two parts into expression vector pcDNA3.1+. First, the DNA fragment of DMPK 3’UTR-polyA (chr19:45769413∼45770204) were synthesized flanked by a modified 5’ linker sequences (GAATTCGTTGAAGAC-(CTG)5-CGAGACCGACCTCGAG) and the 3’ XbaI site, and then inserted between EcoRI and XbaI sites in pcDNA3.1+. Then, DMPK exons 11-15 (chr19:45770266∼45771891) were PCR amplified by the primers 5’-AAAGGTACCAGGCTGAGGCCGAGGTG-3’ and 5’-AAAGAATTCATTCCCGGCTACAAGGACCCTTC-3’ and cloned between KpnI and EcoRI sites downstream of the CMV promotor to generate pcDNA-DMPK-(CTG)5.
Two DNA oligos (5’-/5Phos/GAAGAC(CTG)62C-3’, 5’-/5Phos/GGTCTCG(CAG)62-3’) were synthesized and annealed to generate the (CTG)60 repeat, then blunt ended and ligated into the blunt cloning site in pSMART HCKan (Lucigen, AF532107). pHC-(CTG)200 were generated by sequential dimerization reactions using pHC-(CTG)60 (66). The uninterrupted (CTG)200 repeat were digested by EcoRI and subcloned into construct pcDNA-DMPK-(CTG)5. Two tandem insertions of (CTG)200 were identified and plasmids pcDNA-DMPK-(CTG)400 were selected with repeat tracts orientated so that the leading strand encoded CTG repeats.
pcDNA-DMPK-(CTG)400 (1 µg) was transfected into ZsGreen-MBNL1 HeLa cells using Lipofectamine® 2000 Transfection Reagent (Thermo Fisher Scientific, 11668019) as per manufacturer’s instructions.
ON-TARGET plus MBNL1 siRNA (Thermo Scientific, #L-006426-00-0005) and ON-TARGET plus Non-targeting Control siRNA (Thermo Scientific, # D-001810-10-05) were transfected into cells using Lipofectamine® RNAiMAX (Invitrogen, 13778-075) as per manufacturer’s instructions.
PCR and ddPCR validate ZsGreen integration
Genomic DNAs were isolated from colonized cells using QIAamp blood DNA mini kit (Qiagen, 51104). 100 ng gDNA was used as a template for the PCR amplification with Herculase II Fusion DNA Polymerases (Agilent Genomics, 600675) and the following primers: FZ038, 5’-TCTGCCAGGAAATCAAGGAG; FZ042, 5’-ACGCCGTAGAACTTGGACTC; FZ043, 5’-ACACCGTGTACAAGGCCAAG; FZ041, 5’-TGGTGCCCACAAAAGCTAAC. PCR amplification was performed as follows: 95 °C for 2 min; 20 cycles of 95 °C for 20 s, 65∼55 °C (decrease 0.5 °C every cycle) for 20 s, 72 °C for 30 s; followed by 10 cycles of 98 °C for 20 s, 55 °C for 20 s, 72 °C for 30 s; and final extension at 72 °C for 3 min. The PCR products were analyzed by electrophoresis with 1.2% agarose gels.
Droplet Digital PCR was performed using 25 ng gDNA, primers (MBNL1-f: 5’-TGCATGCACAGTCATTTTTG, MBNL1-r: 5’-GCTTGGCACATTCATCTCTG, ZsGreen-f: 5’- ACACCGTGTACAAGGCCAAG and ZsGreen-r: 5’-GTCAGGTGCCACTTCTGGTT),
QX200 ddPCR EvaGreen Supermix (Bio-Rad, 1864033) and QX200 Droplet Digital PCR System (Bio-Rad, 1864001) were performed as per manufacturer’s instructions. Data was analyzed for relative gene copy numbers by QuantaSoft Software.
Small molecule libraries
A total of three compound libraries were generated and screened. The Epigenetic Modulators Library contains 61 small molecules that target a series of epigenetic modulators. The Chemogenomic Library (CGL) consisted of 2753 small molecule pharmacological compounds that cover over 1000 biological targets. The FDA-approved Drug Set consists of 1040 drugs approved for human or animal use by the United States Food and Drug Administration (FDA).
Compound treatment
Cells were aliquot into multi-well plate and cultured at 37 °C with 5% CO2 overnight. Small molecule compounds were dissolved in DMSO to generate a 1000× stock and then diluted with the growth media to the final concentration. Cells were incubated with the compound containing media for 2 days. DMSO was used as the negative control in each plate. The Epigenetic Modulators Libraries were screened in 96-well plate format at three concentrations (10 μM, 1 μM and 100 nM). CGL was screened at 1 μM and FDA-Drug Set was screened at 10 μM in 384-well plate format, and each compound was screened in duplicate. ISOX (5 μM) was used as the inter-plate positive control. Secondary validation screens were performed over an 11-point dilution range with a half-log dilution from 10 μM to 100 pM.
Fluorescent flow cytometry analysis of cells
Cells in 384-well plate were washed with 50 µl Dulbecco's Phosphate Buffered Saline (DPBS) (Life Technologies, 14190-144) twice and incubated with 20 µl 0.25% Trypsin-EDTA solution (Life Technologies, 25200-056) at 37 °C for 4 min and then quenched with DMEM growth media with 10% FBS. Cells were pelleted at 300 × g for 5 min, washed with 50 µl DPBS and then fixed with 50 μl 2% paraformaldehyde (Ted Pella, 18505) in DPBS at room temperature for 10 min, washed with 50 µl DPBS and re-suspended in 10 μl Alignflow beads solution (Life Technologies, A-16501, 25 drop/100 ml DPBS). The liquid handling was performed by Biomek FX Workstation (Beckman Coulter). The green fluorescent signal of the cells and the cell count of each sample were collected by HTFC Screening System (Intellicyt) or MACSQuant Analyzer 10 (Miltenyi Biotec). Cells were first gated through a forward and side scatter gate to select for viable and single cell events. The 640 laser and 675/30 detector served to detect signal from Alignflow beads for well identification. The 488 laser with a 530/30 detector were used to collect ZsGreen signal. Data were acquired and analyzed by using ForeCyt and FlowJo flow cytometry analysis software. The number of events was recorded as cell count. The signals were plotted in log histogram and MFI were determined.
Immunoblotting
Total cell extracts were prepared by lysing cells in RIPA buffer (Thermo Fisher Scientific, 89900) with 1× Protease Inhibitor Cocktail (Cell Signaling Technology, 5871) and 1 mM PMSF (Thermo Fisher Scientific, 36978). Total proteins were quantified by Pierce BCA Protein Assay Kit (Thermo Fisher Scientific, 23225) as per manufacturer’s instructions. Protein samples (8–10 µg per lane) were subjected to SDS-PAGE using NuPAGE Novex Bis-Tris 4–12% gradient precast gels (Life Technologies, NP0321BOX), and subsequently transferred onto 0.45 µm nitrocellulose membrane (Invitrogen), as per manufacturer’s instructions. After incubation at room temperature with Odyssey Blocking Buffer (TBS) (Licor, 927-50000) for 1 h, membranes were incubated with MBNL1 antibodies (Millipore, MABE70, 1:10,000) and Tubulin antibodies (Abcam, ab6046, 1:2000) in blocking buffer supplemented with 0.1% Tween-20 (Sigma) at 4 °C overnight. Following washing in TBST (Sigma), membranes were incubated with secondary antibodies conjugated with IRDye800CW (Licor, 926-32210) or IRDye680RD (Licor, 926-68070) for 1 h at room temperature (1:20,000 dilution in blocking buffer with 0.1% Tween-20), washed again with TBST and quantified using a Licor Odyssey infrared imaging system. Quantified protein levels are expressed as average ± SEM.
In situ hybridization
Cells were grown on 20 mm glass coverslips in 6-well plates, washed with 1× PBS/5 mM MgCl2 and fixed with 4% paraformaldehyde with 5 mM MgCl2 and 1× PBS for 12 min at room temperature. The fixed cells were rinsed with 70% ethanol for three times and store in 70% ethanol at 4 °C overnight. Then, the cells were washed with 1× PBS/5 mM MgCl2 for 10 min rocking at room temperature and permeabilized by treatment with ice-cold acetone (Fisher Scientific) for 20 min. After washing with 1 × PBS/5 mM MgCl2 for 10 min at room temperature on a rocker, the cells were pre-hybridized in pre-warmed 40% formamide/2 × SSC Buffer for 30 min rocking at 37 °C. Probe mixture was prepared as 80 nM CAG-Cy3 probes in 80% formamide and 800 ng/µl tRNA/ssDNA and heated at 95 °C for 2 min then transferred quickly to ice. Equal volume of hybridization buffer (4 × SSC Buffer, 2 µg/µl BSA, 40 mM Vanadyl and 20% dextran sulfate) were added into probe mixture, mixed and aliquoted 25 μl to parafilm and overlayed with coverslips. Hybridization was then performed in a pre-warmed light-proof humidified chamber for 2–3 h at 37 °C. Following hybridization, cells were washed for 30 min at 37 °C in a solution of 40% formamide and 1 × SSC, then 30 min at 37 °C in 20% formamide and 2 × SSC, and 3× 10 min at room temperature in 1 × SSC. All the washes were performed on a shaker in the dark. Last, the coverslips were rinsed in 1× PBS/5mM MgCl2 and mounted with ProLong Diamond Antifade Mountant with DAPI (Thermo Fisher Scientific, P36962). The fluorescent cell images were acquired by confocal microscopy and analyzed by the software CellProfiler.
Immunostaining
Cells grown on coverslips were washed with 1 × PBS, fixed with 4% paraformaldehyde/1 × PBS for 15 min and washed in 1 × PBS for 3× 5 min each at room temperature. Then blocked in Blocking Buffer (1 × PBS/5% Normal Goat Serum/0.3% Triton X-100) for 1 h, and incubated with Mouse anti-MBNL1 (Sigma, M3320, 1:1000) in Antibody Dilution Buffer (1 × PBS/5% Normal Goat Serum/2% BSA/0.3% Triton X-100) at 4 °C overnight. Antibody was washed off with 3× 5 min 1 × PBS washes and incubated in Alexa Fluor594 donkey anti-mouse secondary antibody (Life Technologies, A-21203) diluted in Antibody Dilution Buffer for 1 h. The cells are washed with 1 × PBS 3× 5 min and mounted with ProLong Diamond Antifade Mountant with DAPI.
Rt-PCR
Total RNA was prepared from cells with RNeasy Plus Mini Kit (Qiagen, 74136) as per manufacturer’s instructions. The first strand cDNAs were synthesized from 1 g total RNA using Oligo(dT)20 primer or random hexamer and SuperScriptIII reverse transcriptase (Invitrogen, 18080-093) following the manufacture’s protocol. For alternative splicing quantification, 1/20 of cDNA was used as a template for the PCR amplification with Herculase II Fusion DNA Polymerases (Agilent Genomics, 600675) and the following primers: SERCA1_exon22 forward –5’- GCTCATGGTCCTCAAGATCTCAC and reverse – 5’ AGCTCTGCCTGAAGATGTGTCAC; INSR_exon11 forward -5’ CCAAAGACAGACTCTCAGAT and reverse 5’ AACATCGCCAAGGGACCTGC. PCR amplification was performed as follows: 95 °C for 1 min; followed by 30 cycles of 95 °C for 20 s, 55 °C for 20 s, 68 °C for 1 min and final extension at 68 °C for 4 min. The PCR products were analyzed by electrophoresis with 2.2% agarose gels and the density of bands was quantified using ImageJ. To quantify SERCA1, INSR, DMPK mRNA and 18S rRNA, quantitative PCR were performed per manufacturer’s instructions using TaqMan® Gene Expression Assay (ThermoFisher, Hs01092295, Hs00961557, Hs01094329 and Hs99999901).
Supplementary Material
Supplementary Material is available at HMG online.
Supplementary Material
Acknowledgements
Fan Zhang was supported with a postdoctoral fellowship award from The Marigold Foundation. We would like to thank David Logan for his assistance with the image analysis for nuclear foci quantification, Don MacKenzie and Sarah Howe for their support and helpful discussions throughout the project, and thank Jane Owens for manuscript revision and discussions.
Conflict of Interest statement. None declared.
Funding
Marigold Foundation. Funding to pay the Open Access publication charges for this article was provided by Pfizer Inc.
References
- 1. Thornton C.A. (2014) Myotonic dystrophy. Neurol. Clin., 32, 705–viii. [DOI] [PMC free article] [PubMed] [Google Scholar]
- 2. Day J.W., Ranum L.P. (2005) RNA pathogenesis of the myotonic dystrophies. Neuromuscul. Disord., 15, 5–16. [DOI] [PubMed] [Google Scholar]
- 3. Kumar A., Agarwal S., Agarwal D., Phadke S.R. (2013) Myotonic dystrophy type 1 (DM1): a triplet repeat expansion disorder. Gene, 522, 226–230. [DOI] [PubMed] [Google Scholar]
- 4. Brook J.D., McCurrach M.E., Harley H.G., Buckler A.J., Church D., Aburatani H., Hunter K., Stanton V.P., Thirion J.P., Hudson T.. et al. (1992) Molecular basis of myotonic dystrophy: expansion of a trinucleotide (CTG) repeat at the 3' end of a transcript encoding a protein kinase family member. Cell, 68, 799–808. [DOI] [PubMed] [Google Scholar]
- 5. Fu Y.H., Pizzuti A., Fenwick R.G. Jr., King J., Rajnarayan S., Dunne P.W., Dubel J., Nasser G.A., Ashizawa T., de Jong P.. et al. (1992) An unstable triplet repeat in a gene related to myotonic muscular dystrophy. Science, 255, 1256–1258. [DOI] [PubMed] [Google Scholar]
- 6. Caskey C.T., Pizzuti A., Fu Y.H., Fenwick R.G. Jr., Nelson D.L. (1992) Triplet repeat mutations in human disease. Science, 256, 784–789. [DOI] [PubMed] [Google Scholar]
- 7. Mahadevan M., Tsilfidis C., Sabourin L., Shutler G., Amemiya C., Jansen G., Neville C., Narang M., Barcelo J., O'Hoy K.. et al. (1992) Myotonic dystrophy mutation: an unstable CTG repeat in the 3' untranslated region of the gene. Science, 255, 1253–1255. [DOI] [PubMed] [Google Scholar]
- 8. Liquori C.L., Ricker K., Moseley M.L., Jacobsen J.F., Kress W., Naylor S.L., Day J.W., Ranum L.P. (2001) Myotonic dystrophy type 2 caused by a CCTG expansion in intron 1 of ZNF9. Science, 293, 864–867. [DOI] [PubMed] [Google Scholar]
- 9. Day J.W., Ranum L.P. (2005) Genetics and molecular pathogenesis of the myotonic dystrophies. Curr. Neurol. Neurosci. Rep., 5, 55–59. [DOI] [PubMed] [Google Scholar]
- 10. Cho D.H., Tapscott S.J. (2007) Myotonic dystrophy: emerging mechanisms for DM1 and DM2. Biochim. Biophys. Acta, 1772, 195–204. [DOI] [PubMed] [Google Scholar]
- 11. Mankodi A., Logigian E., Callahan L., McClain C., White R., Henderson D., Krym M., Thornton C.A. (2000) Myotonic dystrophy in transgenic mice expressing an expanded CUG repeat. Science, 289, 1769–1773. [DOI] [PubMed] [Google Scholar]
- 12. Jansen G., Groenen P.J., Bachner D., Jap P.H., Coerwinkel M., Oerlemans F., van den Broek W., Gohlsch B., Pette D., Plomp J.J.. et al. (1996) Abnormal myotonic dystrophy protein kinase levels produce only mild myopathy in mice. Nat. Genet., 13, 316–324. [DOI] [PubMed] [Google Scholar]
- 13. Davis B.M., McCurrach M.E., Taneja K.L., Singer R.H., Housman D.E. (1997) Expansion of a CUG trinucleotide repeat in the 3' untranslated region of myotonic dystrophy protein kinase transcripts results in nuclear retention of transcripts. Proc. Natl. Acad. Sci. U. S. A, 94, 7388–7393. [DOI] [PMC free article] [PubMed] [Google Scholar]
- 14. Kuyumcu-Martinez N.M., Wang G.S., Cooper T.A. (2007) Increased steady-state levels of CUGBP1 in myotonic dystrophy 1 are due to PKC-mediated hyperphosphorylation. Mol. Cell, 28, 68–78. [DOI] [PMC free article] [PubMed] [Google Scholar]
- 15. Wang G.S., Kearney D.L., De Biasi M., Taffet G., Cooper T.A. (2007) Elevation of RNA-binding protein CUGBP1 is an early event in an inducible heart-specific mouse model of myotonic dystrophy. J. Clin. Invest., 117, 2802–2811. [DOI] [PMC free article] [PubMed] [Google Scholar]
- 16. Kalsotra A., Xiao X., Ward A.J., Castle J.C., Johnson J.M., Burge C.B., Cooper T.A. (2008) A postnatal switch of CELF and MBNL proteins reprograms alternative splicing in the developing heart. Proc. Natl. Acad. Sci. U. S. A, 105, 20333–20338. [DOI] [PMC free article] [PubMed] [Google Scholar]
- 17. Kimura T., Nakamori M., Lueck J.D., Pouliquin P., Aoike F., Fujimura H., Dirksen R.T., Takahashi M.P., Dulhunty A.F., Sakoda S. (2005) Altered mRNA splicing of the skeletal muscle ryanodine receptor and sarcoplasmic/endoplasmic reticulum Ca2+-ATPase in myotonic dystrophy type 1. Hum. Mol. Genet., 14, 2189–2200. [DOI] [PubMed] [Google Scholar]
- 18. Hino S., Kondo S., Sekiya H., Saito A., Kanemoto S., Murakami T., Chihara K., Aoki Y., Nakamori M., Takahashi M.P.. et al. (2007) Molecular mechanisms responsible for aberrant splicing of SERCA1 in myotonic dystrophy type 1. Hum. Mol. Genet., 16, 2834–2843. [DOI] [PubMed] [Google Scholar]
- 19. Tang Z.Z., Yarotskyy V., Wei L., Sobczak K., Nakamori M., Eichinger K., Moxley R.T., Dirksen R.T., Thornton C.A. (2012) Muscle weakness in myotonic dystrophy associated with misregulated splicing and altered gating of Ca(V)1.1 calcium channel. Hum. Mol. Genet., 21, 1312–1324. [DOI] [PMC free article] [PubMed] [Google Scholar]
- 20. Savkur R.S., Philips A.V., Cooper T.A. (2001) Aberrant regulation of insulin receptor alternative splicing is associated with insulin resistance in myotonic dystrophy. Nat. Genet., 29, 40–47. [DOI] [PubMed] [Google Scholar]
- 21. Zu T., Gibbens B., Doty N.S., Gomes-Pereira M., Huguet A., Stone M.D., Margolis J., Peterson M., Markowski T.W., Ingram M.A.. et al. (2011) Non-ATG-initiated translation directed by microsatellite expansions. Proc. Natl. Acad. Sci. U. S. A, 108, 260–265. [DOI] [PMC free article] [PubMed] [Google Scholar]
- 22. Kalsotra A., Singh R.K., Gurha P., Ward A.J., Creighton C.J., Cooper T.A. (2014) The Mef2 transcription network is disrupted in myotonic dystrophy heart tissue, dramatically altering miRNA and mRNA expression. Cell Rep., 6, 336–345. [DOI] [PMC free article] [PubMed] [Google Scholar]
- 23. Ebralidze A., Wang Y., Petkova V., Ebralidse K., Junghans R.P. (2004) RNA leaching of transcription factors disrupts transcription in myotonic dystrophy. Science, 303, 383–387. [DOI] [PubMed] [Google Scholar]
- 24. Batra R., Charizanis K., Manchanda M., Mohan A., Li M., Finn D.J., Goodwin M., Zhang C., Sobczak K., Thornton C.A.. et al. (2014) Loss of MBNL leads to disruption of developmentally regulated alternative polyadenylation in RNA-mediated disease. Mol. Cell, 56, 311–322. [DOI] [PMC free article] [PubMed] [Google Scholar]
- 25. Fardaei M., Rogers M.T., Thorpe H.M., Larkin K., Hamshere M.G., Harper P.S., Brook J.D. (2002) Three proteins, MBNL, MBLL and MBXL, co-localize in vivo with nuclear foci of expanded-repeat transcripts in DM1 and DM2 cells. Hum. Mol. Genet., 11, 805–814. [DOI] [PubMed] [Google Scholar]
- 26. Ho T.H., Charlet B.N., Poulos M.G., Singh G., Swanson M.S., Cooper T.A. (2004) Muscleblind proteins regulate alternative splicing. embo J., 23, 3103–3112. [DOI] [PMC free article] [PubMed] [Google Scholar]
- 27. Jiang H., Mankodi A., Swanson M.S., Moxley R.T., Thornton C.A. (2004) Myotonic dystrophy type 1 is associated with nuclear foci of mutant RNA, sequestration of muscleblind proteins and deregulated alternative splicing in neurons. Hum. Mol. Genet., 13, 3079–3088. [DOI] [PubMed] [Google Scholar]
- 28. Miller J.W., Urbinati C.R., Teng-Umnuay P., Stenberg M.G., Byrne B.J., Thornton C.A., Swanson M.S. (2000) Recruitment of human muscleblind proteins to (CUG)(n) expansions associated with myotonic dystrophy. embo J., 19, 4439–4448. [DOI] [PMC free article] [PubMed] [Google Scholar]
- 29. Rau F., Freyermuth F., Fugier C., Villemin J.P., Fischer M.C., Jost B., Dembele D., Gourdon G., Nicole A., Duboc D.. et al. (2011) Misregulation of miR-1 processing is associated with heart defects in myotonic dystrophy. Nat. Struct. Mol. Biol., 18, 840–845. [DOI] [PubMed] [Google Scholar]
- 30. Wang E.T., Cody N.A., Jog S., Biancolella M., Wang T.T., Treacy D.J., Luo S., Schroth G.P., Housman D.E., Reddy S.. et al. (2012) Transcriptome-wide regulation of pre-mRNA splicing and mRNA localization by muscleblind proteins. Cell, 150, 710–724. [DOI] [PMC free article] [PubMed] [Google Scholar]
- 31. Pascual M., Vicente M., Monferrer L., Artero R. (2006) The Muscleblind family of proteins: an emerging class of regulators of developmentally programmed alternative splicing. Differentiation, 74, 65–80. [DOI] [PubMed] [Google Scholar]
- 32. Castle J.C., Zhang C., Shah J.K., Kulkarni A.V., Kalsotra A., Cooper T.A., Johnson J.M. (2008) Expression of 24,426 human alternative splicing events and predicted cis regulation in 48 tissues and cell lines. Nat. Genet., 40, 1416–1425. [DOI] [PMC free article] [PubMed] [Google Scholar]
- 33. Teplova M., Patel D.J. (2008) Structural insights into RNA recognition by the alternative-splicing regulator muscleblind-like MBNL1. Nat. Struct. Mol. Biol., 15, 1343–1351. [DOI] [PMC free article] [PubMed] [Google Scholar]
- 34. Goers E.S., Purcell J., Voelker R.B., Gates D.P., Berglund J.A. (2010) MBNL1 binds GC motifs embedded in pyrimidines to regulate alternative splicing. Nucleic Acids Res., 38, 2467–2484. [DOI] [PMC free article] [PubMed] [Google Scholar]
- 35. Artero R., Prokop A., Paricio N., Begemann G., Pueyo I., Mlodzik M., Perez-Alonso M., Baylies M.K. (1998) The muscleblind gene participates in the organization of Z-bands and epidermal attachments of Drosophila muscles and is regulated by Dmef2. Dev. Biol., 195, 131–143. [DOI] [PubMed] [Google Scholar]
- 36. Begemann G., Paricio N., Artero R., Kiss I., Perez-Alonso M., Mlodzik M. (1997) muscleblind, a gene required for photoreceptor differentiation in Drosophila, encodes novel nuclear Cys3His-type zinc-finger-containing proteins. Development, 124, 4321–4331. [DOI] [PubMed] [Google Scholar]
- 37. Kanadia R.N., Urbinati C.R., Crusselle V.J., Luo D., Lee Y.J., Harrison J.K., Oh S.P., Swanson M.S. (2003) Developmental expression of mouse muscleblind genes Mbnl1, Mbnl2 and Mbnl3. Gene Expr Patterns, 3, 459–462. [DOI] [PubMed] [Google Scholar]
- 38. Charizanis K., Lee K.Y., Batra R., Goodwin M., Zhang C., Yuan Y., Shiue L., Cline M., Scotti M.M., Xia G.. et al. (2012) Muscleblind-like 2-mediated alternative splicing in the developing brain and dysregulation in myotonic dystrophy. Neuron, 75, 437–450. [DOI] [PMC free article] [PubMed] [Google Scholar]
- 39. Kanadia R.N., Johnstone K.A., Mankodi A., Lungu C., Thornton C.A., Esson D., Timmers A.M., Hauswirth W.W., Swanson M.S. (2003) A muscleblind knockout model for myotonic dystrophy. Science, 302, 1978–1980. [DOI] [PubMed] [Google Scholar]
- 40. Lee K.Y., Li M., Manchanda M., Batra R., Charizanis K., Mohan A., Warren S.A., Chamberlain C.M., Finn D., Hong H.. et al. (2013) Compound loss of muscleblind-like function in myotonic dystrophy. EMBO Mol. Med., 5, 1887–1900. [DOI] [PMC free article] [PubMed] [Google Scholar]
- 41. Poulos M.G., Batra R., Li M., Yuan Y., Zhang C., Darnell R.B., Swanson M.S. (2013) Progressive impairment of muscle regeneration in muscleblind-like 3 isoform knockout mice. Hum. Mol. Genet., 22, 3547–3558. [DOI] [PMC free article] [PubMed] [Google Scholar]
- 42. Du H., Cline M.S., Osborne R.J., Tuttle D.L., Clark T.A., Donohue J.P., Hall M.P., Shiue L., Swanson M.S., Thornton C.A.. et al. (2010) Aberrant alternative splicing and extracellular matrix gene expression in mouse models of myotonic dystrophy. Nat. Struct. Mol. Biol., 17, 187–193. [DOI] [PMC free article] [PubMed] [Google Scholar]
- 43. Kanadia R.N., Shin J., Yuan Y., Beattie S.G., Wheeler T.M., Thornton C.A., Swanson M.S. (2006) Reversal of RNA missplicing and myotonia after muscleblind overexpression in a mouse poly(CUG) model for myotonic dystrophy. Proc. Natl. Acad. Sci. U. S. A, 103, 11748–11753. [DOI] [PMC free article] [PubMed] [Google Scholar]
- 44. Chamberlain C.M., Ranum L.P. (2012) Mouse model of muscleblind-like 1 overexpression: skeletal muscle effects and therapeutic promise. Hum. Mol. Genet., 21, 4645–4654. [DOI] [PMC free article] [PubMed] [Google Scholar]
- 45. Ran F.A., Hsu P.D., Wright J., Agarwala V., Scott D.A., Zhang F. (2013) Genome engineering using the CRISPR-Cas9 system. Nat. Protoc., 8, 2281–2308. [DOI] [PMC free article] [PubMed] [Google Scholar]
- 46. Gottesfeld J.M., Pandolfo M. (2009) Development of histone deacetylase inhibitors as therapeutics for neurological disease. Future Neurol., 4, 775–784. [DOI] [PMC free article] [PubMed] [Google Scholar]
- 47. Lewin B. (1998) The mystique of epigenetics. Cell, 93, 301–303. [DOI] [PubMed] [Google Scholar]
- 48. Mann B.S., Johnson J.R., Cohen M.H., Justice R., Pazdur R. (2007) FDA approval summary: vorinostat for treatment of advanced primary cutaneous T-cell lymphoma. Oncologist, 12, 1247–1252. [DOI] [PubMed] [Google Scholar]
- 49. Cardani R., Baldassa S., Botta A., Rinaldi F., Novelli G., Mancinelli E., Meola G. (2009) Ribonuclear inclusions and MBNL1 nuclear sequestration do not affect myoblast differentiation but alter gene splicing in myotonic dystrophy type 2. Neuromuscul. Disord., 19, 335–343. [DOI] [PubMed] [Google Scholar]
- 50. Goodwin M., Mohan A., Batra R., Lee K.Y., Charizanis K., Gomez F.J., Eddarkaoui S., Sergeant N., Buee L., Kimura T.. et al. (2015) MBNL Sequestration by Toxic RNAs and RNA Misprocessing in the Myotonic Dystrophy Brain. Cell Rep., 12, 1159–1168. [DOI] [PMC free article] [PubMed] [Google Scholar]
- 51. Echeverria G.V., Cooper T.A. (2012) RNA-binding proteins in microsatellite expansion disorders: mediators of RNA toxicity. Brain Res., 1462, 100–111. [DOI] [PMC free article] [PubMed] [Google Scholar]
- 52. Freyermuth F., Rau F., Kokunai Y., Linke T., Sellier C., Nakamori M., Kino Y., Arandel L., Jollet A., Thibault C.. et al. (2016) Splicing misregulation of SCN5A contributes to cardiac-conduction delay and heart arrhythmia in myotonic dystrophy. Nat Commun., 7, 11067.. [DOI] [PMC free article] [PubMed] [Google Scholar]
- 53. Sobczak K., Wheeler T.M., Wang W., Thornton C.A. (2013) RNA interference targeting CUG repeats in a mouse model of myotonic dystrophy. Mol. Ther., 21, 380–387. [DOI] [PMC free article] [PubMed] [Google Scholar]
- 54. Nakamori M., Pearson C.E., Thornton C.A. (2011) Bidirectional transcription stimulates expansion and contraction of expanded (CTG)*(CAG) repeats. Hum. Mol. Genet., 20, 580–588. [DOI] [PMC free article] [PubMed] [Google Scholar]
- 55. Wheeler T.M., Leger A.J., Pandey S.K., MacLeod A.R., Nakamori M., Cheng S.H., Wentworth B.M., Bennett C.F., Thornton C.A. (2012) Targeting nuclear RNA for in vivo correction of myotonic dystrophy. Nature, 488, 111–115. [DOI] [PMC free article] [PubMed] [Google Scholar]
- 56. Lee J.E., Bennett C.F., Cooper T.A. (2012) RNase H-mediated degradation of toxic RNA in myotonic dystrophy type 1. Proc. Natl. Acad. Sci. U. S. A, 109, 4221–4226. [DOI] [PMC free article] [PubMed] [Google Scholar]
- 57. Gonzalez-Barriga A., Mulders S.A., van de Giessen J., Hooijer J.D., Bijl S., van Kessel I.D., van Beers J., van Deutekom J.C., Fransen J.A., Wieringa B.. et al. (2013) Design and analysis of effects of triplet repeat oligonucleotides in cell models for myotonic dystrophy. Mol Ther Nucleic Acids, 2, e81.. [DOI] [PMC free article] [PubMed] [Google Scholar]
- 58. Hoskins J.W., Ofori L.O., Chen C.Z., Kumar A., Sobczak K., Nakamori M., Southall N., Patnaik S., Marugan J.J., Zheng W.. et al. (2014) Lomofungin and dilomofungin: inhibitors of MBNL1-CUG RNA binding with distinct cellular effects. Nucleic Acids Res., 42, 6591–6602. [DOI] [PMC free article] [PubMed] [Google Scholar]
- 59. Ketley A., Chen C.Z., Li X., Arya S., Robinson T.E., Granados-Riveron J., Udosen I., Morris G.E., Holt I., Furling D.. et al. (2014) High-content screening identifies small molecules that remove nuclear foci, affect MBNL distribution and CELF1 protein levels via a PKC-independent pathway in myotonic dystrophy cell lines. Hum. Mol. Genet., 23, 1551–1562. [DOI] [PMC free article] [PubMed] [Google Scholar]
- 60. Wong C.H., Nguyen L., Peh J., Luu L.M., Sanchez J.S., Richardson S.L., Tuccinardi T., Tsoi H., Chan W.Y., Chan H.Y.. et al. (2014) Targeting toxic RNAs that cause myotonic dystrophy type 1 (DM1) with a bisamidinium inhibitor. J. Am. Chem. Soc., 136, 6355–6361. [DOI] [PMC free article] [PubMed] [Google Scholar]
- 61. Rzuczek S.G., Southern M.R., Disney M.D. (2015) Studying a Drug-like, RNA-Focused Small Molecule Library Identifies Compounds That Inhibit RNA Toxicity in Myotonic Dystrophy. ACS Chem. Biol., 10, 2706–2715. [DOI] [PMC free article] [PubMed] [Google Scholar]
- 62. Disney M.D. (2013) Rational design of chemical genetic probes of RNA function and lead therapeutics targeting repeating transcripts. Drug Discov. Today, 18, 1228–1236. [DOI] [PMC free article] [PubMed] [Google Scholar]
- 63. Chen G., Masuda A., Konishi H., Ohkawara B., Ito M., Kinoshita M., Kiyama H., Matsuura T., Ohno K. (2016) Phenylbutazone induces expression of MBNL1 and suppresses formation of MBNL1-CUG RNA foci in a mouse model of myotonic dystrophy. Sci. Rep., 6, 25317.. [DOI] [PMC free article] [PubMed] [Google Scholar]
- 64. Manal M., Chandrasekar M.J., Gomathi Priya J., Nanjan M.J. (2016) Inhibitors of histone deacetylase as antitumor agents: A critical review. Bioorg. Chem., 67, 18–42. [DOI] [PubMed] [Google Scholar]
- 65. Wojciechowska M., Taylor K., Sobczak K., Napierala M., Krzyzosiak W.J. (2014) Small molecule kinase inhibitors alleviate different molecular features of myotonic dystrophy type 1. RNA Biol., 11, 742–754. [DOI] [PMC free article] [PubMed] [Google Scholar]
- 66. Osborne R.J., Thornton C.A. (2008) Cell-free cloning of highly expanded CTG repeats by amplification of dimerized expanded repeats. Nucleic Acids Res., 36, e24.. [DOI] [PMC free article] [PubMed] [Google Scholar]
Associated Data
This section collects any data citations, data availability statements, or supplementary materials included in this article.