

Abstract
Child mortality is one of the most pressing global health and policy issues in the developing world. The leading drivers of death—pneumonia, diarrhea and malaria—are preventable and treatable. However, these illnesses are exacerbated by a lack of accessible nutrition, water, basic and preventive health services, and sanitary living conditions—all factors which are more likely to disproportionately impact the poor. We examine whether Kenya’s largest social protection impacts children’s incidence of upper respiratory illness. The Kenya Cash Transfer for Orphans and Vulnerable Children was designed to support orphans affected by HIV/AIDS and has covered over 240,000 households as of 2014. Using longitudinal, cluster-randomized program data from 2007 to 2009, we run a generalized linear latent and mixed method estimation model on a sample of children 0–7 years and under-5 years of age. We find that the program is associated with a decrease in illness in children 0–7 years of age (P < 0.05), but found no effects on a stratified sample of under-5 children. Furthermore, no impacts on health care seeking in the event of illness were detected. This study is one of few examining children’s health using data from a large scale unconditional cash transfer program. With the widespread adoption of over 123 cash transfer programs across sub-Saharan Africa, these findings suggest social cash transfer programs are capable of promoting the multidimensional well-being for the world’s most vulnerable populations.
Keywords: Children’s health, Kenya, orphans, unconditional cash transfer, under-5s
Key Messages
Infectious diseases such as malaria and pneumonia account for the majority of child mortality in developing countries.
Social cash transfers (SCTs) are becoming a widespread social protection and anti-poverty policy instrument in Sub-Saharan Africa. However, the existing literature of SCT impacts on children’s health is limited and presents mixed results.
Findings from this study indicate that Kenya’s largest social protection program reduces the incidence of fever and hot body symptoms among children 0–7 years of age. No impacts were observed for under-5s or on the likelihood of seeking care in the event of illness.
Social cash transfers are a promising avenue to promote investment in children’s health.
Introduction
Children under 5 years old face the greatest risk of mortality from infectious diseases and under-nutrition, where the former accounts for roughly two-thirds of global child mortalities (Liu et al. 2012). Recent estimates find that malaria led to 627 000 child deaths in 2012, 77% of which were in children under 5 years of age (WHO 2013). Pneumonia is also the leading infectious disease killer of children under 5 years old, with 1.1 million under-5s dying each year (WHO 2000; Liu et al. 2012).
Older children (6–17 years) are less vulnerable to death, but infectious diseases carry long term socioeconomic consequences. Infectious diseases were estimated to account for 6.4 million disability-adjusted years among school children in sub-Saharan Africa during 2010 (IMHE 2013). Time spent recovering from illness may result in decreased learning capacity, lower performance, and adverse schooling outcomes in school age children (Nankabirwa et al. 2013; Kvalsvig et al. 1991; Miguel and Kremer 2004; Bobonis et al. 2006). Poor educational outcomes may lead to declines in future wage and economic insecurity, thus perpetuating the intergenerational transmission of poverty (Schultz 1988).
Poor children from low resource countries also bear greater risk of death from communicable diseases. The poor are more likely to be deprived of basic necessities such as sanitary living conditions, accessible clean water, and adequate nutrition (Pelletier and Frongillo 2003; Herrera et al. 1992; Mosley and Chen 1984). The first two factors increase exposure to vector-borne illnesses, while the latter is estimated to contribute towards 45% of all under-5 deaths (WHO 2013). While simple and inexpensive interventions make death preventable and illness detectable and treatable, poor families experience barriers to obtaining health care. Financial and/or far travel distances contribute to delays in care seeking. These delays increase the likelihood of irreparable health deterioration or death and are estimated to contribute to 70% of all under-5 child deaths (Victora et al. 2003; WHO 2005).
A robust, emerging literature finds that cash transfer schemes, both conditional and unconditional, improve welfare outcomes of the poor. Large-scale successes in Latin America have led to resounding policy adoption across the world and its consideration as a new paradigm for foreign aid. Research on conditional cash transfers focus on investment behaviors in education, consumption, and health. A smaller evidence base examine whether unconditional cash transfers impact children’s health.
This study seeks to examine whether cash transfers can address one of sub-Saharan Africa’s most pressing global health issues pertaining to young children’s health capital. We contribute to a literature by using program data from a cluster-randomized longitudinal evaluation of Kenya’s largest social protection program, the Cash Transfer for Orphans and Vulnerable Children (CT-OVC). Children’s health outcomes are measured by the incidence of malaria or pneumonia and whether health services were sought during the child’s illness. We find reductions in illness for school-aged children, but no significant impacts for young children or health seeking. While more could be done to promote health investments among the most vulnerable children, the evidence suggests that social cash transfers may be a promising avenue to bolster multi-dimensional welfare for poor households.
Theory and empirical literature on children’s health & cash transfers
Child mortality occurs when an accumulation of adverse social and economic factors operate through five common biological mechanisms (Mosley and Chen 1984). Poverty exacerbates the severity of these proximate health determinants, specifically, environmental contaminations and/or nutritional deficiency. Cooking practices and quality of cook stove and fuel usage lead to diminished air quality and greater exposure to air pollution (KNBS 2010). Toilet types and water sources, especially if uncovered, are potential disease vectors for malaria (WHO 2013). Poverty affects access to adequate nutrition, where the lack of such is known to aggravate the deleterious consequences of illness (Pelletier and Frongillo 2003).
Cash transfers promote health capital investment by offsetting barriers created by poverty. Income fluctuations, persistent poverty, or large economic shocks diminish a household’s ability to maintain adequate consumption, invest in human capital, or accumulate assets. Regular and substantive cash payments increase the household’s capability to prevent, manage, and cope with risk and exogenous shocks (Blank et al. 2010). In regards to upper respiratory infections, cash transfers would operate by bolstering consumption and investment in any of the following: improved living conditions, purchase of nutritious foods or higher quality assets used on a daily basis (e.g. cook stove or fuel), or by increasing access to health services.
Few studies examine these casual mechanisms. Instead, the focus has been on resolving the broader question of whether cash transfers offer protective effects against children’s risk of contracting infectious disease. In this regard, the literature presents promising but mixed findings from the two related but distinct types of cash transfer schemes, conditional and unconditional programs.
Conditional cash transfers (CCTs) are associated with reductions in illness among children. Newborns (0–35 months) from treatment households in Mexico’s Oportunidades were 25 percentage points less likely to be ill as compared to control newborns (Gertler 2004). These impacts increased the longer children were exposed. By 20 months, treatment receiving children were 40 percentage points less likely to be ill (P<0.05). In Colombia’s Familia en Acción, beneficiary children 48 months and younger living in rural areas were less likely to be afflicted by diarrhea by 10.6 (P<0.10) and 10.9 (P<0.05) percentage points (Attanasio et al. 2005). There were no significant findings for incidence of respiratory disease.
The key difference—that conditional cash transfers institute program requirements for benefits—may reveal more about the successful take-up of the program and demand for cash than a household’s natural investment behavior. It is therefore difficult to extrapolate such findings to an unconditional scheme, where households spend money freely without needing to fulfill health-related program requirements. Furthermore, CCT findings are difficult to generalize in a different country and continent contexts such as sub-Saharan Africa, where unconditional cash transfer schemes are prevalent.
Only one unconditional cash transfer study finds positive effects on sickness, the focus of which is on outcomes of older children. After one year in Malawi’s Mchinji Pilot Program, control group children of all ages (6–17) were 1.58 times more likely to experience sickness in the previous month as compared to the intervention group (P<0.01) (Luseno et al. 2013). Other studies from Mchinji and Zambia’s Child Grant Program (CGP) fail to find significant results (Miller et al. 2008; AIR 2013).
This study also examines whether CT-OVC—by reducing or removing financial barriers—influences health seeking in the event of illness. Previous findings present conflicting results, where Mchinji intervention households were 10.98 times more likely to utilize health services after one year in the program (P < 0.01) (Luseno et al. 2013). Zambia CGP intervention households were 14.2 percentage points less likely to seek care for acute respiratory illness (P < 0.05) (AIR 2013). Researchers did not clarify the reasons for this finding, which may be due to wording on the questionnaire. Coughing was used to measure acute respiratory illness and caretakers may have responded to the symptoms of the common cold, which may not be considered serious enough to warrant care seeking. No significant results were found for health seeking with fever.
Health falls under the broader sub-category of human capital investment, but Kenya CT-OVC emphasizes continuous investment in children’s schooling. Households were told that they qualified based on the presence of school-aged children. Nonetheless, it would be reasonable to see improvements in older children’s health, as it is a determinant of schooling outcomes. Positive externalities at the household-level may also benefit the health of young children. Because food is shared among the household, young children would be likely to benefit from more nutritious foods and changes in other investment behaviors of household decision-makers. Previous Kenya CT-OVC studies find that beneficiary households engaged in investment behaviors such as spending more money on or increasing consumption of, children’s education and nutrient-rich foods (The Kenya Evaluation Team 2012a, b).
Background
Study setting
Kenya is located in East Africa and surrounded by the Indian Ocean, coastal and landlocked countries, and Lake Victoria. Though Kenya is one of the fastest growth economies in sub-Saharan Africa, nearly half of all Kenyans live below the poverty line (UNICEF). The country measures low on human progress indicators, possessing a Human Development Index ranking of 147 out of 187 countries (UNDP 2014). In the past two decades, the HIV/AIDS pandemic has resulted in 1.6 million individuals living with HIV and a 6% prevalence rate for adults 15–49 (National AIDS Council of Kenya 2014). Life expectancies have decreased and over half the population is below 15 years of age (UNICEF).
Infectious diseases are also a leading public health concern. Seventy-five percent of the population is at risk of malarial infection (WHO 2013). Though malaria reporting is inconsistent, it is estimated to cause 20% of all U5 deaths (KNBS 2008; Kenya MOH 2006). Acute respiratory infections are also a leading cause of child mortality, estimated to cause 16% of all child mortality in the country (KNBS 2008; Black et al. 2010).
Program description
The Cash Transfer for Orphans and Vulnerable Children (CT-OVC) is the largest social protection program in Kenya. It is designed to prevent the intergenerational transmission of poverty caused by HIV/AIDS through financial support to caretaking families of orphans. The program is a collaboration between the Government of Kenya’s Department of Children’s Services (DCS), with financial assistance from UNICEF and DFID. It was introduced as a pre-pilot during 2004 and has steadily expanded, with an estimated coverage to over 240 000 households as of 2014 (Mwasiaji 2015).
Enrollment into the program requires a two-step verification process which begins with community identification of households based on observable and known poverty indicators. Qualifications include the following: 1) having the presence of one OVC under the age of 18 who has at least one deceased parent, or who is chronically ill, or whose main caretaker is chronically ill; 2) being ultra-poor; and 3) not currently receiving assistance from any other social program. Ultra-poor poverty status is determined through means analysis of household-level socioeconomic indicators, such as low educational attainment or unemployment of adults, asset indicators like the possession of less than two acres of land, non-durable household infrastructure, drinking water which is sourced from its natural origin, or livestock possession.
A two-step verification process was used to confirm eligibility into the program. First, community-based targeting was employed. Location OVC Committees (LOCs), comprised of members from each community, are provided information about the eligibility criteria. They are asked to identify potentially eligible households based on their knowledge of community membership and through observable poverty proxy indicators. Follow up visits are made by the program and if eligible, households are invited to apply. The applications are verified at the district-level. Because selection is conducted at the district-level, selection bias arising from the heterogeneity of households who might or might not apply into the program is a non-issue. Take-up is near universal due to the unconditional nature of the program.
Beneficiary households receive a cash transfer roughly equivalent to 20% of the household’s total monthly expenditures (Ksh 1500 or USD $21 initially, adjusted to Ksh 2000 during 2011–12 due to inflation and declining values in currency). They are informed that the purpose of the program is to support the care of children through investments in health capital and schooling.
Methods
Study design
The data come from an evaluation of The Kenya’s Cash Transfers for Orphans and Vulnerable Children. The evaluation strategy is a longitudinal, cluster randomized design.GoK DCS identified seven districts across the country which would be included in a second wave expansion of the CT-OVC. Their selection process targeted districts with high poverty levels, HIV/AIDS impact, and no pre-existing OVC programs. From each district, four locations (the fourth geographical/administrative sub-units below provincial, district, and divisional levels) were selected. The districts are depicted in Figure 1.
Figure 1.
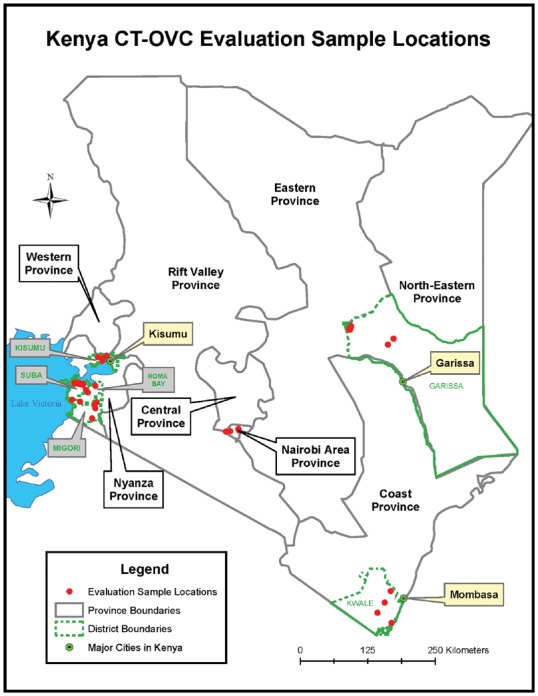
Locations of study communities
Due to limited resources and the infeasibility of enrolling all eligible households at once, a control group was constructed from locations that experienced delayed entry. An independent evaluator was commissioned to design the study and implement all aspects of the data collections. They used a lottery system to randomly selected two locations from each district to the control group and two to the intervention group using the same system. The control group is comprised of eligible households from clusters that were not enrolled in the program but were otherwise eligible and would have been enrolled had financial resources been available. Households within each location were assigned a computer-generated number from a random number generator, sorted in ascending order by assigned number, and selected until the desired sample size was achieved. Power calculations were used to detect a change of 5% of school enrollment, 20% in curative health care, and 10% in per capita consumption. In total, 28 clusters were included in the study (14 control, 14 treatment).
The study sample frame comes from a list of all eligible households provided by DCS (OPM 2010). The control sample frame comes from a household list of randomly sampled census enumeration areas. Baseline data from 1,542 treatment and 755 control households were collected from March to August of 2007. The program began in July 2007. The follow up consisted of a resampling of 1,325 treatment and 583 control households, which occurred from March to July of 2009.
Data
The data come from the evaluation of CT-OVC. A health module was asked of children ages 0–5 years in 2007 and 0–7 years in 2009. The analysis focuses on children of all ages and 0–4 years of age. The key outcomes of interest are incidence of illness (malaria and pneumonia) and whether care-seeking occurred during illness. Respondents are caretakers of the household who were asked whether the child had been ill with fever, hot body, or cough at any time in the last month. Measures for malaria and pneumonia were not based on clinical diagnosis, but were symptoms observed by caretakers. If the respondent affirmed that the child was sick within the past month, they were asked whether they sought treatment or advice from a health facility, pharmacy, or shop. If health care was sought from a non-ideal provider such as pharmacist, shop, or other person, care seeking was coded as 0. Both outcomes are coded as dichotomous variables.
Figure 2.

Participant flowchart
Demographical indicators include sex (1 if the child is male, 0 if female), age, orphan status, and relationship to head of household. Age is stratified into categories of under one year of age, one year to under three years of age, three years to under five, and 5–7 years of age to detect potential differences in illness and health seeking. A child is classified as an orphan if either mother or father is deceased or their living status is unknown. Relationship to head of household was coded as 1 if the child is a child or grandchild of the head of household and 0 for all other blood, marriage, or non-blood relations. Head of household sex, age, and highest level of educational attainment are included as controls for theoretical and programmatic reasons. Female head of household is a binary variable while age of household head and household head education are discrete.
Living environment controls are structured as binary variables. Households that used paraffin, kerosene, firewood, charcoal, residue, animal waste, or grasses were coded as using poor cook fuel. Acceptable cook fuels included electricity and gas. Drinking water that is sourced from an unprotected or open origin and sleeping without mosquito nets increase the likelihood of contracting malaria. Households that did not source their drinking water from natural sources obtained water via pipes into the dwelling or compound, public outdoor tap or borehole with a pump, protected well or spring, mobile vendor, or purchased from a neighbour. Rural as opposed to an urban area of residence increases the likelihood of contracting malaria due to the abundance of breeding sites (WHO 2013). This control was also included in the model. Type of toilet and cook stove quality could not be included in our analysis due to lack of variation among households.
Discrete controls for living environment were included in the models. A measure for crowding captures the child’s susceptibility to transmittable disease or contagions. The crowding index is measured by the ratio of household size to number of rooms in the household’s dwelling.
Wealth is a correlate to living environment conditions, education, and ability to access care. To capture the child’s long-term economic security, an asset index is constructed from nine livestock variables. Livestock ownership may include cattle (traditional zebu, traditional other, and hybrid), donkeys, camels, goats, sheep, pigs, or poultry. The Kaiser-Meyer-Olkin test (KMO) of sampling adequacy was used to determine whether PCA indices are appropriately constructed. The livestock indices met the 0.5 threshold of common variance. The livestock index for 2007 was 0.64 and 0.68 for 2009. A community-level indicator for food availability was also included in the analysis. Community leaders were asked whether food was more, same, or less available than previous years. Food insecurity was coded as 1 if food was less available and 0 for all other responses.
Diet influences the development of the immune system and a healthy diet may offer protective effects against contracting illness. A food expenditure variable adds the amount of money spent on 29 food items during the last week. It is a proxy for the quantity of food consumed. A food variety composite index captures the total number of different types of food consumed to capture nutritional adequacy.
Community leaders were also asked where community members would go to access treatment for a child with simple malaria. Distance is a critical determinant to care-seeking (Okwaraji et al. 2012; Gabrysch et al. 2011; Mulholland et al. 2008; Stock 1983). If the distance was >5 km, the distance was assigned a value of 1, for under 5 km, 0. This control was only used in the health seeking model.
Randomization
Summary statistics for 34 covariates are presented in Table 1, which contains only baseline households also included in the follow up. We examine the balance of baseline household-level indicators to understand the comparability between treatment arms. A separate analysis conducted on all baseline households reveals similar differences between treatment arms as measured in this study (OPM 2010).
Table 1.
Baseline equivalence of clustered household-level covariates, by treatment arms
| T | n | C | n | |
|---|---|---|---|---|
| Children’s characteristics | ||||
| Age categories | ||||
| 0-under 1 | 0.12 | 1256 | 0.15 | 540 |
| 1-under 3 | 0.39 | 1256 | 0.51 | 540 |
| 3-under 5 | 0.35 | 1256 | 0.40 | 540 |
| 5–7 years old | 0.68** | 1256 | 0.86 | 540 |
| Girls (average number) | 1.71* | 1256 | 1.95 | 540 |
| Orphan (average number) | 2.07 | 1256 | 2.32 | 540 |
| Head of household characteristics | ||||
| Household head education | 3.38* | 1256 | 4.88 | 540 |
| Household head age | 60.84* | 1256 | 55.15 | 540 |
| Female headed household | 0.61*** | 1256 | 0.51 | 540 |
| Environmental factors | ||||
| Household size | 6.73 | 1256 | 6.89 | 5.92 |
| Living environment - index | 0.08 | 1256 | 0.02 | 540 |
| Crowding Index | 3.53 | 1256 | 3.49 | 540 |
| Cook Stove (1=traditional stone) | 0.72 | 1256 | 0.82 | 540 |
| Cook fuel, poor quality | 0.94 | 1256 | 0.97 | 540 |
| No Toilet | 0.54 | 1256 | 0.56 | 540 |
| Water, unprotected/natural | 0.58 | 1256 | 0.69 | 540 |
| Mosquito net | 0.48 | 1256 | 0.56 | 540 |
| Investment behaviors | ||||
| Schooling expenditures, 12 mo | 7723.13 | 1256 | 6267.56 | 540 |
| Medical expenditures, 3 months | 1209.83 | 1256 | 1182.72 | 540 |
| Food expenditures, 1 week | 1059.66 | 1256 | 1613.24 | 540 |
| Food variety | 10.61 | 1256 | 11.15 | 540 |
| Diet diversity score | 4.61 | 1256 | 4.75 | 540 |
| Food groups as proportion of diet: | ||||
| Cereals, roots, tubers | 0.70 | 1256 | 0.73 | 539 |
| Fruits & veggies | 0.01 | 1256 | 0.01 | 539 |
| Legumes & nuts | 0.03 | 1256 | 0.04 | 539 |
| Meats, poultry, fish | 0.02 | 1256 | 0.03 | 539 |
| Fats & oils | 0.04 | 1256 | 0.03 | 539 |
| Dairy | 0.07 | 1256 | 0.07 | 539 |
| Eggs | 0.003*** | 1256 | 0.003 | 539 |
| Wealth | ||||
| Monthly Per capita adult expenditures | 1379.53 | 1256 | 1318.35 | 540 |
| Livestock - index | 0.05 | 1256 | −0.02 | 540 |
| Community-level characteristics | ||||
| Distance - malaria treatment 1=0–5 km; 0=5 km+ | 0.25 | 1219 | 0.28 | 508 |
| Distance - doctor* 1=0–5 km; 0=5 km+ | 0.67 | 1253 | 0.61 | 506 |
| Rural (1=rural, 0=urban) | 0.79 | 1256 | 0.85 | 540 |
P < 0.05, **P < 0.01, ***P < 0.001 denotes statistically significant differences between treatment arms.
The treatment groups were balanced on socioeconomic and welfare characteristics. There were no statistically significant differences in poverty status. Differences were detected on head of household characteristics where on average, treatment household decision makers receive 1.5 fewer years of education, are 5.7 years older, and 10 percentage points more likely to be female than controls households.
Other differences were measured on the number of 5–7 year olds, with more residing in control households than treatment. Finally, egg share was statistically significant, but the differences were nearly immeasurable.
One explanation for the household head differences may be due to programmatic considerations. Due to budgetary limitations and ethical and equity concerns, DCS prioritized households with greatest need when eligible households exceeded available resources. The households are similarly poor and there is no evidence to suggest that there are systematic investment preferences across the treatment arms which might bias the results.
Characteristics of the analytical sample
Descriptive statistics are presented in Table 2. The original analytical sample contained 1,138 children of all ages, but after restricting to complete cases with pre- and post-data, 921 children ages 0–7 years of age and 410 under-5 year olds remained in the incidence of illness sample. The health seeking sample contains 450 children 0–7 years and 210 under-5s.
Table 2.
Descriptive statistics for analytical samples, by wave
| Under 5s |
All children |
|||||||
|---|---|---|---|---|---|---|---|---|
| W1 | n | W2 | n | W1 | n | W2 | n | |
| Dependent variables | ||||||||
| Malaria/pneumonia | 0.61 | 845 | 0.54** | 492 | 0.59 | 962 | 0.53*** | 962 |
| Health Seeking if ill | 0.82 | 493 | 0.87 | 235 | 0.81 | 545 | 0.86 | 449 |
| Independent Variables | ||||||||
| Individual characteristics | ||||||||
| Age | 2.12 | 845 | 3.11 | 492 | 2.47 | 962 | 4.43 | 962 |
| Age categories | ||||||||
| 0-under 1 | 0.15 | 845 | 0.002 | 492 | 0.14 | 962 | 0.001 | 962 |
| 1-under 3 | 0.40 | 845 | 0.25 | 492 | 0.36 | 962 | 0.13 | 962 |
| 3-under 5 | 0.44 | 845 | 0.74 | 492 | 0.39 | 962 | 0.38 | 962 |
| 5–7 years old | – | – | – | – | 0.12 | 962 | 0.49 | 962 |
| Sex (1=male, 0=female) | 0.51 | 845 | 0.5 | 492 | 0.51 | 962 | 0.51 | 962 |
| Orphan | 0.47** | 845 | 0.12* | 492 | 0.5*** | 962 | 0.19*** | 962 |
| Relation to hhld head (1=child or grandchild, 0=other) | 0.97 | 845 | 0.98 | 492 | 0.96 | 962 | 0.96 | 962 |
| Low HAZ | 0.13 | 759 | 0.05** | 450 | 0.12 | 859 | 0.30 | 881 |
| Low BMIZ | 0.04 | 761 | 0.04 | 454 | 0.03 | 861 | 0.04** | 646 |
| Head of household characteristics | ||||||||
| Household head education | 4.56*** | 845 | 4.71*** | 492 | 4.52*** | 962 | 4.52*** | 962 |
| Household head age | 53.53*** | 845 | 53.45*** | 492 | 53.96*** | 962 | 53.96*** | 962 |
| Female headed household | 0.51** | 845 | 0.51*** | 492 | 0.51** | 962 | 0.51** | 962 |
| Environmental factors | ||||||||
| Household size | 7.58*** | 845 | 7.85 | 492 | 7.52*** | 962 | 7.52 | 962 |
| Living environment - index | 0.20 | 845 | 0.31 | 492 | 0.24 | 962 | 0.28 | 962 |
| Crowding Index | 4.01* | 845 | 4.1 | 492 | 4.02** | 962 | 4.02** | 962 |
| Cook Stove (1=traditional stone) | 0.70*** | 845 | 0.71*** | 492 | 0.71*** | 962 | 0.71*** | 962 |
| Cook fuel, poor quality | 0.91*** | 845 | 0.91 | 492 | 0.92*** | 962 | 0.92*** | 962 |
| No Toilet | 0.55** | 845 | 0.56 | 492 | 0.55 | 962 | 0.55 | 962 |
| Water, unprotected/natural | 0.56*** | 845 | 0.55*** | 492 | 0.55*** | 962 | 0.55*** | 962 |
| Mosquito net | 0.55*** | 845 | 0.56*** | 492 | 0.54*** | 962 | 0.54*** | 962 |
| Investment behaviors | ||||||||
| Schooling expenditures, 12 mo | 7694.59*** | 845 | 9102.49 | 492 | 7527.17*** | 962 | 8333.82** | 962 |
| Medical expenditures, 12 mo | 1109.32* | 845 | 1532.37 | 492 | 1076.51* | 962 | 1246.53* | 962 |
| Food expenditures | 1153.94 | 845 | 1998.74 | 492 | 1148.34 | 962 | 1994.45** | 962 |
| Food variety | 10.67 | 845 | 12.15** | 492 | 10.67 | 962 | 12.15*** | 962 |
| Diet diversity score | 4.59 | 845 | 5.08** | 492 | 4.59 | 962 | 5.08*** | 962 |
| Food groups as proportion of diet: | ||||||||
| Cereals, roots, tubers | 0.68*** | 845 | 0.46* | 490 | 0.67*** | 962 | 0.46*** | 959 |
| Fruits & veggies | 0.01 | 845 | 0.008* | 490 | 0.01 | 962 | 0.008 | 959 |
| Legumes & nuts | 0.05*** | 845 | 0.05 | 490 | 0.05*** | 962 | 0.05 | 959 |
| Meats, poultry, fish | 0.03 | 845 | 0.01 | 490 | 0.03 | 962 | 0.02 | 959 |
| Fats & oils | 0.04* | 845 | 0.3 | 490 | 0.04** | 962 | 0.3 | 959 |
| Dairy | 0.09*** | 845 | 0.08*** | 490 | 0.09*** | 962 | 0.07*** | 959 |
| Eggs | 0.002 | 845 | 0.001 | 490 | 0.002 | 962 | 0.001* | 959 |
| Wealth | ||||||||
| Monthly Per capita adult expenditures | 1212.44 | 845 | 1194.89 | 492 | 1219.16 | 962 | 1219.16 | 962 |
| Livestock - index | 0.09 | 845 | 0.18* | 492 | 0.09 | 962 | 0.13 | 962 |
| Community-level characteristics | ||||||||
| Distance - malaria treatment 1=0–5 km; 0=5 km+ | 0.25** | 811 | 0.53*** | 438 | 0.25*** | 924 | 0.53*** | 867 |
| Distance - doctor*1=0–5 km; 0=5 km+ | 0.6 | 828 | 0.75** | 468 | 0.60 | 940 | 0.75*** | 909 |
| Rural (1=rural, 0=urban) | 0.73*** | 845 | 0.74*** | 492 | 0.74*** | 962 | 0.74*** | 962 |
P < 0.05,
P < 0.01,
P < 0.001 denotes statistically significant differences between treatment arms.
The mean age of children from each treatment group is 2 years old. Roughly two-thirds of the sample is comprised of children ages 1-under 5 years old. Nearly all children are related to the household head by blood, as a child or grandchild and the sample is evenly divided by sex. Roughly 13% of the children have low height-for-age, which is a reflection of deficient health and nutritional status.
The children in this study are poor and mostly live in rural areas. Half of the sample resides in a female-headed household, where the head is on average, 54 years of age and has received 4.5 years of formal education. The majority of households use a traditional cook stove (71%) and poor quality cook fuel (92%). Half of the children live in households that source water from an unprotected source and do not use a mosquito net.
At the time of baseline, families in this study consumed little. Households spent approximately USD 9 per month on schooling expenditures and roughly USD 2.5 per day on food expenditures for the entire household. Their diets reflect a lack of nutritional diversity, consisting mainly of starches (67%). Meats and fruits and vegetables comprise 3% and 1% of dietary intake.
Empirical strategy
We use a three level generalized linear latent and mixed model (GLLAMM) to derive the average treatment effect of the program. Alternative estimation procedures were used, but GLLAMM allows for nesting of hierarchical data when levels are suspected to influence the outcomes. For instance, factors related to the location and household of residence may cause the correlation between individual-level outcomes. A difference-in-differences logistic model does not allow for clustering of data that GLLAMM estimation makes possible. This is preferred over a linear probability model with clustering at the location and household levels, due to the latter’s estimation of out-of-bound predictions. All models utilize 12 numerical integration points (nips) instead of the default 8 and adaptive quadrature instead of the default ordinary Gauss-Hermite quadrature unless otherwise specified. This was done to derive more robust standard errors (Rabe-Hesketh and Skrondal 2012). However, fewer than 12 nips were used when models had difficulty converging given sample restrictions. All results are presented as exponentiated coefficients and should be interpreted as an odds ratio.
The basic model below captures the impact of an individual i living in household j in k location and time t’s likelihood of experiencing the outcome illness or health seeking:
where captures the effect of trending between 2007 and 2009, captures the effect of baseline differences between treatment arms. represents all the individual, household, and living environment controls which were described in the data section, and and capture the correlation arising between individuals living in the same households and households in the same location, respectively. The samples are stratified to 0–7 years old and then separately for children under-5 years of age. All models are clustered at the location level.
The illness and health seeking models differ with the addition of a few controls. The illness models include the diet-related controls, including food expenditures and food variety. The health seeking models include controls for travel distance to health facilities that provide simple malaria and pneumonia treatment and total medical expenditures made during the last three months.
Results
Incidence of illness
Average treatment effects are presented in Table 3. In Columns 1 and 3, the reduced form model is presented; Columns 2 and 4 depict the full specifications including demographic, environmental, and economic controls. We see that CT-OVC is associated with significant reductions in illness in children ages 0–7 years old. Control children were 1.8 times more likely to be ill than treatment children, ceteris paribus (P < 0.05). As expected, the data confirm that infant children and between 1 year and under 3 years of age are more susceptible to illness than older children. In the full sample, girls were also 1.33 times more likely to be ill than boys (P < 0.05). These differences were not significant in children under-5. Though children under-5 were impacted in the expected direction for the outcome of interest, the results were insignificant at the conventional confidence level.
Table 3.
Treatment effects on children’s illness: simple and full models
| All Children (0–7) |
Children under 5 |
|||
|---|---|---|---|---|
| 1 | 2 | 3 | 4 | |
| Intervention Effect | 0.556* | 0.556* | 0.669 | 0.604 |
| (−2.45) | (−2.40) | (−1.16) | (−1.41) | |
| Year | 0.947 | 1.157 | 0.739 | 0.844 |
| (−0.28) | (0.68) | (−1.07) | (−0.48) | |
| Treatment status | 0.879 | 0.925 | 0.790 | 0.922 |
| (−0.60) | (−0.35) | (−0.81) | (−0.26) | |
| Age in months, (under 1 year) | 1.877* | 1.335 | ||
| (2.10) | (0.76) | |||
| Age in months, (1 year—under 3) | 2.062*** | 1.510 | ||
| (3.83) | (1.68) | |||
| Age in months, (3 years—under 5) | 1.254 | – | ||
| (1.53) | ||||
| Sex | 0.749* | 0.693 | ||
| (−2.16) | (−1.78) | |||
| Orphan | 0.982 | 0.854 | ||
| (−0.12) | (−0.66) | |||
| Child/grandchild | 0.987 | 0.734 | ||
| (−0.05) | (−0.71) | |||
| Female household head | 1.109 | 1.014 | ||
| (0.58) | (0.06) | |||
| Age of household head | 1.005 | 0.999 | ||
| (0.84) | (−0.07) | |||
| Household head education | 1.024 | 1.022 | ||
| (1.13) | (0.73) | |||
| Rural | 1.689* | 1.786 | ||
| (2.37) | (1.92) | |||
| Mosquito net | 0.913 | 0.993 | ||
| (−0.55) | (−0.03) | |||
| Unprotected/open water source | 1.032 | 0.724 | ||
| (0.17) | (−1.30) | |||
| Poor cook fuel quality | 0.739 | 0.691 | ||
| (−0.85) | (−0.77) | |||
| Crowding index | 0.920* | 0.931 | ||
| (−2.33) | (−1.43) | |||
| Asset/wealth index | 0.909 | 0.875 | ||
| (−1.77) | (−1.56) | |||
| Food insecurity | 1.277 | 1.214 | ||
| (1.44) | (0.80) | |||
| Food expenditures | 1.000 | 1.000 | ||
| (0.06) | (0.79) | |||
| Food variety | 1.019 | 1.047 | ||
| (1.01) | (1.65) | |||
| N | 932 | 921 | 410 | 410 |
Notes: Exponentiated coefficients; t statistics in parentheses. Children Under 5 Reduced estimated with 9 integration points. Children Under 5 Full estimated with 10 integration points.
P < 0.05, **P < 0.01, ***P < 0.001.
Health seeking
Table 4 presents the program’s impacts on caretakers seeking health care for their ill children. The program has no significant impact on the health seeking of intervention children in either full or under-5 only sample. Children between 1 year and under 3 years of age were more likely to have care sought for them compared with those between ages 5–7, which may be due to their increased likelihood of being ill as shown in Table 3. Age of the household head is significantly associated with health seeking in both samples, although the magnitude is not large. As expected, living in a rural area is associated with a decreased likelihood of seeking care which suggests that health providers are fewer or farther away. However, the measure for distance to treatment was not statistically significant.
Table 4.
Treatment effects on health care seeking: simple and full models
| All children (0–7) |
Children Under 5 |
|||
|---|---|---|---|---|
| 1 | 2 | 3 | 4 | |
| Intervention Effect | 1.426 | 1.203 | 0.752 | 0.620 |
| (0.96) | (0.45) | (−0.63) | (−0.94) | |
| Year | 0.778 | 1.032 | 0.974 | 0.782 |
| (−0.87) | (0.09) | (−0.07) | (−0.53) | |
| Treatment status | 1.129 | 0.992 | 2.308* | 2.151* |
| (0.40) | (−0.02) | (2.55) | (1.99) | |
| Age in months, | 1.003 | 0.406 | ||
| (under 1 year) | (0.01) | (−1.75) | ||
| Age in months, | 2.003* | 0.801 | ||
| (1 year—under 3) | (2.24) | (−0.64) | ||
| Age in months, | 1.525 | – | ||
| (3 years—under 5) | (1.68) | |||
| Sex | 0.935 | 0.858 | ||
| (−0.31) | (−0.59) | |||
| Orphan | 0.613 | 0.593 | ||
| (−1.87) | (−1.61) | |||
| Child/grandchild | 1.145 | 1.427 | ||
| (0.29) | (0.59) | |||
| Female household head | 1.054 | 1.314 | ||
| (0.19) | (0.92) | |||
| Age of household head | 1.021* | 1.022* | ||
| (2.05) | (2.01) | |||
| Household head education | 0.987 | 0.999 | ||
| (−0.40) | (−0.02) | |||
| Rural | 0.319** | 0.492 | ||
| (−3.00) | (−1.81) | |||
| Mosquito net | 1.091 | 1.409 | ||
| (0.33) | (1.08) | |||
| Unprotected/open water source | 1.069 | 1.090 | ||
| (0.24) | (0.30) | |||
| Poor cook fuel quality | 0.421 | 0.339 | ||
| (−1.52) | (−1.80) | |||
| Crowding index | 0.989 | 0.988 | ||
| (−0.19) | (−0.20) | |||
| Asset/wealth index | 1.151 | 1.059 | ||
| (1.42) | (0.42) | |||
| Food insecurity | 0.833 | 1.094 | ||
| (−0.63) | (0.26) | |||
| Food expenditures | 1.000 | 1.000 | ||
| (−0.68) | (−0.86) | |||
| Food variety | 1.012 | 0.996 | ||
| (0.38) | (−0.10) | |||
| Distance to treatment | 0.949 | 0.955 | ||
| (−0.67) | (−0.50) | |||
| Medical expenditures | 1.000* | 1.000** | ||
| (2.45) | (2.60) | |||
| N | 481 | 450 | 224 | 210 |
Notes: Exponentiated coefficients; t statistics in parentheses. Children Under 5 Reduced estimated with 10 integration points, Children Under 5 Full, estimated with 7 integration points.
P < 0.05, **P < 0.01, ***P < 0.001.
Extensions
We examine whether characteristics of the individual or their household are associated with differential fever protective effects, including a further exploration of the significant gender differential health outcomes. This analysis is presented in Tables 5–7.
Table 5.
Analytical sample stratified by sex
| (1) | (2) | |
|---|---|---|
| Boys only 0–7 years old | Girls only 0–7 years old | |
| Intervention Effect | 0.409** | 0.893 |
| (−2.79) | (−0.32) | |
| Year | 1.681 | 0.833 |
| (1.72) | (−0.59) | |
| Treatment status | 1.231 | 0.633 |
| (0.79) | (−1.49) | |
| Age in months, | 1.586 | 2.114 |
| (under 1 year) | (1.21) | (1.64) |
| Age in months, | 1.756* | 2.277** |
| (1 year—under 3) | (2.32) | (2.87) |
| Age in months, | 1.374 | 1.149 |
| (3 years—under 5) | (1.66) | (0.64) |
| Sex | 1.001 | 1.086 |
| (0.00) | (0.37) | |
| Orphan | 0.843 | 1.116 |
| (−0.54) | (0.30) | |
| Child/grandchild | 0.801 | 1.507 |
| (−1.13) | (1.76) | |
| Female household head | 1.018** | 0.987 |
| (2.63) | (−1.58) | |
| Age of household head | 1.032 | 1.009 |
| (1.36) | (0.30) | |
| Household head education | 1.352 | 2.185** |
| (1.20) | (2.71) | |
| Rural | 0.890 | 1.093 |
| (−0.59) | (0.38) | |
| Mosquito net | 1.239 | 0.756 |
| (1.03) | (−1.16) | |
| Unprotected/open water source | 0.888 | 0.931 |
| (−0.31) | (−0.15) | |
| Poor cook fuel quality | 0.956 | 0.885* |
| (−1.06) | (−2.48) | |
| Crowding index | 0.944 | 0.878 |
| (−0.90) | (−1.81) | |
| Asset/wealth index | 1.192 | 1.427 |
| (0.87) | (1.47) | |
| Food insecurity | 1.000 | 1.000 |
| (−1.18) | (0.68) | |
| Food expenditures | 0.999 | 1.056* |
| (−0.04) | (2.11) | |
| N | 472 | 448 |
Notes: Exponentiated coefficients; t statistics in parentheses.
P < 0.05, **P < 0.01, ***P < 0.001.
Gender differential effects
In the sample of children 0–7 years of age, boys were less likely to contract the illness than girls. Table 6 presents sex-stratified samples. Overall, intervention boys were less likely to experience illness than intervention girls. Children of both sexes from intervention households were less likely to be ill as compared to control children, but the protective effect was only significant among boys. Boys from control households were 2.4 times more likely to be ill than boys of intervention households. In a separate analysis, we examine whether differences at the household level, including in living environment, diet, or food security, are associated with the gender differential health outcomes. No intermediate factors could be attributed the differential outcomes. Likewise, for care seeking, no statistically significant difference is detected between sexes.
Table 6.
Orphan interaction models
| Illness |
||
|---|---|---|
| All (0–7) | Under 5 | |
| Intervention effect | 0.671 | 0.758 |
| (−1.51) | (−0.72) | |
| Year | 1.025 | 0.732 |
| (0.11) | (−0.86) | |
| Treatment status | 0.687 | 0.680 |
| (−1.34) | (−1.04) | |
| Age in months | 1.898* | 1.367 |
| (under 1 year) | (2.14) | (0.82) |
| Age in months | 2.080*** | 1.542 |
| (1 year—under 3) | (3.87) | (1.76) |
| Age in months | 1.252 | |
| (3 years—under 5) | (1.52) | |
| Sex | 0.747* | 0.689 |
| (−2.18) | (−1.81) | |
| Orphan | 0.656 | 0.503 |
| (−1.54) | (−1.64) | |
| Child/grandchild | 0.964 | 0.719 |
| (−0.14) | (−0.76) | |
| Female household head | 1.127 | 1.037 |
| (0.68) | (0.15) | |
| Age of household head | 1.005 | 0.999 |
| (0.80) | (−0.13) | |
| Household head education | 1.024 | 1.022 |
| (1.11) | (0.74) | |
| Rural | 1.643* | 1.741 |
| (2.24) | (1.83) | |
| Mosquito net | 0.909 | 0.978 |
| (−0.58) | (−0.09) | |
| Unprotected/open water source | 1.030 | 0.725 |
| (0.16) | (−1.30) | |
| Poor cook fuel quality | 0.768 | 0.715 |
| (−0.74) | (−0.70) | |
| Crowding index | 0.923* | 0.931 |
| (−2.23) | (−1.42) | |
| Asset/wealth index | 0.909 | 0.874 |
| (−1.78) | (−1.56) | |
| Food insecurity | 1.274 | 1.221 |
| (1.42) | (0.82) | |
| Food expenditures | 1.000 | 1.000 |
| (−0.08) | (0.72) | |
| Food variety | 1.020 | 1.048 |
| (1.04) | (1.67) | |
| Distance to treatment | ||
| Medical expenditures | ||
| Orphan * Treatment | 1.797 | 2.147 |
| (1.81) | (1.55) | |
| N | 921 | 410 |
Notes: Exponentiated coefficients; t statistics in parentheses. Fever-Under 5 estimated with 10 integration points.
P < 0.05, **P < 0.01, ***P < 0.001.
Orphan differential effects
A primary purpose of CT-OVC is to bolster the human capital investment of orphans and vulnerable children. We include orphan interaction effects to test whether orphans and non-orphans were treated differently in the absence of the program. There were no statistically significant differences between orphans and non-orphans. These results are depicted in Table 6.
Differential effects by household size and dependency ratio
The program provides a flat cash transfer to qualifying households, regardless of number of dependents, orphans, or household size. In Table 7, we examine whether the transfer has different effects on households of varying sizes and composition. The dependency ratio is measured as the ratio of children 14 years and under and adults 65 and over to working age adults 15–64 years old within a household. We see no significant differences in health. The last two columns include a measure for small versus large household, where the former is defined as one containing 6 or fewer members. No differences were detected.
Table 7.
Household composition interaction models
| 0–7 | Under 5 | 0–7 | Under 5 | |
|---|---|---|---|---|
| Intervention Effect | 0.563* | 0.606 | 0.561* | 0.614 |
| (−2.33) | (−1.39) | (−2.36) | (−1.36) | |
| Year | 1.121 | 0.804 | 1.143 | 0.813 |
| (0.52) | (−0.62) | (0.62) | (−0.59) | |
| Treatment status | 0.922 | 0.896 | 0.900 | 1.114 |
| (−0.28) | (−0.26) | (−0.43) | (0.33) | |
| Age in months | 1.870* | 1.282 | 1.962* | 1.315 |
| (under 1 year) | (2.08) | (0.65) | (2.25) | (0.72) |
| Age in months | 2.075*** | 1.488 | 2.142*** | 1.479 |
| (1 year—under 3) | (3.85) | (1.61) | (4.01) | (1.59) |
| Age in months | 1.263 | 1.289 | – | |
| (3 years—under 5) | (1.58) | (1.71) | ||
| Sex | 0.737* | 0.666* | 0.752* | 0.714 |
| (−2.28) | (−1.96) | (−2.13) | (−1.65) | |
| Orphan | 1.012 | 0.891 | 0.916 | 0.828 |
| (0.08) | (−0.47) | (−0.54) | (−0.78) | |
| Child/grandchild | 0.992 | 0.729 | 0.962 | 0.731 |
| (−0.03) | (−0.72) | (−0.15) | (−0.72) | |
| Female household head | 1.158 | 1.035 | 1.035 | 1.002 |
| (0.82) | (0.14) | (0.19) | (0.01) | |
| Age of household head | 1.006 | 0.998 | 1.008 | 1.001 |
| (0.93) | (−0.20) | (1.24) | (0.11) | |
| Household head education | 1.024 | 1.017 | 1.026 | 1.021 |
| (1.09) | (0.55) | (1.19) | (0.69) | |
| Rural | 1.830** | 1.943* | 1.665* | 1.807* |
| (2.69) | (2.17) | (2.30) | (1.98) | |
| Mosquito net | 0.927 | 1.016 | 0.933 | 1.003 |
| (−0.45) | (0.07) | (−0.42) | (0.01) | |
| Unprotected/open water source | 1.013 | 0.706 | 1.000 | 0.701 |
| (0.07) | (−1.40) | (0.00) | (−1.44) | |
| Poor cook fuel quality | 0.747 | 0.685 | 0.777 | 0.703 |
| (−0.82) | (−0.79) | (−0.71) | (−0.74) | |
| Crowding index | 0.918* | 0.925 | 0.946 | 0.943 |
| (−2.37) | (−1.55) | (−1.48) | (−1.15) | |
| Asset/wealth index | 0.915 | 0.882 | 0.905 | 0.878 |
| (−1.66) | (−1.47) | (−1.86) | (−1.52) | |
| Food insecurity | 1.281 | 1.229 | 1.278 | 1.230 |
| (1.45) | (0.85) | (1.44) | (0.85) | |
| Food expenditures | 1.000 | 1.000 | 1.000 | 1.000 |
| (0.06) | (0.80) | (0.18) | (0.81) | |
| Food variety | 1.017 | 1.045 | 1.020 | 1.047 |
| (0.89) | (1.56) | (1.06) | (1.62) | |
| Distance to treatment | – | – | ||
| Medical Expenditures | – | – | ||
| Dependency ratio | 1.516 | 1.656 | ||
| (1.46) | (1.22) | |||
| Dependency ratio * Treatment | 0.970 | 1.019 | ||
| (−0.09) | (0.04) | |||
| Small household | 1.711 | 2.318 | ||
| (1.73) | (1.86) | |||
| Small household * Treatment | 0.968 | 0.385 | ||
| (−0.09) | (−1.76) | |||
| N | 920 | 410 | 921 | 410 |
Notes: Exponentiated coefficients; t statistics in parentheses. Fever estimated with 10 integration points.
P < 0.05, **P < 0.01, ***P < 0.001.
Causal mechanisms
We conduct additional analysis to determine whether there were significant changes in living conditions—for instance, the purchase of bednets, better cook stoves or fuel, or water source. There were no changes the first three factors, which could change with improvements in the economic situation. Water sourcing may be difficult to improve, as it is correlated with community-level wealth—few households are able to afford the capital costs of constructing separate water tanks.
We also examine whether changes in dietary diversity were associated with improvements in children’s health. Good diet diversity was represented by household spending on four or more food groups. This comprised 64% of the sample, while 36% had poor diets. Again, we found no significant differences.
Limitations
A few data issues are worthy of mention. For instance, information on the distance to the nurse was only available for one time period. In Kenya and other countries, seeking care from nurses may be more common than from doctors in cases dealing with malaria, pneumonia, or diarrhoea. We instead use distance to simple malaria treatment as a proxy because simple malaria treatment is often adequate, whereas complicated cases requiring advanced treatment are less likely.
Post-election violence coincided with the follow up data collection, resulting in 18% attrition between the waves (an 86% response rate for the treatment group, 77% for control). Attrition mostly occurred from Kisumu and Nairobi, which experienced the most violence during that time. Handa et al. (2015) test whether systematic attrition exists within the data by interacting a measure for attrition against socioeconomic, regional, and treatment assignment indicators and found no statistically significant differences. This, however, does not rule out systematic attrition on unobservable characteristics which could lead to bias in impact estimates. On the other hand, program targeting is supply-driven and take-up is universal, which reduces the risk that unobserved factors are determining enrollment into the program.
The differences at the baseline are also worth further explanation, as imbalances between the two groups may bias impact estimates if the groups are dissimilar on attributes other than assignment to treatment status. Within treatment locations, programmatic considerations led program managers to prioritize households headed by elderly females into the treatment arm when program resources exceeded the budget for each location. This led to differences between household demographical characteristics, for example on head of household attributes, but no differences between socioeconomic characteristics of the treatment arms. It is important to note that while control households may be more diverse demographically, they were program eligible and would have otherwise been included in the program had program resources been available. We include these household head characteristics in the analysis to control for differences. Furthermore, a separate analysis using 34 economic, demographic, and infrastructure variables was conducted to examine whether the balance was attained at the level of randomization (Handa et al. 2015). This analysis found no statistical differences between the 14 clusters of each treatment arm, suggesting that there are no selection issues at the location level, the level of randomization.
Discussion
The findings are consistent with the cash transfer evidence from Zambia and Malawi. Program enrolled children ages 0–7 years old are enjoying protection against malaria or pneumonia (P < 0.05). However, the impacts depend on age and sex - older children and males are benefiting more from the program’s impact on health-related investments than under-5s. One factor that could explain the lack of effect for non-school age children (under-5s) is that the small sample size may be insufficient to detect significant differences between the treatment groups. Boys in the intervention households experience a much stronger effect than girls, even after controlling for household-level differences. Consumption and expenditure data was not disaggregated at the individual-level, which would have provided greater precision for our hypothesis that nutritional changes may be driving the health status differences.
The results for health seeking show protective but insignificant effects, which are similar to the results found in the Zambia study. The results from the under-5 health seeking respondents are inconclusive, which may also be due to small sample size. However, the descriptive statistics indicate that the program was associated with an increase in health expenditures. This suggests that while the program does not increase true curative care, health seeking through other providers such as private pharmacies may have increased.
Conclusion
The Kenya CT-OVC is associated with positive impacts on children’s upper respiratory illness for children 0–7 years old. These findings are significant because they are not the primary beneficiaries the program was designed to support. Children under-5 years of age comprised 19% of the sample of all children present during the baseline, while children 10–18 years of age comprised 48% of all children. Had data been available, another angle for exploration would be the comparison of health outcomes with children of this older age group to determine whether children of all ages were benefitting equally or those receiving investments in their education were receiving more benefit.
While the health seeking results were inconclusive, another theme that arises from the data is the reality of care seeking in Kenya. Many respondents sought care from non-ideal health providers such as friends, private pharmacists, and shops rather than facility-based providers. We were unable to determine whether this was due to the severity of the child’s illness, quality issues at health facilities, or the lack of knowledge pertaining standard care seeking practices. In all instances, a serious illness could not be diagnosed appropriately by non-ideal providers.
The Kenya CT-OVC has been associated with wide-ranging impacts, including delaying sexual debut (Handa et al. 2014), decreases in young age pregnancy (Handa et al. 2015), improvements in mental health (Kilburn et al. 2016), increases in investment spending on food and health (The Kenya CT-OVC Evaluation Team, 2012b), improved school outcomes (The Kenya CT-OVC Evaluation Team, 2012a), and increased labour supply (Asfaw et al. 2014). The presence of reductions in children’s morbidity illustrates that the program is capable of promoting multi-dimensional wellbeing, even in the absence of conditionality. The literature from social cash transfer schemes across SSA illustrates that unconditional programs can be an important way to improve children’s outcomes. While more could be done to promote care seeking and under-5 and girls’ health, it is unknown how conditioning on health-related outcomes would impact the broad array of other investment behaviours. Nonetheless, our findings reveal that social cash transfers are a promising avenue to bolster the human capital investment behaviours of poor households.
Conflict of interest statement. None declared.
Acknowledgements
The authors wish to thank the Technical Working Group of the Children's Department, Ministry of Gender, Children and Social Development, Government of Kenya, and to Daniel Musembi in particular, for support to the follow-up study of the Cash Transfer-Orphans and Vulnerable Children. The authors also wish to recognize Dr. Suchindran Chirayath for his methodological expertise, which guided this study’s estimation strategy. This study was approved by the Kenya Medical Research Institute Ethics Review Committee (Protocol #265) and the Institutional Review Board of the University of North Carolina. This work was supported by the U.S. National Institute of Mental Health [Grant Number 1R01MH093241] and the Eunice Kennedy Shriver National Institute of Child Health and Development [R24 HD050924] to the Carolina Population Center. The views and opinions expressed in this article are those of the authors and do not necessarily reflect the official policy or position of the U.S. Department of Labor or any agency of the U.S. government. Assumptions made within the analysis are not reflective of the position of any U.S. government entity.
References
- Asfaw S, Davis B, Dewbre J, Handa S, Winters P.. 2014. Cash Transfer Programme, Productive Activities and Labour Supply: Evidence from a Randomised Experiment in Kenya. The Journal of Development Studies 50: 1172–96. [DOI] [PMC free article] [PubMed] [Google Scholar]
- Attanasio O, Gomez LC, Heredia P, Vera-Hernandez M.. 2005. The short-term impact of a conditional cash subsidy on child health and nutrition in Colombia. Report Summary: Familias 3. [Google Scholar]
- Black RE, Cousens S, Johnson HL. et al. 2010. Global, regional, and national causes of child mortality in 2008: a systematic analysis. Lancet 375: 1969–87. [DOI] [PubMed] [Google Scholar]
- Blank L, Devereux S, Handa S.. 2010. Social Protection for Africa’s Children In: Handa S, Webb D (eds.) Social Protection for Africa's Children. New York, NY: Routledge. [Google Scholar]
- Bobonis GJ, Miguel E, Puri-Sharma C.. 2006. Anemia and school participation. Journal of Human Resources 41: 692–721. [Google Scholar]
- Gabrysch S, Cousens S, Cox J, Campbell OMR.. 2011. The influence of distance and level of care on delivery place in rural Zambia: a study of linked national data in a geographic information system. PLoS Medicine 8: e1000394. doi:10.1371/journal.pmed.1000394. [DOI] [PMC free article] [PubMed] [Google Scholar]
- Gertler P. 2004. Do conditional cash transfers improve child health? Evidence from PROGRESA's control randomized experiment. American Economic Review 94: 336–41. [DOI] [PubMed] [Google Scholar]
- Handa S, Halpern CT, Pettifor A, Thirumurthy H.. 2014. The Government of Kenya’s Cash Transfer Program reduces the risk of sexual debut among young people age 15–25. PLoS One 9: e85473. Doi:10.1371/journal.pone.0085473. [DOI] [PMC free article] [PubMed] [Google Scholar]
- Handa S, Peterman A, Huang C. et al. 2015. Impact of the Kenya cash transfer for orphans and vulnerable children on early pregnancy and marriage of adolescent girls. Social Science & Medicine 131: 36–45. [DOI] [PMC free article] [PubMed] [Google Scholar]
- Herrera MG, Nestel P, Weld L. et al. 1992. Vitamin A supplementation and child survival. The Lancet 340: 267–71. [DOI] [PubMed] [Google Scholar]
- Kilburn K, Thirumurthy H, Halpern CT, Pettifor A, Handa S.. 2016. Effects of a large-scale unconditional cash transfer program on mental health outcomes of young people in Kenya: a cluster randomized trial. The Journal of Adolescent Health 58: 223–229. [DOI] [PMC free article] [PubMed] [Google Scholar]
- The Kenya CT-OVC Evaluation Team. 2012a. The impact of Kenya’s cash transfer for orphans and vulnerable children on human capital. Journal of Development Effectiveness 4: 38–49. [Google Scholar]
- The Kenya CT-OVC Evaluation Team. 2012b. The impact of the Kenya Cash Transfer Program for orphans and vulnerable children on household spending. Journal of Development Effectiveness 4: 9–37. [Google Scholar]
- Kenya National Bureau of Statistics (KNBS), ICF Macro. 2010. Kenya Demographic and Health Survey 2008-09. Calverton, Maryland: KNBS and ICF Macro. [Google Scholar]
- Kvalsvig JD, Cooppan RM, Connolly KJ.. 1991. The effects of parasite infections on cognitive processes in children. Annals of Tropical Medicine and Parasitology 85: 551–68. [DOI] [PubMed] [Google Scholar]
- Liu L, Johnson HL, Cousens S. et al. 2012. Global, regional, and national causes of child mortality: an updated systematic analysis for 2010 with time trends since 2000. The Lancet 379: 2151–61. [DOI] [PubMed] [Google Scholar]
- Luseno WK, Singh K, Handa S, Suchindran C.. 2013. A multilevel analysis of the effect of Malawi’s Social Cash Transfer Pilot Scheme on school-age children’s health. Health Policy and Planning 29: 421–32. [DOI] [PMC free article] [PubMed] [Google Scholar]
- Miguel E, Kremer M.. 2004. Worms: identifying impacts on education and health in the presence of treatment externalities. Econometrica 72: 159–217. [Google Scholar]
- Miller C, Tsoka M, Reichert K.. 2008. Impact evaluation report: External evaluation of the Mchinji social cash transfer pilot.
- Mosley WH, Chen LC.. 1984. An analytical framework for the study of child survival in developing countries. Population and Development Review 10: 25–45. [PMC free article] [PubMed] [Google Scholar]
- Mulholland E, Smith L, Carneiro I. et al. 2008. Equity and child survival strategies. Bulletin of the World Health Organization 86: 399–407. [DOI] [PMC free article] [PubMed] [Google Scholar]
- Mwasiaji W. 2015. Scaling up Cash Transfer Programmes in Kenya. International Policy Centre for Inclusive Growth. One page No. 286. IPC-IG, Brasilia, Brazil.
- Nankabirwa J, Wandera B, Kiwanuka N. et al. 2013. Asymptomatic Plasmodium infection and cognition among primary schoolchildren in a high malaria transmission setting in Uganda. The American Journal of Tropical Medicine and Hygiene 88: 1102–8. [DOI] [PMC free article] [PubMed] [Google Scholar]
- Okwaraji Y, Cousens S, Berhane Y. et al. 2012. Effect of geographical access to health facilities on child mortality in rural Ethiopia: A communty based cross sectional study. PloS One 7: e33564. [DOI] [PMC free article] [PubMed] [Google Scholar]
- Oxford Policy Management. 2010. Cash Transfer Programme for Orphans and Vulnerable Children (CT-OVC), Kenya: Operational and Impact Evaluation, 2007-2009.
- Pelletier DL, Frongillo EA.. 2003. Changes in child survival are strongly associated with changes in malnutrition in developing countries. The Journal of Nutrition 133: 107–19. [DOI] [PubMed] [Google Scholar]
- Rabe-Hesketh S, Skrondal A.. 2012. Gllamm companion for Multilevel and Longitudinal Modeling Using Stata. 3rd ed Volume I: Continuous Responses. College Station, TX: Stata Press. [Google Scholar]
- Schultz TP. 1988. Education investments and returns In: Chenery H, Srinivasan TN (eds). Handbook of Development Economics, Volume 3 Amsterdam: North Holland Press, 544-621. [Google Scholar]
- Stock R. 1983. Distance and the utilization of health facilities in rural Nigeria. Social Science & Medicine 17: 563–70. [DOI] [PubMed] [Google Scholar]
- UNICEF. Kenya at a Glance. Accessed at: http://www.unicef.org/kenya/overview_4616.html.
- United Nations Development Programme 2014. Human Development Index [Data file]. Retrieved from http://hdr.undp.org/en/data.
- Victora CG, Wagstaff A, Schellenberg JA. et al. 2003. Applying an equity lens to child health and mortality: more of the same is not enough. The Lancet 362: 233–41. [DOI] [PubMed] [Google Scholar]
- World Health Organization. 2000. Global Water Supply and Sanitation Assessment 2000 Report.
- World Health Organization. 2005. The World Health Report 2005: Make every mother and child count.
- World Health Organization. 2013. World Malaria Report 2013.