

Abstract
Maternally derived copy number gains of human chromosome 15q11.2-q13.3 (Dup15q syndrome or Dup15q) cause intellectual disability, epilepsy, developmental delay, hypotonia, speech impairments, and minor dysmorphic features. Dup15q syndrome is one of the most common and penetrant chromosomal abnormalities observed in individuals with autism spectrum disorder (ASD). Although ∼40 genes are located in the 15q11.2-q13.3 region, overexpression of the ubiquitin-protein E3A ligase (UBE3A) gene is thought to be the predominant molecular cause of the phenotypes observed in Dup15q syndrome. The UBE3A gene demonstrates maternal-specific expression in neurons and loss of maternal UBE3A causes Angelman syndrome, a neurodevelopmental disorder with some overlapping neurological features to Dup15q. To directly test the hypothesis that overexpression of UBE3A is an important underlying molecular cause of neurodevelopmental dysfunction, we developed and characterized a mouse overexpressing Ube3a isoform 2 in excitatory neurons. Ube3a isoform 2 is conserved between mouse and human and known to play key roles in neuronal function. Transgenic mice overexpressing Ube3a isoform 2 in excitatory forebrain neurons exhibited increased anxiety-like behaviors, learning impairments, and reduced seizure thresholds. However, these transgenic mice displayed normal social approach, social interactions, and repetitive motor stereotypies that are relevant to ASD. Reduced forebrain, hippocampus, striatum, amygdala, and cortical volume were also observed. Altogether, these findings show neuronal overexpression of Ube3a isoform 2 causes phenotypes translatable to neurodevelopmental disorders.
Introduction
Neurodevelopmental disorders, including autism spectrum disorder (ASD) and intellectual disability (ID), are prevalent and pervasive lifelong conditions. Maternally derived duplications or triplications of 15q11.2-q13.3 are one of the most penetrant copy number variants observed in individuals with ASD, accounting for up to ∼3% of ASD cases and causing Dup15q syndrome (1–3). Pronounced clinical features associated with Dup15q syndrome are ASD, ID, seizures, anxiety, global developmental delay, hypotonia, speech impairments, motor coordination deficits, and minor dysmorphic features (4–7).
The ubiquitin-protein E3A ligase gene (UBE3A) located within 15q11.2-q13.3 exhibits maternal-specific expression in neurons but is biallelically expressed in most other cell types (8–10). Of the imprinted genes located in 15q11.2-q13.3, UBE3A is expressed from the maternal allele in neurons whereas the other imprinted genes are exclusively expressed from the paternal allele (11,12). As such, maternally derived deletions or mutations that lead to a loss of expression or loss of function of UBE3A cause Angelman syndrome (AS), a severe neurodevelopmental disorder characterized by ID, epilepsy, ataxia, and an atypically happy disposition (13–18). Conversely, maternally inherited overexpression of UBE3A is currently thought to be the main pathological mechanism underlying Dup15q syndrome (5,7).
UBE3A may be a dosage-sensitive gene, with low or no UBE3A expression causing AS and elevated UBE3A expression causing most, if not all, of the symptoms seen in Dup15q syndrome, respectively. Interstitial duplications of 15q11.2-q13.1 often lead to a trisomy of the genes in the region and account for ∼20% of individuals with Dup15q syndrome. Conversely, isodicentric duplications of the region lead to a tetrasomy or, in some instances, a hexasomy of the region and account for 80% of affected individuals (6). The severity of symptoms associated with Dup15q syndrome correlates with the number of copies of the region, with interstitial duplications causing mild to moderate phenotypes, and isodicentric duplications causing more severe phenotypes, which further suggests that elevated UBE3A levels in the brain cause some of the neurological dysfunction in Dup15q syndrome (19). Studies of Ube3a in a variety of species including fly and mouse models also support the notion that Ube3a is dosage sensitive (20–24). Furthermore, reductions of UBE3A levels in a Dup15q neuronal cell culture model have been shown to normalize expression levels of several key synaptic molecules (25). The idea that overexpression of UBE3A plays a major pathogenic role in neurodevelopmental dysfunction is further supported by the recent discovery of an individual with developmental delay carrying a maternally inherited duplication of only the UBE3A gene (26).
The UBE3A gene encodes a ubiquitin-protein E3A ligase that functions as a member of the ubiquitin proteasome system, as a coactivator of nuclear steroid hormone receptors, and, at least in the mouse, as a competing endogenous RNA (27–32). Neuron-specific functions of Ube3a include a role in regulation of synaptic plasticity (15), dendrite polarization and morphogenesis (33), dendritic spine morphology and density (34), and actin cytoskeleton remodeling (22). Numerous potential cytoplasmic and nuclear targets of UBE3A have been identified, but the exact mechanism by which UBE3A protein regulates brain function through these pathways is poorly understood. In the human brain, UBE3A expresses at least eight alternatively spliced transcripts that encode three protein isoforms differing at the N-terminus (31,35). In the mouse, Ube3a expresses at least three alternatively spliced transcripts through alternative splicing of upstream exons and the use of an alternative intronic polyadenylation site (33,35). Biochemical studies of varying AS causing mutations indicate that loss of UBE3A ligase activity is sufficient to cause the disorder (17,36,37); however, none of the UBE3A substrates identified to date have fully explained the spectrum of phenotypes. The functional importance of each Ube3a/UBE3A isoform in the brain is poorly understood, but there is evidence that each isoform has a distinct functional property in neurons or, perhaps, other cell types in the brain. Miao et al. (2013) showed that Ube3a isoform 2 is required for the specification of apical dendrites and dendrite polarization in pyramidal neurons of the mouse cortex (33). Valluy et al. (2015) showed that Ube3a isoform 1 is expressed as a non-protein coding isoform in the brain that functions as a competing endogenous RNA to regulate dendritic spine development by sequestering mir-134, which inhibits translation of Limk1, a key enzyme in synaptogenesis (38). Although less is understood about the human UBE3A isoforms, Martinez-Noel et al. (2012) found that they associate with similar but also different protein complexes, suggesting that each isoform might regulate different pathways in the cell (39).
Towards the goal of determining the role of overexpression of UBE3A, we developed and characterized a transgenic mouse model designed to allow for spatial specific expression of Ube3a isoform 2 using the Tetracycline-Off system (Tet-Off) (40,41). We focused on Ube3a isoform 2 because it is highly conserved among vertebrates and plays a key role in neuronal development. We characterized the expression levels and cellular localization of the Ube3a isoform 2 transgene and examined neuroanatomical, behavioral, cognitive, and seizure phenotypes associated with overexpression of Ube3a isoform 2 in excitatory forebrain neurons. We discovered that transgenic mice overexpressing Ube3a isoform 2 in excitatory forebrain neurons exhibited robust anxiety-like behaviors, learning impairments, and reduced seizure thresholds. Moreover, imaging data revealed large reductions in forebrain, hippocampus, striatum, amygdala, and cortical volume.
Results
Development and validation of inducible Ube3a isoform 2 mouse model
To generate a mouse model overexpressing the Ube3a gene, we used the tetracycline-inducible system (Tet-Off), which involves the use of two independent transgenes: 1) the tetracycline transactivator (tTA) protein located downstream of a promoter of interest; and 2) a tetracycline-response-element (TRE) located upstream of a transgene of interest (41,42). In double transgenic mice (i.e., tTA;TRE), the tTA protein binds to the TRE and initiates transcription of the downstream transgene. Importantly, the tTA protein is maintained intracellularly, thus transcription of the TRE-transgene is only expressed in cells expressing the tTA protein. Additionally, transcription of TRE-transgene can be turned-off by administering tetracycline/doxycycline (DOX), which interacts with the tTA protein and inhibits it from binding to the TRE (Fig. 1A).
Figure 1.

Validation of inducible Ube3a isoform 2 (tTA/Ube3a-2) overexpression mouse model. (A) Schematic of the tetracycline inducible system to regulate Ube3a isoform 2 FLAG:Ube3a-2 expression in excitatory neurons. The inducible transgene contains a minimal cytomegalovirus promoter fused to multiple copies of the E. coli tet operator sequence (TRE) and an N-terminal FLAG epitope tagged to the cDNA sequence of Ube3a-2. The Ube3a-2 transgene is expressed by the tetracycline transactivator protein (tTA), which is under the control of the CamK2a promoter. Expression of the transgene can be inhibited by administering doxycycline. (B) Western blot of FLAG:Ube3a-2 expression levels among the three founder lines. FLAG:Ube3a-2 protein levels in the cortex were markedly different among the three lines. Mice derived from the 884 and 969 lines had significantly higher FLAG:Ube3a-2 relative to endogenous Ube3a in 883 founder line, tTA/+, and +/+;+/+. (C) TaqMan assay of Ube3a-2 RNA transcript levels in mouse cortex and lung. Double transgenic mice (white bars) show a significant increase in the expression level of Ube3a RNA in the cortex compared to +/+;+/ + (black bars, P≤0.05). In contrast, Ube3a-2 RNA levels in the lung were not significantly different between tTA/Ube3a-2 and +/+;+/+. (D) Western blot detecting transgenic FLAG:Ube3a-2 (upper band, 125kDa) compared to endogenous Ube3a (lower band, 95 kD) in cortex versus lung in +/+; +/+ versus tTA/Ube3a-2 tissue, using an anti-Ube3a antibody. (E, F) Western blot of Ube3a and GAPDH loading control in +/+; +/+ and tTA/Ube3a-2 cortex. The image illustrates four samples per experimental group, and shows significant increases in Ube3a-2 protein levels in the tTA/Ube3a-2 cortex. Endogenous levels of Ube3a remained unchanged in +/+; +/+ mice. (G, H) Western blot of Ube3a and GAPDH loading control in Saline and DOX treated +/+; +/+ and tTA/Ube3a-2 cortex. The image illustrates three cortex samples per experimental group, and shows the reversible properties of the model following 1 month of DOX treatment (8 mg/kg/day, p.o.) by strong reduction of Ube3a-2 protein in DOX treated tTA/Ube3a-2 (∼70% reduction) compared to vehicle controls in tTA/Ube3a-2 but not +/+; +/+ tissue. Endogenous Ube3a levels in +/+; +/+ were not affected by DOX treatment.
We first developed a TRE-transgene consisting of a 3X FLAG tag located upstream of the cDNA sequence of mouse Ube3a isoform 2 (TRE-FLAG:Ube3a-2). Founder lines (883, 884, and 969) carrying TRE-FLAG:Ube3a-2 transgene were then generated via pronuclear injection [FVB/N]. Each founder was expanded and then crossed with transgenic mice carrying a tTA transgene under the control of the calcium/calmodulin-dependent protein kinase type II alpha chain promoter (Camk2a-tTA [C57BL/6 J]), which expresses the tTA protein in excitatory forebrain neurons of the cortex and hippocampus (40,43). PCR genotyping reactions of offspring derived from heterozygous founders (Camk2a-tTA/+ x TRE-Ube3a-2/+) yielded the 4 expected genotypes: 1) double transgenic; Camk2a-tTA/+; TRE-Ube3a-2/+ (tTA/Ube3a-2), 2) Camk2a-tTA/+;+/+, 3) +/+;TRE-FLAG:Ube3a-2/+, and 4) +/+; +/+.
We next evaluated the expression levels of the TRE-FLAG:Ube3a-2 transgene among the 3 founder lines and examined the inducible and reversible properties of the Tet-Off system. In Camk2a-tTA/+;TRE-Ube3a-2/+ mice, hereafter referred to as tTA/Ube3a-2 mice, FLAG:Ube3a-2 protein levels in the cortex were markedly different among the 3 founder lines (Fig. 1B). Ube3a steady state RNA levels in cortex were significantly different (F(2, 9) = 85.2, P≤ 0.005, mixed effect ANOVA) among tTA/Ube3a-2 mice derived from the 884 and 969 lines and WT (tTA/+) mice, with significantly higher Ube3a RNA levels in the 884-tTA/Ube3a-2 mice compared to those in 969-tTA/Ube3a-2 (t(9) = 6.0, ≤0.005, Tukey HSD) and WT (t(9) = 13.1, P ≤ 0.005, Tukey HSD) mice. On average, Ube3a RNA levels were increased by approximately 3.8- and 2.5-fold in the cortices of 884-tTA/TRE-Ube3a-2 and 969-tTA/TRE-Ube3a-2 mice, respectively. Further analysis of the 884-tTA/Ube3a-2 mice revealed that FLAG:Ube3a-2 protein levels were significantly higher (t(8) = 16.8, ≤0.005, student t-test) than endogenous Ube3a protein levels in the cortex (Fig. 1C and D). Similar to the RNA levels of Ube3a, FLAG:Ube3a-2 levels were increased by approximately 3-fold. Examination of additional tissues showed that TRE-FLAG:Ube3a-2 transgene was expressed in cortex and hippocampus but not in the lungs (Fig. 1C and D) or in liver or cerebellum (data not shown).
Founder line 884 exhibited the highest level of Ube3a RNA expression and was thus used for the subsequent analyses. Figure 1E and F illustrates western blots of double transgenic mice that reproducibly demonstrate pronounced overexpression of FLAG:Ube3a-2, ∼7.5 greater (t(6) = 8.74, P ≤ 0.005, student t-test) in tTA/Ube3a-2 than +/+; +/+. After 1 month of DOX treatment (8 mg/kg/day, p.o), FLAG:Ube3a-2 protein levels were significantly lower in the DOX treated animals (∼70% reduction) compared to vehicle tTA/Ube3a-2 (Fig. 1G and H;t(4) = −11.85, P ≤ 0.005, student t-test). Endogenous Ube3a protein levels were not affected by DOX treatment (t(4) = 1.78, P > 0.05, student t-test).
Immunofluorescence imaging showed that the FLAG:Ube3a-2 protein was detected in Camk2a positive pyramidal neurons of the cortex and hippocampus, where it was primarily localized in the cytoplasm (Fig. 2A and D). The FLAG:Ube3a-2 protein was detected in cytoplasm using both an anti-FLAG transgene-specific antibody (FLAG) and anti-Ube3a antibody (Fig. 2E–H, control in Supplementary Material, Fig. S7A–D), confirming the expected cellular localization for Ube3a isoform 2. DAPI staining used to identify nuclei.
Figure 2.
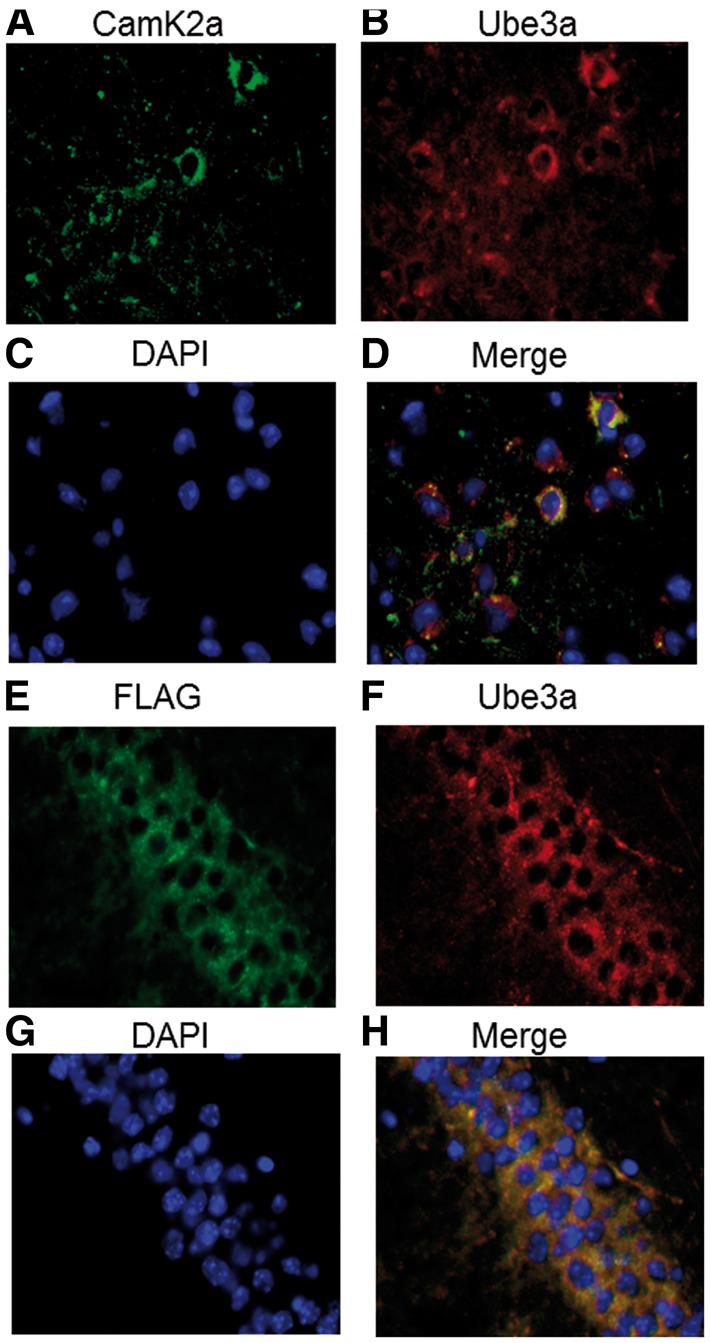
Cytoplasmic, neuronal expression of FLAG:Ube3a-2 in Camk2a excitatory neurons of the mouse brain. (A–D) Immunofluorescence images showing overexpressed cytoplasmic Ube3a protein in the cytoplasm of Camk2a neurons in the mouse cortex (tTA/Ube3a-2). (E–H) Immunofluorescence images showing FLAG:Ube3a-2 protein in the cytoplasm of pyramidal neurons in the hippocampus (tTA/Ube3a-2). DAPI staining used to identify nuclei.
Robust anxiety-like behaviors in tTA/Ube3a-2 mice
Anxiety-like behaviors were assessed in two gold-standard assays: elevated plus-maze and light ↔ dark conflict. As compared to +/+; +/+ (hereafter referred to as WT), tTA/Ube3a-2 mice made significantly fewer entries onto the open arms (Fig. 3A;t(23) = 2.54, P ≤ 0.05, student t-test) but a similar number of total arm entries calculated by open arm entries + closed arm entries (Fig. 3B;t(23) = 0.48, P > 0.05, student t-test). In the light ↔ dark conflict assay, tTA/Ube3a-2 mice made fewer transitions between chambers (Fig. 3C;t(23) = 2.16, P ≤ 0.05, student t-test), a parameter highly sensitive to benzodiazepines (44,45), and displayed a trend toward lower latencies to begin exploration (Fig. 3D;t(23) = 1.11, P > 0.05, student t-test), supporting a clear anxiety-like phenotype not confounded by sedation or motoric deficits. Developmental parameters and isolation-induced ultrasonic vocalizations (USVs) were analyzed for 3-min in tTA/Ube3a-2 and WT pups on postnatal days 5–11 (Supplementary Material, Fig. S1). Pup USVs are standard read outs of anxiety-like behavior, stress responsivity, and/or social communication (46–52). Supplementary Material, Figure S2 illustrates no hypo- or hyper-activating effects of genotype on open field exploratory locomotion in WT and tTA/Ube3a-2 mice during a 30-min session.
Figure 3.

Strong anxiety-like phenotypes in tTA/Ube3a-2 overexpression mice. Anxiety-like behaviors were assessed in two gold standard assays: elevated plus-maze and light ↔ dark conflict. (A) During the elevated plus-maze number of open arm entries were fewer in tTA/Ube3a-2 mice as compared to +/+; +/ + (WT); however, (B) WT and tTA/Ube3a-2 mice made a similar number of total arm entries (open arm entries + closed arm entries), indicating an anxiety-like phenotype not confounded by sedation or motoric deficits. (C) In the light ↔ dark conflict assay, tTA/Ube3a-2 mice made fewer transitions between chambers and (D) a trend toward shorter latencies to enter the dark chamber, again indicating an anxiety-like phenotype. A tertiary anxiety-like measurement was performed using the stress-induced hyperthermia assay, as this parameter is completely independent of locomotor activity. (E) Elevated stress-induced changes in body temperature were observed in tTA/Ube3a-2 mutants, compared to WT littermate controls, indicating more stress responsivity and hyper-reactivity, suggesting a greater basal level of anxiety. (F) Normal, heightened body temperature (°C) between first and second temperature assessments for both WT and tTA/Ube3a-2, confirmed typical physiological levels of stress were observed during the assay. *P≤0.05 versus WT by student’s unpaired t-tests, NS, non-significant. Replication with a second independent cohort of WT and tTA/Ube3a-2 yielded similar findings (Supplementary Material, Fig. S3).
A tertiary anxiety-like measurement was performed using a stress-induced hyperthermia assay, which is useful in measuring anxiolytic profiles because of its independence of motor abilities, sex and species. Greater elevations in stress-induced change in body temperature were observed in tTA/Ube3a-2 mice, compared to WT littermates (Fig. 3E;t(23) = 3.50, P ≤ 0.01, student t-test). As expected, normal elevations in body temperature were observed between T1 and T2 for both genotypes (Fig. 3F; WT: t(12) = 2.87, P ≤ 0.01; tTA/Ube3a-2: t(11) = 8.07, P ≤ 0.005, student t-tests). Collectively, these data indicate more stress responsivity, hyper-reactivity, and greater levels of anxiety-like behavior.
Replication with a second independent cohort of WT and tTA/Ube3a-2 mice on these three anxiety-like behavioral tasks yielded similar findings (Supplementary Material, Fig. S3).
Normal ASD-relevant behavioral phenotypes in tTA/Ube3a-2 mice
Behaviors relevant to ASD were assessed using two corroborating assays of social behavior, as described previously (53–57). Sociability scores from the automated three-chambered social approach task on the chamber time parameter in WT and tTA/Ube3a-2 showed typical, significant sociability (Fig. 4A; WT: F(1,12) = 8.73, P ≤ 0.05; tTA/Ube3a-2: F(1, 11) = 17.09, P ≤ 0.005, within genotype repeated measures ANOVA). Sexes were combined since no sex difference on time spent in the chamber was observed (F(1, 23) = 0.12, P > 0.05, ANOVA). Additionally, both genotypes exhibited significantly more time social sniffing, which was defined as time spent within 2-cm of the wire cup, with the head facing the wire cup containing the stimulus mouse, as compared to the time spent sniffing the novel object, using the same body point detection settings, (Fig. 4B; WT: F(1, 12) = 40.32, P ≤ 0.005; tTA/Ube3a-2: F(1, 11) = 6.46, P ≤ 0.05, within genotype repeated measures ANOVA). No sex difference on time spent sniffing the novel mouse or novel object was observed (F(1, 23) = 2.61, P > 0.05, ANOVA). Consistent with earlier reports on other genetic mutant models, sex differences in social approach behavior are rarely observed (50,58–60).
Figure 4.

Normal ASD-relevant social and repetitive behavioral phenotypes in tTA/Ube3a-2 overexpression mice. WT and tTA/Ube3a-2 littermate controls both met the definition of sociability on the three- chambered social approach test. (A) Time spent in the novel mouse chamber versus the object chamber, as well as, (B) time spent sniffing the novel mouse versus object were statistically significant for both WT and tTA/Ube3a-2 mice using a within genotype paired t-test. (C) No significant difference was identified between WT and tTA/Ube3a-2 on the number of transitions between chambers, confirming no locomotor confound during this complex behavioral readout. (D) Male subjects during the male-female reciprocal social interaction illustrated clear, strong sociability in both WT and tTA/Ube3a-2 using standard readouts of duration of time spent in anogenital sniffing behavior, (E) nose-to-nose sniffing, and (F) time spent following. (G) Exploration during the assay was unaffected by genotype. (H) Interestingly, ultrasonic vocalizations during male-female social interaction were significantly higher in the tTA/Ube3a-2 mice compared to the WT control. (I) Cumulative time spent self-grooming did not differ between tTA/Ube3a-2 and WT. *P≤0.05 versus WT by repeated measures ANOVA or student’s unpaired t-test, NS, non-significant. Replication with a second independent cohort of WT and tTA/Ube3a-2 on the three-chambered approach task yielded similar findings (Supplementary Material, Fig. S4). The pup isolation ultrasonic vocalization paradigm is presented in Supplementary Material, Figure S1.
Number of entries into the side chambers was not affected by genotype (Fig. 4C;F(1,23) = 0.34, P > 0.05, within genotype repeated measures ANOVA), indicating that overexpression of Ube3a-2 had no effect on general exploratory activity throughout the 3-chambered apparatus during the social approach assay. No innate side preference was present during the habituation phase using the time in chamber parameter (data not shown; F(1, 23) = 0.85, P > 0.05, ANOVA), nor on the entries into the left or right chambers parameter (data not shown; F(1, 23) = 1.18, P > 0.05, ANOVA).
No social deficits were observed on investigative or social parameters in male tTA/Ube3a-2 during the male-female reciprocal dyad social interaction test. Figure 4D–F illustrates a detailed examination of male-female social interaction parameters during a session of reciprocal interactions between male WT and tTA/Ube3a-2 subject mice paired with an unfamiliar estrous B6 female. No genotype difference between WT and tTA/Ube3a-2 was detected on duration of time spent nose-to-anogenital sniffing (Fig. 4D;t(11) = 0.89, P > 0.05, student t-test), nose-to-nose sniffing (Fig. 4E;t(11) = 0.81, P > 0.05, student t-test), and following behavior (Fig. 4F;t(11) = 0.15, P > 0.05, student t-test). Levels of investigation of these parameters were comparable and consistent with earlier findings (61).
Normal social behaviors were replicated with a second independent cohort of WT and tTA/Ube3a-2 mice (Supplementary Material, Fig. S4).
Self-grooming is a complex innate behavior with an evolutionarily conserved sequencing pattern and is one of the most frequently performed behavioral activities in rodents. Analysis of self-grooming is a useful measure of repetitive behavior in models of neurodevelopmental disorders with high repetitive behaviors (62,63). No difference between WT and tTA/Ube3a-2 was observed on spontaneous motor stereotypies, such as repetitive self-grooming behavior (Fig. 4I;F(1, 21) = 1.22, P > 0.05, ANOVA). Sexes were combined as no sex difference on this assay was observed (Self-groom: F(1, 21) = 3.34, P > 0.05, ANOVA).
Deficits in contextual but not cued Pavlovian learning in tTA/Ube3a-2 mice
Fear conditioning to either a cue or a context represents a form of associative learning that has been used in many species (64,65). Learning and memory was evaluated using two components, a 24-h contextual component and a 48-h cued fear conditioning. High levels of freezing were observed, subsequent to the conditioned stimulus (CS) – unconditioned stimulus (UCS) pairings, on the training day, across both genotypes (WT: main effect of training, F(1,12) = 35.47, P ≤ 0.005; tTA/Ube3a-2: main effect of training F(1, 12) = 48.35, P ≤ 0.005). No significant effects of genotype were detected on freeze scores during the pre-training (Fig. 5A;F(1, 23) = 0.58, P > 0.05, repeated measures ANOVA) and post-training sessions (Fig. 5A;F(1, 23) = 1.31, P > 0.05, repeated measures ANOVA), showing no confounds and no deficits in the learning of the associations between the stimulus and cues. 24-h following CS-UCS training tTA/Ube3a-2 exhibited less freezing (Fig. 5B;t(22) = 4.95, P ≤ 0.05, student t-tests) when placed in the context chamber from conditioning training with identical stimulus cues (olfactory, light, arena shape, and floor texture), which suggested Ube3a-2 overexpression of isoform 2 causes recall or memory deficits.
Figure 5.

Learning and memory deficits in tTA/Ube3a-2 overexpression mice. Learning and memory was evaluated using two components, contextual cues and an auditory tone, with assessments of freezing time before and after the presentation of three tone-shock pairings. (A) Normal levels of freezing post-training indicate associations between tone and shock were made in all genotypes. In addition, both genotypes showed typical basal levels of freezing suggesting no confounds of deficits in sensory reactivity or pain threshold. (B) 24-h contextual component illustrated that tTA/Ube3a-2 mice exhibited less freezing, indicating deficits in contextual learning and memory. (C) Normal cued conditioning freeze time 48 h after initial training, before and after, the presentation of three tone-cues is illustrated between the WT and tTA/Ube3a-2. *P≤0.05 versus WT by student’s unpaired t-tests. Replication with a second independent cohort of WT and tTA/Ube3a-2 on contextual and cued fear conditioning yielded similar findings (Supplementary Material, Fig. S5). There were no confounds of TRE-FLAG or tTA-+/- expression in contextual fear conditioning tests (Supplementary Material, Tables S2 and S3).
Although the responses leading to behavioral freezing elicited by contextual and cued CSs are identical, the information processing demands underlying the two forms of fear conditioning are different (66). In contextual conditioning, the CS is not restricted to a single sensory modality and contexts are continuously present versus the precise, time-dependent manner of the tone presentations. Levels of freezing, between the pre- and post-cue presentation 48 h after training, revealed significant main effects of cued training (WT: main effect of cue, F(1, 12) = 48.35, P ≤ 0.005; tTA/Ube3a-2: main effect of cue F(1, 11) = 33.79, P ≤ 0.005). A trend but not a significant effect of genotype was detected on freeze scores during the post-cue exposure (Fig. 5C;F(1, 23) = 2.40, P = 0.13, repeated measures ANOVA). Strong differences between tTA/Ube3a-2 on contextual but not cued fear conditioning indicate deficits in learning and memory, without motoric confounds, which are likely caused by abnormalities in the hippocampus.
Replication with a second cohort of WT and tTA/Ube3a-2 yielded similar findings, including deficits in contextual but not cued conditioned learning (Supplementary Material, Fig. S5).
In extension of published data from Han et al. (2012), we found that expression of the Camk2a-tTA/+;+/+ transgene alone did not elicit anxiety-like behaviors or learning memory deficits (Supplementary Material, Table S2) (67). Similarly, as an additional control group, we found that expression of the TRE-Ube3a isoform 2;+/+ transgene alone did not elicit anxiety-like behaviors or learning memory deficits (Supplementary Material, Table S3).
Lower seizure threshold in tTA/Ube3a-2 isoform specific overexpression mouse model
Seizures were provoked using pentylenetetrazol (PTZ; 80 mg/kg, i.p.) in tTA/Ube3a-2 and WT littermate control mice. Latencies to myoclonic jerk, generalized clonic seizure (loss of righting reflex), and tonic extension were collected as a preliminary characterization of seizure and subthreshold epileptiform activity. Figure 6A is representative electroencephalographic (EEG) traces of PTZ-induced seizures in a representative WT subject, highlighting that WT does not reach a generalized status epilepticus seizure and survives this chemoconvulsant insult for >10 min. The lower panel illustrates a representative tTA/Ube3a-2 mouse rapidly achieving robust, high Racine ranked seizures, tonic hindlimb extension and death within 10-min post-administration. Faster onset to a generalized clonic seizure (Fig. 6B;t(1, 21) = 2.77, P ≤ 0.05, student t-test) and reduced latencies to tonic extensions and death were discovered in tTA/Ube3a-2 compared to WT mice (Fig. 6C;t(1, 21) = 2.85, P ≤ 0.05, student t-test).
Figure 6.

Behavioral assessment of seizure threshold in tTA/Ube3a-2 overexpression mice. (A) Representative electroencephalographic (EEG) traces of pentylenetetrazol (PTZ) induced seizures. The upper panel shows EEG confirmation of behavioral activity following a 80 mg/kg dose of PTZ, i.p. in a representative WT subject, highlighting that WT does not reach a generalized status epilepticus seizure and survives this chemoconvulsant insult. The lower panel illustrates a representative tTA/Ube3a-2 that rapidly achieved robust, high Racine ranked seizures, tonic hindlimb extension and death within 10-min post-administration. In an independent cohort, seizures were provoked using pentylenetetrazol (PTZ; 80 mg/kg; i.p.) in tTA/Ube3a-2 and WT littermates. Latencies to myoclonic jerk, latency to loss of righting reflex/generalized seizure, and tonic extension were collected as preliminary characterization parameters of seizure and epileptiform activity. (B) tTA/Ube3a-2 mice exhibited faster seizure onsets and (C) reduced latencies to tonic extensions and death. *P≤0.05 versus WT by student’s unpaired t-test. Replication with a second independent cohort of WT and tTA/Ube3a-2 on behavioral seizure threshold yielded similar findings (Supplementary Material, Fig. S6).
Replication with a second cohort of WT and tTA/Ube3a-2 mice yielded similar findings, including reduced latencies to myoclonic jerk and strong trends toward reduced latencies to first generalized clonic seizure and tonic extension, which corroborate our results (Supplementary Material, Fig. S6).
Reduced brain volumes by magnetic resonance imaging
Total brain volumes were smaller in the tTA/Ube3a-2 mice compared to WT littermate controls (−4.97%, FDR ≤ 0.001). Figure 7A–F highlights significant differences found for 6 of 7 summary regions ranging from −2 to −4%, excluding the cerebellum (P > 0.05). Volume reductions were discovered in cortex (−3.81%, FDR ≤ 0.01), hippocampus (−5.45%, FDR ≤ 0.01), amygdala (−6.97%, FDR ≤ 0.01), and striatum (−12.31%, FDR ≤ 0.01). As expected, there was no effect on volume of the cerebellum between genotypes (−2.38%, P > 0.05). Threshold for significance used a FDR of 5%. Supplementary Material, Table S1 outlines a comprehensive list of regions analyzed for brain regional volume. In our analysis, comparisons were made with absolute volume in seven different summary regions (cortex, cerebellum, brainstem, ventricles, olfactory, cerebral white matter and gray matter). In addition to the summary regions, 159 independent brain regions were assessed with divisions across the cortex, subcortical areas, and cerebellum (68–70). Of the 159 different regions, 70 were found to be significantly different (FDR of ≤0.05). In all of these regions, the tTA/Ube3a-2 mice were decreased in size compared to WT. The largest decreases were seen within the hippocampus and the striatum. In the high-resolution three-dimensional mouse brain atlas by Dorr et al. (2008), the hippocampus is divided into three different sections, namely the hippocampus proper, the dentate gyrus, and the granular layer (68). Interestingly in the tTA/Ube3a-2 mice, the dentate gyrus and granular layer were decreased by 14–16%, whereas the hippocampus proper was only decreased by 5%. This stemmed from a significant voxelwise increase in the CA3 of the hippocampus (Fig. 7). Figure 7 highlights brain volume reductions in cortex (−3.81%, FDR ≤ 0.01), hippocampus (−5.45%, FDR ≤ 0.01), striatum (−12.31%, FDR ≤ 0.01), and amygdala (−6.97%, FDR ≤ 0.01). As expected, due to neuron-specific Ube3a-2 overexpression in the hippocampus and cortex, there was no effect on volume of the cerebellum between genotypes (−2.38%, P > 0.05).
Figure 7.

Neuroanatomical pathology in tTA/Ube3a-2 overexpression mice. Neuronal forebrain overexpression of Ube3a isoform 2 causes structural neuroanatomical phenotypes compared to WT littermate sex and aged matched controls. The left panel illustrates representative coronal slice series, highlighting significant differences in absolute volume (mm3) between the tTA/Ube3a-2 mice versus WT. Less volume or smaller = dark blue-light blue. Increased volume or larger = red-yellow. (A) MRI revealed numerous global alterations, such that total brain volume was decreased by (−4.97%, FDR≤0.001) in the tTA/Ube3a-2 mice compared to WT. For all of the summary regions, tTA/Ube3a-2 mice had significantly smaller volumes compared to WT. (B) Volume reductions in cortex (−3.81%, FDR≤0.01), (C) hippocampus (−5.45%, FDR≤0.01), (D) amygdala (−6.97%, FDR≤0.01), and (E) striatum (−12.31%, FDR≤0.01). (F) As expected, there was no effect on volume of the cerebellum between genotypes (−2.38%, P>0.05). Threshold for significance used a FDR of 5%. Supplementary Material, Table S1 outlines a comprehensive list of regions analyzed for brain regional volume.
Discussion
Mouse models are essential tools for studying etiologies of neurodevelopmental disorders and for discovering novel intervention targets, with the highest level of specificity. Therefore, it is imperative that our understanding of functional outcomes, attributable to key regulatory molecules, like UBE3A, is precise. We developed, generated and characterized a new mouse model overexpressing Ube3a isoform 2 (analogous to human UBE3A isoform 3) in Camk2a-+ positive neurons using the tetracycline-inducible (Tet-off) expression system. This new model is critical to our understanding of how changes in Ube3a levels in neurons result in a range of behavioral phenotypes. The validation studies shown here confirm that we can indeed significantly raise the level of Ube3a protein in neurons by as much as 5-fold (Fig. 1F), that the FLAG:Ube3a isoform 2 protein is properly localized to the cytoplasm in hippocampal neurons (Fig. 2), and that these molecular changes in expression result in measurable and translationally relevant behavioral phenotypes.
Mice overexpressing Ube3a isoform 2 in excitatory forebrain neurons (tTA/Ube3a-2) exhibited normal growth in the first 2 weeks of postnatal life but emitted fewer ultrasonic vocalizations than WT pups at both earlier and later developmental points, indicating potential abnormalities in stress responsivity and/or social communication. Ability to thrive, general motor, and explorative abilities in the transgenic mice were all typical. Several strong, reproducible behavioral phenotypes were observed and reproduced, including anxiety-like behavior, cognitive impairments, and most notably, reduced seizure thresholds (i.e., seizure susceptibility).
Seizures occur in approximately 60% of individuals with Dup15q syndrome (71). The proconvulsant PTZ, a non-competitive GABA antagonist, is routinely used to assess excitability of the brain and induce absence-seizures at low doses, or convulsion jerks and generalized tonic-clonic convulsive seizures at higher dose (72). We observed faster onsets to multiple parameters in behavioral seizure quantification, including time to first myoclonic jerk and tonic-clonic seizure and death. This is the first report of any parameter relevant to seizures in a mouse model of Ube3a overexpression. These results, along with others in Ube3a-deficient models, indicate and support a dose sensitive role for Ube3a in GABAergic signaling (73–76). Whole brain anatomical phenotyping also revealed volume reductions and dysmorphia in several key brain structures, including pronounced reductions in the hippocampus proper and its substructures, supporting clinical findings of heterotopias and dysplasias observed in neuroimaging of individuals with Dup15q syndrome (77). Anatomical phenotypes have been corroborative of behavioral phenotypes in other related preclinical mouse models of neurodevelopmental disorders performed by our collaborative team (78–81).
Here, we describe a new inducible mouse model, which allows temporal and spatial control of mouse Ube3a isoform 2. Although our studies used the Camk2a-tTA line to examine the role of Ube3a isoform 2 in excitatory neurons, additional tTA lines are readily available and can be used to overexpress Ube3a isoform 2 in other cells or tissues. While Camk2a is highly expressed in postnatal neurons, transcript has been detected in embryonic brain tissues (http://www.brain-map.org/highlights/20977). While expression profiles of CamK2a are mostly similar in developmental timing to when endogenous Ube3a is expressed, future directions will address if the higher levels of expression of CamK2a-driven Ube3a-2 during postnatal development are driving a portion of the severe phenotypes in our model. Beyond CamK2a driver specificity and forebrain localization, this is a powerful mouse model as the expression of Ube3a isoform 2 can be temporally regulated using Doxycycline, which will be useful for fully understanding the developmental and cellular roles of UBE3A in neurodevelopmental disorders and for developing and testing new therapies.
There are currently two mouse models of overexpression of Ube3a. Nakatani et al. (2009) used a chromosomal engineering approach to generate a mouse model with a 6.3 Mb duplication of the mouse region orthologous to the human 15q11-13 region, including Ndn, Snrpn, clusters of C/D box orphan snoRNAs, Ube3a, Atp10a, Gabrb3, Gabra5, Gabrg3, and Herc2 (82). Behavioral and anatomical anomalies were only observed in mice with a paternally inherited duplication of the region, which is at odds with the maternal-specific inheritance pattern of 15q11-q13 duplications observed in individuals with Dup15q syndrome (5,7,79,82). Smith et al. (2011) generated a Ube3a-specific mouse model via a bacterial artificial chromosome (BAC) containing the entire mouse Ube3a locus engineered with a C-terminal FLAG tag (83). This model, on a congenic FVB/NJ background, exhibited ASD-relevant behavioral deficits in three-chambered social approach, ultrasonic vocalizations, and repetitive self-grooming (83). No phenotypes were discovered in developmental growth, general motor and explorative abilities, similar to our findings. In contrast to the robust anxiety-related phenotypes we discovered (Fig. 3, Supplementary Material, w. S3), no anxiety-like phenotype was observed in the elevated plus-maze studies in the Ube3a BAC transgenic (83). No global or localized anatomical defects have been reported in the original or newer BAC model(s), to date, to compare with our presented neuroimaging data (24,83). Kuhnle et al. (2013) showed that fusion of a C-terminal, but not an N-terminal, FLAG tag on UBE3A impairs its E3 ligase activity, and suggest that the phenotypes observed in the Ube3a:FLAG overexpression mouse model generated by Smith et al. (2011) might not be caused by an increase in E3 activity but rather by inhibition of the E3 activity of endogenous Ube3a and/or by an increase in the E3-independent properties of Ube3a (84–86). Therefore, the different phenotypes observed among (or between) the models likely stems from the design of each model, the influence of the genetic background strain, the level of overexpression of Ube3a achieved in each model, and the enzymatic activity of Ube3a.
Research efforts have largely focused on the E3 ligase and nuclear role(s) of the Ube3a/UBE3A protein (14,15,27,87–89). Previous immunohistochemical studies highlight a broad and diverse subcellular distribution of the Ube3a protein (34,90,91). This level of subcellular diversity is consistent with the notion that Ube3a has many functions in the cell, including the ubiquitin proteasome system and transcriptional co-activation (31). Our model overexpressed the cytoplasmic isoform of Ube3a and we observed gross volume reductions in brain anatomy, anxiety-like behavior, learning and memory deficits, and seizure susceptibility thus it is plausible that both ligase dependent and non-dependent mechanism(s) of action, in both nuclear and cytoplasmic locations, are responsible for distinct behavioral phenotypes. Future studies of this model are needed to assess the E3 ligase activity of the FLAG:Ube3a-2 protein and to examine changes in the levels of previously identified or known Ube3a substrates in the cytoplasm. Our findings, in addition to other previously published studies, support the notion that each Ube3a/UBE3A isoform has a distinct function in the brain (33).
The present study’s outcomes were the analysis of F1 hybrid mice (FVB/NJ-C57BL/6J). This was the result of the design of the TRE-Ube3a-2 model on a FVB background and the fact that the commercially available CamK2a-tTA line is only available on a C57BL/6J background. Differences in sensitive behavioral outcomes such as anxiety-like and social behaviors between the previously reported models and ours, could be related to differences in genetic background and/or ages at testing. Recently, Sitting et al. (2016) discovered that use of single strains is a barrier to robust characterization of genotype–phenotype relationships (92). Moreover, other studies of mouse models of monogenic neurodevelopmental disorders (e.g., AS, Fragile X and Rett syndromes) have shown that behavioral and anatomical phenotypes are highly dependent on genetic background (93–98). In our data, the strong reproducibility of the major phenotypes in two separate behaviorally tested cohorts of mice indicates a minimal influence of background strain. In fact, previous studies have shown that F1 hybrids have considerably better learning and memory abilities compared with congenic C57BL/6J mice (67,99). Follow-up analyses will perform comparisons of behavior and total anatomical differences by genotype on the hybrid background as well as the C57BL/6J congenic strain. We designed a focused comparison of the WT and tTA/Ube3a-2 mice for behavioral and anatomical phenotypes, while using WT, single transgenic (Camk2a-tTA/+;+/+ and +/+;TRE-Ube3a-2) and double transgenic (Camk2a-tTA/+;TRE-Ube3a-2/+) for molecular comparisons. A recent report showed strain-dependent deficits of Camk2a-tTA expression on hippocampal-dependent behavioral tasks such as contextual fear conditioning (67). Given this report, it seemed prudent to assay for the behavioral effects of Camk2a-tTA/+;+/+ alone, in all groups. No pronounced behavioral phenotypes were observed in experiments examining phenotypes of the Camka-tTA/+ mice versus the WT neither on the mixed FVB/NJ-C57BL/6J background strain nor on the pure congenic C57BL/6J strain, consistent with Han et al. (2012). Importantly, in extension of earlier results, we found that expression of the Camk2a-tTA/+;+/+ transgene alone did not elicit anxiety-like behaviors or learning memory deficits (Supplementary Material, Table S2). We also found no confounding effect of TRE-FLAG expression.
In summary, we have developed a versatile mouse model expressing Ube3a isoform 2 under the control of the Tet-off system and assessed the effects of overexpression of Ube3a isoform 2 in excitatory neurons towards understanding the role of elevated UBE3A in Dup15q syndrome. We discovered that tTA/Ube3a-2 mice exhibit reduced ultrasonic vocalization in pups, elevated anxiety-like behavioral responses and learning and memory impairments. tTA/Ube3a-2 mice were also more susceptible to seizures, a key feature of the human condition and an area of research that was until now, not feasible to investigate in other mouse models. We observed anatomical pathology by reduced forebrain, hippocampus, striatum, amygdala and cortical volume. Altogether, these findings show an isoform- and neuronal subtype-specific role of Ube3a in translationally relevant behavioral outcomes. Furthermore, this mouse model has been made publically available prior to publication in order to advance scientific research in the fields of Dup15q and Angelman syndromes and to expedite the development of new therapies for these conditions.
Materials and Methods
Vector design
The TRE-Ube3a-2 transgene was designed in the laboratory of Dr. Scott V. Dindot. Briefly, a sequence consisting of an N-terminal 3X FLAG tag and the cDNA sequence encoding the mouse Ube3a isoform 2 (Ube3a-2, NM_011668.2) was synthesized and cloned into the pcDNA3.1 vector (LifeTechnologies). The FLAG:Ube3a-2 sequence was then cloned into the pTRE-Tight vector (#631059, CloneTech). A map of the 3XFLAG:Ube3a-2_pTRE-Tight vector map and sequence are available on request.
Generation and characterization of an inducible Ube3a isoform 2 mouse model
Transgenic founders carrying the 3XFLAG:Ube3a-2_pTRE-Tight vector were generated via pronuclear injections at the Texas A&M Institute of Genomic Medicine (TIGM) using methods described previously. Briefly, FVB/NJ embryos (Stock #001800, The Jackson Laboratory, Bar Harbor, ME) were injected with the 3XFLAG:Ube3a-2_pTRE-Tight vector and transferred to recipient females. Transgenic founder animals were identified by PCR genotyping using the following primers (forward [AAT GAG GCC TGC ACG AAT GA], reverse [AAG CTC AGA ACC AGT GCC TC]) with the following conditions: PCR mix: 14.75 µl dH20, 5 µl 5X Green GoTaq Flexi Buffer (#M8291, Promega), 2.5 µl 25 mM MgCl2, 0.5 µl 10 mM dNTPs, 0.5 µl 10 mM forward primer, 0.5 µl 10 mM reverse primer, 1 µl DNA (50–100 ng), and 0.25 µl GoTaq Flexi DNA polymerase; thermocycler conditions: 94 °C 5 min (1 cycle); 94 °C 30 s, 60 °C 30 s, 72 °C 30 s (30 cycles); 72 °C 5 min (1 cycle). Mice carrying the 3XFLAG:Ube3a-2_pTRE-Tight (hereafter referred to as TRE-Ube3a-2) transgene were crossed to FVB/NJ to assess germline transmission and to establish colonies of each line. Sperm from each founder line was cryopreserved at TIGM; a line was sent to The Jackson Laboratory Repository (FVB/N-Tg(tetO-Ube3a*2)884Svd/J, #026279) and was made available to the scientific community for use in 2014.
Inducible expression of the TRE-Ube3a-2 transgene was assessed by crossing TRE-FLAG:Ube3a-2/+ mice to Camk2a-tTA/+ mice (B6.Cg-Tg(Camk2a-tTA)1Mmay/DboJ, #007004, The Jackson Laboratory), which expresses the tetracycline transactivator (tTA) protein under the control of the Camk2a promoter. The resulting F1 hybrid offspring have the possible following genotypes: 1) TRE-Ube3a-2/+; CamK2a-tTA/+, 2) TRE-Ube3a-2/+;+/+, 3) +/+; CamK2a-tTA/+, and 4) +/+; +/+ (WT). Offspring were genotyped for the TRE-Ube3a-2 as described above and for the Camk2a-tTA transgene using the following primers (forward-olMR8746 [CGC TGT GGG GCA TTT TAC TTT AG], reverse-olMR8747 [CAT GTC CAG ATC GAA ATC GTC], forward-olMR8744 [CAA ATG TTG CTT GTC TGG], reverse-olMR8745 [GTC AGT CGA GTG CAC AGT TT]) with the following conditions: PCR mix: 8.75 µl dH20, 5 µl 5X Green GoTaq Flexi Buffer (Vendor), 2.5 µl 25 mM MgCl2, 0.6 µl 10 mM dNTPs, 0.6 µl 10 mM forward-olMR8746 primer, 0.5 µl 10 mM reverse-olMR8747 primer, 0.6 µl 10 mM forward-olMR8744, 0.6 µl 10 mM reverse-olMR8745 primer, 1 µl DNA (50–100 ng), and 0.25 µl GoTaq Flexi DNA polymerase; thermocycler conditions: 94 °C 3 min (1 cycle); 94 °C 30 s, 57 °C 1 min, 72 °C 1 min (30 cycles); 72 °C 5 min (1 cycle).
All animals were housed in pathogen-free mouse facility under standard conditions, according to NIH guidelines and approved by the Texas A&M University Institutional Animal Care and Use Committee.
Quantitative RT-PCR
Ube3a steady state mRNA levels were examined in mice using quantitative real-time PCR. Briefly, total RNA was extracted from tissue samples using the Purelink RNA Mini Kit (Life Technologies, Carlsbad, CA). First strand cDNA synthesis was performed using the Superscript III First Strand Synthesis kit and oligo-dT primers (Life Technologies). Real-time PCR was performed using the Taqman Gene Expression Master Mix and Taqman Gene Expression Assays per manufacturer’s protocol (Life Technologies). Beta-2 microglobulin (Taqman Assay #Mm00437762_m1) was used as an internal control. Taqman Assay #Mm00839910_m1 was used to assess Ube3a (Ube3a-2 and endogenous Ube3a) mRNA levels. The primer and probe set targets an amplicon of 121 base pairs that spans exons 6 and 7 of Ube3a isoforms 1 and 3 and exons 8 and 9 of Ube3a isoform 2. The reactions were performed using an ABI 7900HT real-time PCR machine. Measurements for inferential statistics were performed using normalized ΔCt values (2-ΔCt = 2-Ct[target] – Ct[internal control]), as outlined by Schmittgen et al. (2008). Descriptive statistics consist of ΔΔCt values (2-ΔΔCt = 2-(Ct[target] – Ct[internal control]) - (Ct[target] – Ct[internal control])); target = Ube3a, internal control = beta-2 microglobulin).
Western blot analysis at Texas A&M. The Ube3a (#611416, BD Biosciences) primary antibody was diluted in 2.5% milk/T-TBS and incubated on the membrane for 1 h at room temperature. After three 15 min washes in T-TBS, the secondary antibody (Peroxidase AffiniPure Goat Anti-Mouse IgG, #115-035-166, Jackson ImmunoResearch Laboratories, Inc.) was diluted 1:2000 in 2.5% milk/T-TBS and incubated on the membrane for 1 h at room temperature. Three 15 min washes in T-TBS were performed before developing with Clarity Western ECL Substrate (Bio-Rad), according to the manufacturer’s protocol. Membranes were imaged using the FluorChem system. Digital images of western blot membranes (16 bit.tif) were imported into ImageJ and FLAG:Ube3a-2 and endogenous Ube3a protein levels were quantified using the area under the curve feature. FLAG:Ube3a-2 and endogenous protein levels were transformed as percentage of total protein per sample. A student’s t-test was used to compare the relative percentages of each protein. Descriptive statistics consist of FLAG:Ube3a-2 protein levels relative to endogenous Ube3a protein levels.
Western blot Analysis at UC Davis MIND Institute
For Western blot experiments, tissues were lysed with 10 mM Tris-HCl, 150 mM NaCl, 1% Nonidet P-40, 10 mM EDTA and protease inhibitor cocktail; PH 7.4. Then sonicated and added 5x loading buffer and boiled for 5 min. Protein was quantified by BCA protein assay. Protein extracts (20–50 μg) were subjected to 4–20% precast polyacrylamide gel (Bio-rad). On the Odyssey infrared imaging system, samples were separated and transferred onto nitrocellulose membranes for 130 min at a constant current of 100 mA. The membranes were blocked in odyssey blocking buffer (Licor, 927-40000) for 1 h. Anti-E6AP (1:500, Santa cruz, sc-25509), and anti-GAPDH (1:10,000, Advanced Immunochemical, Inc., 2-RGM2) were incubated with the membranes in blocking buffer containing 0.2% Tween overnight at 4 °C. Membranes were then incubated with secondary antibodies, IRDye 800CW Donkey anti-Mouse IgG (Licor, 926-32212), and IRDye 680RD Donkey anti-Rabbit IgG (Licor, 926-68073) in 1:10,000 dilution for 1 h. Protein quantification was performed using a Licor Odyssey infrared imaging system according to manufacturer’s instructions.
Immunofluorescence
Paraffin-embedded tissue slides were baked overnight at 56 °C and then placed in four times 5-min washes with xylene. After that two times 5 min washes with 100% ethanol and then 1 h at 95 °C in antigen retrieval solution (DAKO). Slides were then washed in 0.2 SSC and then anti-E6AP (1:100, Santa Cruz, sc-25509), anti-FLAG (1:500, Sigma-Aldrich, F1804), anti-CaMKII (1:100, Abcam, ab22609) was added and incubated at 37 °C for 2 h. Then washed three times in 1x PBS with 0.5% tween. Slides were then incubated with secondary antibodies, goat anti-rabbit IgG coupled with Alexa Fluor 594 (Invitrogen) and goat anti-mouse IgG antibody coupled with Alexa Fluor 488 (Invitrogen) in 1:250 dilution, then coverslipped and incubated for 1 h at 37 °C. Slides were air dried and mounted with 5 mg/ml DAPI in Vectrashield (Vector Laboratories) and coverslipped.
Doxycycline administration
The reversible properties of the model were examined by administering doxycycline (DOX; 8 mg/kg/day, p.o.) as previously described (99) for 1-mon prior to tissue collection. Dosing was administered in the morning daily (7 am –10 am). The solution used was a 0.8 mg/mL (DOX in water) solution with mice getting weight/100 ml of solution.
Mouse colony at UC Davis
TRE-Ube3a-2 transgenic mice (+/-) breeders were transferred from the Texas A&M University to the UC Davis Mouse Biology Program for sterile rederivation by IVF followed by embryo transfer into pseudopregnant recipients to produce pups in the barrier facility. Offspring from the rederivation process were maintained on the FVB/NJ background. Both colonies were maintained by wildtype (+/+) by heterozygous (+/-) crosses. Heterozygous Camk2a-tTA male mice were paired with TRE-Ube3a-2 females in harem breeding trios, giving rise to the genotypes as described above. Approximately, 2-weeks after pairing, females were individually housed and inspected daily for pregnancy and delivery. The day of birth was considered as postnatal day (PND) 0. After weaning on PND 21, mice were socially housed in groups of 2–4 by sex. All mice were housed in Techniplast cages (Techniplast, West Chester, PA). Cages were housed in ventilated racks in a temperature (68–72 °F) and humidity (∼25%) controlled colony room on a 12-h circadian cycle with lights on from 07:00 to 19:00 h. Standard rodent chow and tap water were available ad libitum. In addition to standard bedding, a Nestlet square, shredded brown paper, and a cardboard tube (Jonesville Corporation, Jonesville, MI) were provided in each cage. The colony room was maintained on a 12:12 h light/dark cycle with lights on at 06:00 h, at approximately 20 °C and 55% humidity.
Behavioral assays
All behavioral tests were performed between 09:00 and 17:00 h during the light phase of the light/dark cycle. All groups were tested on the same day in randomized order. Mice were brought to an empty holding room adjacent to the testing area at least 1 h prior to the start of behavioral testing. Two cohorts of mice were tested. The first cohort of mice was generated to test adult behavior and PTZ-induced seizures. The second cohort of mice was generated to test ultrasonic pup vocalizations, reproduce adult behavioral outcomes, and brain collection for magnetic resonance imaging (MRI). In cohort 1, the order of testing was as follows: (1) elevated plus-maze at 5 weeks of age, (2) light ↔ dark exploration task at 6 weeks of age, (3) open field locomotion at 7 weeks of age, (4) stress-induced hyperthermia at 8 weeks of age, (5) three-chambered social approach at 9 weeks of age, (6) fear conditioning at 10 weeks of age, and (7) PTZ-induced seizures at 11 weeks of age. In cohort 2, the order of testing was as follows: (1) PND 5, 7, 9, 11 pup ultrasonic vocalizations, (2) elevated plus-maze at 5 weeks of age, (3) light↔dark exploration task at 6 weeks of age, (4) open field locomotion at 7 weeks of age, (5) stress-induced hyperthermia at 8 weeks of age, (6) three-chambered social approach and repetitive self-grooming at 9–10 weeks of age, (7) male–female reciprocal social interaction at 11 weeks of age, (8) fear conditioning at 12 weeks of age, and (9) perfusion and brain collection for MRI approximately at 14–16 weeks of age. See supplementary experimental procedures for comprehensive descriptions.
Ultrasonic vocalizations in isolated pups
To elicit ultrasonic vocalizations for the assessment of communication deficits, pups (WT N = 21, tTA/Ube3a-2 N = 29) were isolated from their mother and littermates on post-natal day 5, 7, 9, and 11 for 3 min at room temperature (22–24 °C) as described previously (46–48).
Elevated plus-maze
To evaluate anxiety-related behavior mice (WT N = 13, tTA/Ube3a-2 N = 12) were tested in elevated plus-maze as described previously (100) (using a standard mouse apparatus (Med Associates, St. Albans, VT).
Light ↔ dark transitions
To assess anxiety-like behavior, mice (WT N = 13, tTA/Ube3a-2 N = 12) were tested in the light ↔ dark behavioral assay as described previously (100).
Locomotion in novel open arena
To evaluate general exploratory behavior in a novel open field environment, mice (WT N = 13, tTA/Ube3a-2 N = 12) were run through open field as described previously (57–60,81).
Stress-induced hyperthermia
The stress-induced hyperthermia test was conducted in mice (WT N = 13, tTA/Ube3a-2 N = 12), as described previously (101) to assess a physiologic response to stress without a motor component.
3-Chambered social approach
For the detection of social deficits relevant to autism, social approach was tested in mice (WT N = 13, tTA/Ube3a-2 N = 12) using an automated three-chambered apparatus as described previously (57–60).
Repetitive self-grooming
Spontaneous repetitive self-grooming behavior was scored as described previously (57–60).
Male–female social interaction
The male-female reciprocal social interaction test involved only male subjects (WT N = 8, tTA/Ube3a-2 N = 5), since males initiated the social behaviors and USVs, and was conducted as described previously (57–61) to extend the sociability data from the three-chambered social approach task. Each freely moving male subject was paired with a freely moving unfamiliar estrous B6/J female for 5-min.
Fear conditioning
Delay contextual and cued fear conditioning was conducted in mice (WT N = 13, tTA/Ube3a-2 N = 11) using an automated fear-conditioning chamber (Med Associates, St Albans, VT, USA) as described previously (81,100)
Pentylenetetrazole-induced seizures
Behavioral assessment of seizure threshold in mice (WT N = 13, tTA/Ube3a-2 N = 12) was performed with injections of 80 mg/kg of pentylenetetrazole (PTZ) as described previously (72). PTZ-induced convulsions were used to gauge susceptibility to primary generalized seizures (102,103).
MRI within brains subjects assessed in behavioral assays
Perfusion
Mice were anesthetized with isoflourane (4% to effect) and intracardially perfused with 30 ml of 0.1 M PBS containing 10 U/ml heparin (Sigma) and 2 mM ProHance (a Gadolinium contrast agent) followed by 30 ml of 4% paraformaldehyde (PFA) containing 2 mM ProHance (104).
MRI
A multi-channel 7.0 Tesla MRI scanner (Varian Inc., Palo Alto, CA) was used to image the brains within their skulls. Sixteen custom-built solenoid coils were used to image the brains in parallel (69,105). In order to detect volumetric changes via Anatomical imaging, we used the following parameters for the MRI scans: T2- weighted, 3-D fast spin-echo sequence, with a cylindrical acquisition of k-space, a TR of 350 ms, and TEs of 12 ms per echo for 6 echoes, field-of-view equaled to 20 × 20 × 25 mm3 and matrix size equaled to 504 × 504 × 630 (106). The parameters output an image with 0.040 mm isotropic voxels. The total imaging time was 14 h.
Registration and analysis
To visualize and compare any changes in the mouse brains the images were linearly (6 followed by 12 parameters) and non-linearly registered together. All scans were then resampled with the appropriate transform and averaged to create a population atlas representing the average anatomy of the study sample. The result of the registration was to have all scans deformed into alignment with each other in an unbiased fashion. All registrations were performed with a combination of mni_autoreg tools (107) and advanced normalization tools (ANTs) (108,109). This allows for the analysis of the deformations needed to take each individual mouse's anatomy into this final atlas space, the goal being to model how the deformation fields relate to genotype (69). The Jacobian determinants of the deformation fields were then calculated as measures of volume at each voxel. Significant volume changes were then calculated by warping a pre-existing classified MRI atlas onto the population atlas, which allows for the volume of 62 segmented structures encompassing cortical lobes, large white matter structures (i.e. corpus callosum), ventricles, cerebellum, brain stem, and olfactory bulbs (68) to be assessed in all brains. Further, these measurements were examined on a voxel-wise basis to localize the differences found within regions or across the brain. An additional atlas consisting of 159 different regions, which further divides up the cortex and cerebellum (70,110,111) was also used to look for regional differences. Multiple comparisons were controlled for using the False Discovery Rate (112).
Supplementary Material
Supplementary Material is available at HMG online.
Supplementary Material
Acknowledgements
We thank Drs. Benjamin Morpurgo, Andrei Golovko, and Johnathan Ballard at the Texas A&M Institute for Genomic Medicine (TIGM) for generating the Ube3a isoform 2 mouse model. We also thank Jean Kovar at the Texas A&M Laboratory Animal Resources and Research facility and Heather Boyle at the MIND Institute for maintaining the mouse colonies. We are grateful for the families of individuals affected with Dup15q syndrome that inspired and accelerated these research discoveries, in particular, Mr. Guy Calvert and Ms. Kadi Luchsinger, who facilitated much of this collaborative effort.
Conflict of Interest statement. None declared.
Funding
Dup15q Alliance (SVD & JLS), the Simon’s Foundation for Autism Research Initiative (SVD), Autism Science Foundation Pre-doctoral fellowship (DJR), Texas A&M AgriLife Research (SVD), the Foundation for Angelman Syndrome Therapeutics (SBC postdoctoral fellowship), the MIND Institute and NIH R01NS097808 (JLS), the Canadian Institute for Health Research and the Ontario Brain Institute (JPL), NIH R01ES021707 (JML), and the MIND Institute’s Intellectual and Developmental Disabilities Research Center (IDDRC) Grant HD079125 (PI Abbeduto).
References
- 1. Glessner J.T., Wang K., Cai G., Korvatska O., Kim C.E., Wood S., Zhang H., Estes A., Brune C.W., Bradfield J.P.. et al. (2009) Autism genome-wide copy number variation reveals ubiquitin and neuronal genes. Nature, 459, 569–573. [DOI] [PMC free article] [PubMed] [Google Scholar]
- 2. Moreno-De-Luca D., Sanders S.J., Willsey A.J., Mulle J.G., Lowe J.K., Geschwind D.H., State M.W., Martin C.L., Ledbetter D.H. (2013) Using large clinical data sets to infer pathogenicity for rare copy number variants in autism cohorts. Mol. Psychiatry, 18, 1090–1095. [DOI] [PMC free article] [PubMed] [Google Scholar]
- 3. Pinto D., Pagnamenta A.T., Klei L., Anney R., Merico D., Regan R., Conroy J., Magalhaes T.R., Correia C., Abrahams B.S.. et al. (2010) Functional impact of global rare copy number variation in autism spectrum disorders. Nature, 466, 368–372. [DOI] [PMC free article] [PubMed] [Google Scholar]
- 4. Bolton P.F., Dennis N.R., Browne C.E., Thomas N.S., Veltman M.W., Thompson R.J., Jacobs P. (2001) The phenotypic manifestations of interstitial duplications of proximal 15q with special reference to the autistic spectrum disorders. Am. J. Med. Genet., 105, 675–685. [DOI] [PubMed] [Google Scholar]
- 5. Cook E.H. Jr, Lindgren V., Leventhal B.L., Courchesne R., Lincoln A., Shulman C., Lord C., Courchesne E. (1997) Autism or atypical autism in maternally but not paternally derived proximal 15q duplication. Am. J. Med. Genet., 60, 928–934. [PMC free article] [PubMed] [Google Scholar]
- 6. Finucane B.M., Lusk L., Arkilo D., Chamberlain S., Devinsky O., Dindot S., Jeste S.S., LaSalle J.M., Reiter L.T., Schanen N.C.. et al. (2016) 15q Duplication Syndrome and Related Disorders., Seattle (WA: ): University of Washington, Seattle; 1993–2016. [Google Scholar]
- 7. Urraca N., Cleary J., Brewer V., Pivnick E.K., McVicar K., Thibert R.L., Schanen N.C., Esmer C., Lamport D., Reiter L.T. (2013) The interstitial duplication 15q11.2-q13 syndrome includes autism, mild facial anomalies and a characteristic EEG signature. Autism Res., 6, 268–279. [DOI] [PMC free article] [PubMed] [Google Scholar]
- 8. Albrecht U., Sutcliffe J.S., Cattanach B.M., Beechey C.V., Armstrong D., Eichele G., Beaudet A.L. (1997) Imprinted expression of the murine Angelman syndrome gene, Ube3a, in hippocampal and Purkinje neurons. Nat. Genet., 17, 75–78. [DOI] [PubMed] [Google Scholar]
- 9. Yamasaki K., Joh K., Ohta T., Masuzaki H., Ishimaru T., Mukai T., Niikawa N., Ogawa M., Wagstaff J., Kishino T. (2003) Neurons but not glial cells show reciprocal imprinting of sense and antisense transcripts of Ube3a. Hum. Mol. Genet., 12, 837–847. [DOI] [PubMed] [Google Scholar]
- 10. Gustin R.M., Bichell T.J., Bubser M., Daily J., Filonova I., Mrelashvili D., Deutch A.Y., Colbran R.J., Weeber E.J., Haas K.F. (2010) Tissue-specific variation of Ube3a protein expression in rodents and in a mouse model of Angelman syndrome. Neurobiol. Dis., 39, 283–291. [DOI] [PMC free article] [PubMed] [Google Scholar]
- 11. Rougeulle C., Glatt H., Lalande M. (1997) The Angelman syndrome candidate gene, UBE3A/E6-AP, is imprinted in brain. Nat. Genet., 17, 14–15. [DOI] [PubMed] [Google Scholar]
- 12. Chamberlain S.J., Lalande M. (2010) Neurodevelopmental disorders involving genomic imprinting at human chromosome 15q11-q13. Neurobiol. Dis., 39, 13–20. [DOI] [PubMed] [Google Scholar]
- 13. Meng L., Person R.E., Huang W., Zhu P.J., Costa-Mattioli M., Beaudet A.L. (2013) Truncation of Ube3a-ATS unsilences paternal Ube3a and ameliorates behavioral defects in the Angelman syndrome mouse model. PLoS Genet., 9, e1004039.. [DOI] [PMC free article] [PubMed] [Google Scholar]
- 14. Matsuura T., Sutcliffe J.S., Fang P., Galjaard R.J., Jiang Y.H., Benton C.S., Rommens J.M., Beaudet A.L. (1997) De novo truncating mutations in E6-AP ubiquitin-protein ligase gene (UBE3A) in Angelman syndrome. Nat. Genet., 15, 74–77. [DOI] [PubMed] [Google Scholar]
- 15. Jiang Y.H., Armstrong D., Albrecht U., Atkins C.M., Noebels J.L., Eichele G., Sweatt J.D., Beaudet A.L. (1998) Mutation of the Angelman ubiquitin ligase in mice causes increased cytoplasmic p53 and deficits of contextual learning and long-term potentiation. Neuron, 21, 799–811. [DOI] [PubMed] [Google Scholar]
- 16. Jiang Y., Lev-Lehman E., Bressler J., Tsai T.F., Beaudet A.L. (1999) Genetics of Angelman syndrome. Am. J. Med. Genet., 65, 1–6. [DOI] [PMC free article] [PubMed] [Google Scholar]
- 17. Yi J.J., Berrios J., Newbern J.M., Snider W.D., Philpot B.D., Hahn K.M., Zylka M.J. (2015) An autism-linked mutation disables phosphorylation control of UBE3A. Cell, 162, 795–807. [DOI] [PMC free article] [PubMed] [Google Scholar]
- 18. Kishino T., Lalande M., Wagstaff J. (1997) UBE3A/E6-AP mutations cause Angelman syndrome. Nat. Genet., 15, 70–73. [DOI] [PubMed] [Google Scholar]
- 19. Scoles H.A., Urraca N., Chadwick S.W., Reiter L.T., Lasalle J.M. (2011) Increased copy number for methylated maternal 15q duplications leads to changes in gene and protein expression in human cortical samples. Mol. Autism, 2, 19.. [DOI] [PMC free article] [PubMed] [Google Scholar]
- 20. Ferdousy F., Bodeen W., Summers K., Doherty O., Wright O., Elsisi N., Hilliard G., O'Donnell J.M., Reiter L.T. (2011) Drosophila Ube3a regulates monoamine synthesis by increasing GTP cyclohydrolase I activity via a non-ubiquitin ligase mechanism. Neurobiol. Dis., 41, 669–677. [DOI] [PMC free article] [PubMed] [Google Scholar]
- 21. Hope K.A., LeDoux M.S., Reiter L.T. (2016) The Drosophila melanogaster homolog of UBE3A is not imprinted in neurons. Epigenetics, 11, 637–642. [DOI] [PMC free article] [PubMed] [Google Scholar]
- 22. Jensen L., Farook M.F., Reiter L.T. (2013) Proteomic profiling in Drosophila reveals potential Dube3a regulation of the actin cytoskeleton and neuronal homeostasis. PloS One, 8, e61952.. [DOI] [PMC free article] [PubMed] [Google Scholar]
- 23. Valdez C., Scroggs R., Chassen R., Reiter L.T. (2015) Variation in Dube3a expression affects neurotransmission at the Drosophila neuromuscular junction. Biol Open., 4, 776–782. [DOI] [PMC free article] [PubMed] [Google Scholar]
- 24. Krishnan V., Stoppel D.C., Nong Y., Johnson M.A., Nadler M.J., Ozkaynak E., Teng B.L., Nagakura I., Mohammad F., Silva M.A.. et al. (2017) Autism gene Ube3a and seizures impair sociability by repressing VTA Cbln1. Nature, 543, 507–512. [DOI] [PMC free article] [PubMed] [Google Scholar]
- 25. Dunaway K.W., Islam M.S., Coulson R.L., Lopez S.J., Vogel Ciernia A., Chu R.G., Yasui D.H., Pessah I.N., Lott P., Mordaunt C.. et al. (2016) Cumulative impact of polychlorinated biphenyl and large chromosomal duplications on DNA methylation, chromatin, and expression of autism candidate genes. Cell Rep., 17, 3035–3048. [DOI] [PMC free article] [PubMed] [Google Scholar]
- 26. Noor A., Dupuis L., Mittal K., Lionel A.C., Marshall C.R., Scherer S.W., Stockley T., Vincent J.B., Mendoza-Londono R., Stavropoulos D.J. (2015) 15q11.2 duplication encompassing only the UBE3A gene is associated with developmental delay and neuropsychiatric phenotypes. Hum. Mutat., 36, 689–693. [DOI] [PubMed] [Google Scholar]
- 27. Nawaz Z., Lonard D.M., Smith C.L., Lev-Lehman E., Tsai S.Y., Tsai M.J., O'Malley B.W. (1999) The Angelman syndrome-associated protein, E6-AP, is a coactivator for the nuclear hormone receptor superfamily. Mol. Cell. Biol., 19, 1182–1189. [DOI] [PMC free article] [PubMed] [Google Scholar]
- 28. Tai H.C., Schuman E.M. (2008) Ubiquitin, the proteasome and protein degradation in neuronal function and dysfunction. Nat. Rev. Neurosci., 9, 826–838. [DOI] [PubMed] [Google Scholar]
- 29. Jana N.R. (2012) Understanding the pathogenesis of Angelman syndrome through animal models. Neural. Plast., 2012, 710943.. [DOI] [PMC free article] [PubMed] [Google Scholar]
- 30. Kumar S., Talis A.L., Howley P.M. (1999) Identification of HHR23A as a substrate for E6-associated protein-mediated ubiquitination. J. Biol. Chem., 274, 18785–18792. [DOI] [PubMed] [Google Scholar]
- 31. LaSalle J.M., Reiter L.T., Chamberlain S.J. (2015) Epigenetic regulation of UBE3A and roles in human neurodevelopmental disorders. Epigenomics, 7, 1213–1228. [DOI] [PMC free article] [PubMed] [Google Scholar]
- 32. Sun J., Zhou W., Kaliappan K., Nawaz Z., Slingerland J.M. (2012) ERalpha phosphorylation at Y537 by Src triggers E6-AP-ERalpha binding, ERalpha ubiquitylation, promoter occupancy, and target gene expression. Mol. Endocrinol., 26, 1567–1577. [DOI] [PMC free article] [PubMed] [Google Scholar]
- 33. Miao S., Chen R., Ye J., Tan G.H., Li S., Zhang J., Jiang Y.H., Xiong Z.Q. (2013) The Angelman syndrome protein Ube3a is required for polarized dendrite morphogenesis in pyramidal neurons. J. Neurosci., 33, 327–333. [DOI] [PMC free article] [PubMed] [Google Scholar]
- 34. Dindot S.V., Antalffy B.A., Bhattacharjee M.B., Beaudet A.L. (2008) The Angelman syndrome ubiquitin ligase localizes to the synapse and nucleus, and maternal deficiency results in abnormal dendritic spine morphology. Hum. Mol. Genet., 17, 111–118. [DOI] [PubMed] [Google Scholar]
- 35. Yamamoto Y., Huibregtse J.M., Howley P.M. (1997) The human E6-AP gene (UBE3A) encodes three potential protein isoforms generated by differential splicing. Genomics, 41, 263–266. [DOI] [PubMed] [Google Scholar]
- 36. Cooper E.M., Hudson A.W., Amos J., Wagstaff J., Howley P.M. (2004) Biochemical analysis of Angelman syndrome-associated mutations in the E3 ubiquitin ligase E6-associated protein. J. Biol. Chem., 279, 41208–41217. [DOI] [PubMed] [Google Scholar]
- 37. Yi J.J., Paranjape S.R., Walker M.P., Choudhury R., Wolter J.M., Fragola G., Emanuele M.J., Major M.B., Zylka M.J. (2017) The autism-linked UBE3A T485A mutant E3 ubiquitin ligase activates the Wnt/beta-catenin pathway by inhibiting the proteasome. J Biol Chem, DOI: 10.1074/jbc.M117.788448. [DOI] [PMC free article] [PubMed] [Google Scholar]
- 38. Valluy J., Bicker S., Aksoy-Aksel A., Lackinger M., Sumer S., Fiore R., Wust T., Seffer D., Metge F., Dieterich C.. et al. (2015) A coding-independent function of an alternative Ube3a transcript during neuronal development. Nat. Neurosci., 18, 666–673. [DOI] [PubMed] [Google Scholar]
- 39. Martinez-Noel G., Galligan J.T., Sowa M.E., Arndt V., Overton T.M., Harper J.W., Howley P.M. (2012) Identification and proteomic analysis of distinct UBE3A/E6AP protein complexes. Mol. Cell. Biol., 32, 3095–3106. [DOI] [PMC free article] [PubMed] [Google Scholar]
- 40. Mayford M., Bach M.E., Kandel E. (1996) CaMKII function in the nervous system explored from a genetic perspective. Cold Spring Harb. Symp. Quant. Biol., 61, 219–224. [PubMed] [Google Scholar]
- 41. Tsien J.Z., Chen D.F., Gerber D., Tom C., Mercer E.H., Anderson D.J., Mayford M., Kandel E.R., Tonegawa S. (1996) Subregion- and cell type-restricted gene knockout in mouse brain. Cell, 87, 1317–1326. [DOI] [PubMed] [Google Scholar]
- 42. Furth P.A., St Onge L., Boger H., Gruss P., Gossen M., Kistner A., Bujard H., Hennighausen L. (1994) Temporal control of gene expression in transgenic mice by a tetracycline-responsive promoter. Proc. Natl Acad. Sci. U.S.A., 91, 9302–9306. [DOI] [PMC free article] [PubMed] [Google Scholar]
- 43. Alvarez-Saavedra M., Saez M.A., Kang D., Zoghbi H.Y., Young J.I. (2007) Cell-specific expression of wild-type MeCP2 in mouse models of Rett syndrome yields insight about pathogenesis. Hum. Mol. Genet., 16, 2315–2325. [DOI] [PubMed] [Google Scholar]
- 44. Crawley J., Goodwin F.K. (1980) Preliminary report of a simple animal behavior model for the anxiolytic effects of benzodiazepines. Pharmacol. Biochem. Behav., 13, 167–170. [DOI] [PubMed] [Google Scholar]
- 45. Holmes A., Murphy D.L., Crawley J.N. (2003) Abnormal behavioral phenotypes of serotonin transporter knockout mice: parallels with human anxiety and depression. Biol Psychiatry, 54, 953–959. [DOI] [PubMed] [Google Scholar]
- 46. Scattoni M.L., Crawley J., Ricceri L. (2009) Ultrasonic vocalizations: a tool for behavioural phenotyping of mouse models of neurodevelopmental disorders. Neurosci. Biobehav. Rev., 33, 508–515. [DOI] [PMC free article] [PubMed] [Google Scholar]
- 47. Scattoni M.L., Gandhy S.U., Ricceri L., Crawley J.N. (2008) Unusual repertoire of vocalizations in the BTBR T+tf/J mouse model of autism. PloS One, 3, e3067.. [DOI] [PMC free article] [PubMed] [Google Scholar]
- 48. Scattoni M.L., McFarlane H.G., Zhodzishsky V., Caldwell H.K., Young W.S., Ricceri L., Crawley J.N. (2008) Reduced ultrasonic vocalizations in vasopressin 1b knockout mice. Behav. Brain Res., 187, 371–378. [DOI] [PMC free article] [PubMed] [Google Scholar]
- 49. Wohr M., Silverman J.L., Scattoni M.L., Turner S.M., Harris M.J., Saxena R., Crawley J.N. (2013) Developmental delays and reduced pup ultrasonic vocalizations but normal sociability in mice lacking the postsynaptic cell adhesion protein neuroligin2. Behav. Brain Res., 251, 50–64. [DOI] [PMC free article] [PubMed] [Google Scholar]
- 50. Ey E., Yang M., Katz A.M., Woldeyohannes L., Silverman J.L., Leblond C.S., Faure P., Torquet N., Le Sourd A.M., Bourgeron T.. et al. (2012) Absence of deficits in social behaviors and ultrasonic vocalizations in later generations of mice lacking neuroligin4. Genes Brain Behav., 11, 928–941. [DOI] [PMC free article] [PubMed] [Google Scholar]
- 51. Branchi I., Santucci D., Alleva E. (2001) Ultrasonic vocalisation emitted by infant rodents: a tool for assessment of neurobehavioural development. Behav. Brain Res., 125, 49–56. [DOI] [PubMed] [Google Scholar]
- 52. Brudzynski S. (2009) Handbook of Mammalian Vocalization An Integrative Neuroscience Approach. Stefan Brudzynski (eds), 1st edn. Academic Press.
- 53. Crawley J.N. (2008) Behavioral phenotyping strategies for mutant mice. Neuron, 57, 809–818. [DOI] [PubMed] [Google Scholar]
- 54. Kazdoba T.M., Leach P.T., Yang M., Silverman J.L., Solomon M., Crawley J.N. (2016) Translational mouse models of autism: advancing toward pharmacological therapeutics. Curr Top Behav. Neurosci., 28, 1–52. [DOI] [PMC free article] [PubMed] [Google Scholar]
- 55. Moy S.S., Nadler J.J., Young N.B., Perez A., Holloway L.P., Barbaro R.P., Barbaro J.R., Wilson L.M., Threadgill D.W., Lauder J.M.. et al. (2007) Mouse behavioral tasks relevant to autism: phenotypes of 10 inbred strains. Behav. Brain Res., 176, 4–20. [DOI] [PMC free article] [PubMed] [Google Scholar]
- 56. Silverman J.L., Crawley J.N. (2014) The promising trajectory of autism therapeutics discovery. Drug Discov. Today, 19, 838–844. [DOI] [PubMed] [Google Scholar]
- 57. Silverman J.L., Yang M., Lord C., Crawley J.N. (2010) Behavioural phenotyping assays for mouse models of autism. Nat. Rev. Neurosci., 11, 490–502. [DOI] [PMC free article] [PubMed] [Google Scholar]
- 58. Silverman J.L., Smith D.G., Rizzo S.J., Karras M.N., Turner S.M., Tolu S.S., Bryce D.K., Smith D.L., Fonseca K., Ring R.H.. et al. (2012) Negative allosteric modulation of the mGluR5 receptor reduces repetitive behaviors and rescues social deficits in mouse models of autism. Sci. Transl. Med., 4, 131ra151.. [DOI] [PMC free article] [PubMed] [Google Scholar]
- 59. Yang M., Bozdagi O., Scattoni M.L., Wohr M., Roullet F.I., Katz A.M., Abrams D.N., Kalikhman D., Simon H., Woldeyohannes L.. et al. (2012) Reduced excitatory neurotransmission and mild autism-relevant phenotypes in adolescent Shank3 null mutant mice. J. Neurosci., 32, 6525–6541. [DOI] [PMC free article] [PubMed] [Google Scholar]
- 60. Silverman J.L., Pride M.C., Hayes J.E., Puhger K.R., Butler-Struben H.M., Baker S., Crawley J.N. (2015) GABAB receptor agonist r-baclofen reverses social deficits and reduces repetitive behavior in two mouse models of autism. Neuropsychopharmacology, 40, 2228–2239. [DOI] [PMC free article] [PubMed] [Google Scholar]
- 61. Scattoni M.L., Ricceri L., Crawley J.N. (2011) Unusual repertoire of vocalizations in adult BTBR T+tf/J mice during three types of social encounters. Genes Brain Behav., 10, 44–56. [DOI] [PMC free article] [PubMed] [Google Scholar]
- 62. Kalueff A.V., Stewart A.M., Song C., Berridge K.C., Graybiel A.M., Fentress J.C. (2016) Neurobiology of rodent self-grooming and its value for translational neuroscience. Nat. Rev. Neurosci., 17, 45–59. [DOI] [PMC free article] [PubMed] [Google Scholar]
- 63. Silverman J.L., Tolu S.S., Barkan C.L., Crawley J.N. (2010) Repetitive self-grooming behavior in the BTBR mouse model of autism is blocked by the mGluR5 antagonist MPEP. Neuropsychopharmacology, 35, 976–989. [DOI] [PMC free article] [PubMed] [Google Scholar]
- 64. Curzon P., Rustay N.R., Browman K.E. (2009) Buccafusco J.J. (ed.), In Methods of Behavior Analysis in Neuroscience, Boca Raton (FL: ), CRC Press/Taylor & Francis, USA. [Google Scholar]
- 65. Kim J.J., Jung M.W. (2006) Neural circuits and mechanisms involved in Pavlovian fear conditioning: a critical review. Neurosci. Biobehav. Rev., 30, 188–202. [DOI] [PMC free article] [PubMed] [Google Scholar]
- 66. Phillips R.G., LeDoux J.E. (1992) Differential contribution of amygdala and hippocampus to cued and contextual fear conditioning. Behav. Neurosci., 106, 274–285. [DOI] [PubMed] [Google Scholar]
- 67. Han H.J., Allen C.C., Buchovecky C.M., Yetman M.J., Born H.A., Marin M.A., Rodgers S.P., Song B.J., Lu H.C., Justice M.J.. et al. (2012) Strain background influences neurotoxicity and behavioral abnormalities in mice expressing the tetracycline transactivator. J. Neurosci., 32, 10574–10586. [DOI] [PMC free article] [PubMed] [Google Scholar]
- 68. Dorr A.E., Lerch J.P., Spring S., Kabani N., Henkelman R.M. (2008) High resolution three-dimensional brain atlas using an average magnetic resonance image of 40 adult C57Bl/6J mice. Neuroimage, 42, 60–69. [DOI] [PubMed] [Google Scholar]
- 69. Lerch J.P., Sled J.G., Henkelman R.M. (2011) MRI phenotyping of genetically altered mice. Methods Mol. Biol., 711, 349–361. [DOI] [PubMed] [Google Scholar]
- 70. Steadman P.E., Ellegood J., Szulc K.U., Turnbull D.H., Joyner A.L., Henkelman R.M., Lerch J.P. (2014) Genetic effects on cerebellar structure across mouse models of autism using a magnetic resonance imaging atlas. Autism Res., 7, 124–137. [DOI] [PMC free article] [PubMed] [Google Scholar]
- 71. Conant K.D., Finucane B., Cleary N., Martin A., Muss C., Delany M., Murphy E.K., Rabe O., Luchsinger K., Spence S.J.. et al. (2014) A survey of seizures and current treatments in 15q duplication syndrome. Epilepsia, 55, 396–402. . [DOI] [PubMed] [Google Scholar]
- 72. Dhir A. (2012) Pentylenetetrazol (PTZ) kindling model of epilepsy. Curr. Protoc. Neurosci., Chapter 9, Unit9 37. [DOI] [PubMed] [Google Scholar]
- 73. Judson M.C., Wallace M.L., Sidorov M.S., Burette A.C., Gu B., van Woerden G.M., King I.F., Han J.E., Zylka M.J., Elgersma Y.. et al. (2016) GABAergic neuron-specific loss of Ube3a causes Angelman syndrome-like EEG abnormalities and enhances seizure susceptibility. Neuron, 90, 56–69. [DOI] [PMC free article] [PubMed] [Google Scholar]
- 74. Ciarlone S.L., Grieco J.C., D'Agostino D.P., Weeber E.J. (2016) Ketone ester supplementation attenuates seizure activity, and improves behavior and hippocampal synaptic plasticity in an Angelman syndrome mouse model. Neurobiol. Dis., 96, 38–46. [DOI] [PubMed] [Google Scholar]
- 75. Ciarlone S.L., Wang X., Rogawski M.A., Weeber E.J. (2016) Effects of the synthetic neurosteroid ganaxolone on seizure activity and behavioral deficits in an Angelman syndrome mouse model. Neuropharmacology, 116, 142–150. [DOI] [PubMed] [Google Scholar]
- 76. Mandel-Brehm C., Salogiannis J., Dhamne S.C., Rotenberg A., Greenberg M.E. (2015) Seizure-like activity in a juvenile Angelman syndrome mouse model is attenuated by reducing Arc expression. Proc. Natl Acad. Sci. U.S.A., 112, 5129–5134. [DOI] [PMC free article] [PubMed] [Google Scholar]
- 77. Boronat S., Mehan W.A., Shaaya E.A., Thibert R.L., Caruso P. (2015) Hippocampal abnormalities in magnetic resonance imaging (MRI) of 15q duplication syndromes. J. Child Neurol., 30, 333–338. [DOI] [PubMed] [Google Scholar]
- 78. Ellegood J., Babineau B.A., Henkelman R.M., Lerch J.P., Crawley J.N. (2013) Neuroanatomical analysis of the BTBR mouse model of autism using magnetic resonance imaging and diffusion tensor imaging. NeuroImage, 70, 288–300. [DOI] [PMC free article] [PubMed] [Google Scholar]
- 79. Ellegood J., Nakai N., Nakatani J., Henkelman M., Takumi T., Lerch J. (2015) Neuroanatomical phenotypes are consistent with autism-like behavioral phenotypes in the 15q11-13 duplication mouse model. Autism Res., 8, 545–555. [DOI] [PubMed] [Google Scholar]
- 80. Portmann T., Yang M., Mao R., Panagiotakos G., Ellegood J., Dolen G., Bader P.L., Grueter B.A., Goold C., Fisher E.. et al. (2014) Behavioral abnormalities and circuit defects in the basal ganglia of a mouse model of 16p11.2 deletion syndrome. Cell Rep., 7, 1077–1092. [DOI] [PMC free article] [PubMed] [Google Scholar]
- 81. Gompers A.L., Su-Feher L., Ellegood J., Copping N.A., Riyadh M.A., Stradleigh T.W., Pride M.C., Schaffler M.D., Wade A.A., Catta-Preta R.. et al. (2017) Germline Chd8 haploinsufficiency alters brain development in mouse. Nat. Neurosci., DOI: 10.1038/nn.4592 [DOI] [PMC free article] [PubMed] [Google Scholar]
- 82. Nakatani J., Tamada K., Hatanaka F., Ise S., Ohta H., Inoue K., Tomonaga S., Watanabe Y., Chung Y.J., Banerjee R.. et al. (2009) Abnormal behavior in a chromosome-engineered mouse model for human 15q11-13 duplication seen in autism. Cell, 137, 1235–1246. [DOI] [PMC free article] [PubMed] [Google Scholar]
- 83. Smith S.E., Zhou Y.D., Zhang G., Jin Z., Stoppel D.C., Anderson M.P. (2011) Increased gene dosage of Ube3a results in autism traits and decreased glutamate synaptic transmission in mice. Sci. Transl. Med., 3, 103ra197.. [DOI] [PMC free article] [PubMed] [Google Scholar]
- 84. Kuhnle S., Kogel U., Glockzin S., Marquardt A., Ciechanover A., Matentzoglu K., Scheffner M. (2011) Physical and functional interaction of the HECT ubiquitin-protein ligases E6AP and HERC2. J. Biol. Chem., 286, 19410–19416. [DOI] [PMC free article] [PubMed] [Google Scholar]
- 85. Salvat C., Wang G., Dastur A., Lyon N., Huibregtse J.M. (2004) The -4 phenylalanine is required for substrate ubiquitination catalyzed by HECT ubiquitin ligases. J. Biol. Chem., 279, 18935–18943. [DOI] [PubMed] [Google Scholar]
- 86. Kuhnle S., Mothes B., Matentzoglu K., Scheffner M. (2013) Role of the ubiquitin ligase E6AP/UBE3A in controlling levels of the synaptic protein Arc. Proc. Natl Acad. Sci.U.S.A., 110, 8888–8893. [DOI] [PMC free article] [PubMed] [Google Scholar]
- 87. Chakraborty M., Paul B.K., Nayak T., Das A., Jana N.R., Bhutani S. (2015) The E3 ligase ube3a is required for learning in Drosophila melanogaster. Biochem. Biophys. Res.Commun., 462, 71–77. [DOI] [PubMed] [Google Scholar]
- 88. Nuber U., Schwarz S.E., Scheffner M. (1998) The ubiquitin-protein ligase E6-associated protein (E6-AP) serves as its own substrate. Eur. J. Biochem., 254, 643–649. [DOI] [PubMed] [Google Scholar]
- 89. Ramamoorthy S., Nawaz Z. (2008) E6-associated protein (E6-AP) is a dual function coactivator of steroid hormone receptors. Nucl. Recept. Signal, 6, e006.. [DOI] [PMC free article] [PubMed] [Google Scholar]
- 90. Burette A.C., Judson M.C., Burette S., Phend K.D., Philpot B.D., Weinberg R.J. (2016) Subcellular organization of UBE3A in neurons. J. Comp. Neurol., 525, 233–251. [DOI] [PMC free article] [PubMed] [Google Scholar]
- 91. Judson M.C., Sosa-Pagan J.O., Del Cid W.A., Han J.E., Philpot B.D. (2014) Allelic specificity of Ube3a expression in the mouse brain during postnatal development. J.Comp. Neurol., 522, 1874–1896. [DOI] [PMC free article] [PubMed] [Google Scholar]
- 92. Sittig L.J., Carbonetto P., Engel K.A., Krauss K.S., Barrios-Camacho C.M., Palmer A.A. (2016) Genetic background limits generalizability of genotype-phenotype relationships. Neuron, 91, 1253–1259. [DOI] [PMC free article] [PubMed] [Google Scholar]
- 93. Huang H.S., Burns A.J., Nonneman R.J., Baker L.K., Riddick N.V., Nikolova V.D., Riday T.T., Yashiro K., Philpot B.D., Moy S.S. (2013) Behavioral deficits in an Angelman syndrome model: effects of genetic background and age. Behav. Brain Res., 243, 79–90. [DOI] [PMC free article] [PubMed] [Google Scholar]
- 94. Samaco R.C., McGraw C.M., Ward C.S., Sun Y., Neul J.L., Zoghbi H.Y. (2013) Female Mecp2(+/-) mice display robust behavioral deficits on two different genetic backgrounds providing a framework for pre-clinical studies. Hum. Mol. Genet., 22, 96–109. [DOI] [PMC free article] [PubMed] [Google Scholar]
- 95. Spencer C.M., Alekseyenko O., Hamilton S.M., Thomas A.M., Serysheva E., Yuva-Paylor L.A., Paylor R. (2011) Modifying behavioral phenotypes in Fmr1KO mice: genetic background differences reveal autistic-like responses. Autism Res., 4, 40–56. [DOI] [PMC free article] [PubMed] [Google Scholar]
- 96. Moy S.S., Nadler J.J., Young N.B., Nonneman R.J., Grossman A.W., Murphy D.L., D'Ercole A.J., Crawley J.N., Magnuson T.R., Lauder J.M. (2009) Social approach in genetically engineered mouse lines relevant to autism. Genes Brain Behav., 8, 129–142. [DOI] [PMC free article] [PubMed] [Google Scholar]
- 97. Chen X.J., Kovacevic N., Lobaugh N.J., Sled J.G., Henkelman R.M., Henderson J.T. (2006) Neuroanatomical differences between mouse strains as shown by high-resolution 3D MRI. Neuroimage, 29, 99–105. [DOI] [PubMed] [Google Scholar]
- 98. Lai J.K., Lerch J.P., Doering L.C., Foster J.A., Ellegood J. (2016) Regional brain volumes changes in adult male FMR1-KO mouse on the FVB strain. Neuroscience, 318, 12–21. [DOI] [PubMed] [Google Scholar]
- 99. Owen E.H., Logue S.F., Rasmussen D.L., Wehner J.M. (1997) Assessment of learning by the Morris water task and fear conditioning in inbred mouse strains and F1 hybrids: implications of genetic background for single gene mutations and quantitative trait loci analyses. Neuroscience, 80, 1087–1099. [DOI] [PubMed] [Google Scholar]
- 100. Flannery B.M., Silverman J.L., Bruun D.A., Puhger K.R., McCoy M.R., Hammock B.D., Crawley J.N., Lein P.J. (2015) Behavioral assessment of NIH Swiss mice acutely intoxicated with tetramethylenedisulfotetramine. Neurotoxicol Teratol, 47, 36–45. [DOI] [PMC free article] [PubMed] [Google Scholar]
- 101. Silverman J.L., Yang M., Turner S.M., Katz A.M., Bell D.B., Koenig J.I., Crawley J.N. (2010) Low stress reactivity and neuroendocrine factors in the BTBR T+tf/J mouse model of autism. Neuroscience, 171, 1197–1208. [DOI] [PMC free article] [PubMed] [Google Scholar]
- 102. Cardoso I., Martins D., Ribeiro T., Merlini G., Saraiva M.J. (2010) Synergy of combined doxycycline/TUDCA treatment in lowering Transthyretin deposition and associated biomarkers: studies in FAP mouse models. J. Transl Med., 8, 74.. [DOI] [PMC free article] [PubMed] [Google Scholar]
- 103. Kirchner A., Veliskova J., Velisek L. (2006) Differential effects of low glucose concentrations on seizures and epileptiform activity in vivo and in vitro. Eur. J. Neurosci., 23, 1512–1522. [DOI] [PubMed] [Google Scholar]
- 104. Velisek L., Veliskova J., Giorgi F.S., Moshe S.L. (2006) Sex-specific control of flurothyl-induced tonic-clonic seizures by the substantia nigra pars reticulata during development. Exp. Neurol., 201, 203–211. [DOI] [PubMed] [Google Scholar]
- 105. Cahill L.S., Laliberte C.L., Ellegood J., Spring S., Gleave J.A., Eede M.C., Lerch J.P., Henkelman R.M. (2012) Preparation of fixed mouse brains for MRI. NeuroImage, 60, 933–939. [DOI] [PubMed] [Google Scholar]
- 106. Bock N.A., Nieman B.J., Bishop J.B., Mark Henkelman R. (2005) In vivo multiple-mouse MRI at 7 Tesla. Magn Reson Med, 54, 1311–1316. [DOI] [PubMed] [Google Scholar]
- 107. Nieman B.J., Bock N.A., Bishop J., Sled J.G., Josette Chen X., Mark Henkelman R. (2005) Fast spin-echo for multiple mouse magnetic resonance phenotyping. Magn. Reson. Med., 54, 532–537. [DOI] [PubMed] [Google Scholar]
- 108. Collins D.L., Neelin P., Peters T.M., Evans A.C. (1994) Automatic 3D intersubject registration of MR volumetric data in standardized Talairach space. J. Comput. Assist .Tomogr., 18, 192–205. [PubMed] [Google Scholar]
- 109. Avants B.B., Epstein C.L., Grossman M., Gee J.C. (2008) Symmetric diffeomorphic image registration with cross-correlation: evaluating automated labeling of elderly and neurodegenerative brain. Med.Image Anal., 12, 26–41. [DOI] [PMC free article] [PubMed] [Google Scholar]
- 110. Avants B.B., Tustison N.J., Song G., Cook P.A., Klein A., Gee J.C. (2011) A reproducible evaluation of ANTs similarity metric performance in brain image registration. Neuroimage, 54, 2033–2044. [DOI] [PMC free article] [PubMed] [Google Scholar]
- 111. Ullmann J.F., Watson C., Janke A.L., Kurniawan N.D., Reutens D.C. (2013) A segmentation protocol and MRI atlas of the C57BL/6J mouse neocortex. Neuroimage, 78, 196–203. [DOI] [PubMed] [Google Scholar]
- 112. Genovese C.R., Lazar N.A., Nichols T. (2002) Thresholding of statistical maps in functional neuroimaging using the false discovery rate. Neuroimage, 15, 870–878. [DOI] [PubMed] [Google Scholar]
Associated Data
This section collects any data citations, data availability statements, or supplementary materials included in this article.