Abstract
Study Objectives:
Postoperative development of obstructive sleep apnea (OSA) has been attributed to the fluid overloaded state of patients during the postoperative period. In this context, alterations in cardiac autonomic regulation caused by OSA may explain the increased postoperative risk for adverse cardiovascular events. This study tests the hypothesis that individuals with fluid overload-induced OSA will experience autonomic dysregulation, compared to those without fluid overload-induced OSA.
Methods:
Twenty-one normotensive, nonobese (mean body mass index 24.5 kg/m2) males (mean age 37 years) underwent a sleep study. Participants were randomly assigned to infusion with saline during sleep either at the minimum rate (control) or as a bolus of 22 mL/kg body weight (intervention). Participants were blinded to the intervention and crossed over to the other study arm after 1 week. Measures of heart rate variability were calculated from electrocardiography recordings presaline and postsaline infusion in the intervention arm. Heart rate variability measures computed were: standard deviation of the RR interval; root mean square of successive differences; low-frequency, high-frequency, and total power; and the ratio of low-frequency to high-frequency power.
Results:
Although presaline infusion values were similar, postsaline infusion values of the standard deviation of the RR interval and high-frequency power were lower in the group whose apnea-hypopnea index increased in response to saline infusion, compared to the group whose apnea-hypopnea index did not increase in response to saline infusion (P < .05 for both).
Conclusions:
Fluid overload-induced OSA is accompanied by a reduction in heart rate variability, consistent with vagal withdrawal. Future work should explore autonomic dysregulation in the postoperative period and its association with adverse events.
Citation:
Vena D, Bradley TD, Millar PJ, Floras JS, Bubianto J, Gavrilovic B, Perger E, Yadollahi A. Heart rate variability responses of individuals with and without saline-induced obstructive sleep apnea. J Clin Sleep Med. 2018;14(4):503–510.
Keywords: fluid overload, heart rate variability, obstructive sleep apnea, postoperative, vagal response
BRIEF SUMMARY
Current Knowledge/Study Rationale: Development of obstructive sleep apnea postoperatively has been attributed to the fluid overloaded state of patients during the postoperative period. Postoperative obstructive sleep apnea increases the risk for the development of cardiovascular events after surgery, which may be attributed to altered cardiac autonomic regulation caused by obstructive events.
Study Impact: Using measures of heart rate variability, we demonstrated that individuals in whom obstructive sleep apnea developed through fluid overload via saline infusion experienced reduced heart rate variability, consistent with vagal withdrawal, compared to those without saline-induced obstructive sleep apnea. In this context, alterations in cardiac autonomic regulation associated with obstructive sleep apnea may add to postoperative risk for cardiovascular events.
INTRODUCTION
A commonly observed phenomenon in middle-aged or elderly adults undergoing surgery involving general anesthesia and intravenous volume loading is the development of obstructive sleep apnea (OSA), which continues into the postoperative recovery period.1–3 Postoperative OSA, even in mild forms, can lead to increases in postoperative adverse events, including sudden cardiac death and cardiovascular complications.4,5 In this context, postoperative OSA may add to postoperative risk by altering cardiac autonomic regulation. There is growing evidence that volume overload during surgery can contribute to postoperative OSA.3 The purpose of the current study was to investigate if the onset or worsening of OSA by volume loading will alter cardiac autonomic regulation.
Examination of heart rate variability (HRV), particularly the low-frequency range (0.04–0.15 Hz), has been used to provide a noninvasive estimate of cardiac sympathetic activity, although both sympathetic and parasympathetic inputs may influence HRV at these frequencies.6 Regarding cardiac para-sympathetic activity, it is well established that quantification of HRV in the higher frequency range (0.15 to 0.4 Hz) is a reliable index of cardiac parasympathetic (vagal) modulation.7 Additionally, HRV is an important index of cardiovascular health, as reduced high frequency HRV is predictive of morbidity and mortality in the general population and in patients with cardiovascular disease.8–10
We previously demonstrated that experimental volume loading by infusion of physiologic saline during sleep can induce or worsen OSA in some nonobese males, but not in others.11 Using measures of HRV, we tested the hypothesis that among those subjects in whom acute fluid infusion increased their OSA severity as assessed by apnea-hypopnea index (AHI), sympathetic and parasympathetic modulation of HRV would be increased and decreased, respectively, compared to those in whom the AHI did not increase.
METHODS
This study is a retrospective analysis of a previous study to investigate the effects of saline-induced fluid overloading during sleep on OSA severity.11 The protocol was approved by the Research Ethics Board of Toronto Rehabilitation Institute and participants provided written informed consent prior to participation. The study was performed in accordance with the approved guidelines and regulations.
Study Participants
Twenty-one nonobese (body mass index [BMI] < 30 kg/m2) and normotensive (blood pressure < 140/90 mmHg) males aged 20 to 70 years were recruited by advertisement. Seventeen of the participants were included in the original study11 and four were newly recruited. Only males were included because previous studies have shown that men are more susceptible than women to worsening of OSA due to fluid redistribution during sleep.12,13 Individuals were excluded if they had a previous diagnosis of OSA, slept for less than 1 hour during the protocol, or had central dominant sleep apnea (more than 50% of apneas and hypopneas central). Participants were also excluded if they had tonsillar hypertrophy; a history of cardiovascular, renal, neurological, or respiratory disorders; were taking prescribed medication for these disorders; were taking over-the-counter medication that might influence fluid volume; or if their AHI in the control arm of the study was 30 events/h or more.
Study Procedures
Polysomnography
Polysomnography (PSG) was conducted during the daytime to accommodate scheduling of the nurse required to insert the intravenous line into the participant. All sleep studies began at around noon. To facilitate daytime sleep, participants restricted their sleep to less than 4 hours the night before and refrained from caffeinated beverages and alcohol for at least 12 hours prior to experiments. Subjects slept supine for the study period to control for potential effects of changes in body position on the AHI and other variables. These sleeping conditions, in addition to intravenous volume loading, closely simulated the postoperative period during which patients are sleep deprived prior to surgery and are nursed during recovery in the supine position.2
Standard techniques and criteria were used to score the sleep stages and arousals.14 Thoracoabdominal motion was monitored by respiratory inductance plethysmography, airflow by nasal pressure cannulae, and arterial oxyhemoglobin saturation (SaO2) by pulse oximetry. Apneas were defined as more than 90% reduction from baseline in airflow or thoracoabdominal motion, lasting more than 10 seconds. Hypopneas were defined as more than 30% reduction from baseline in airflow lasting more than 10 seconds, associated with a minimum 3% desaturation or an arousal from sleep.14 Apneas were defined as central or obstructive as previously described.15 Severity of sleep apnea was assessed by the AHI. Obstructive AHI (OAHI) was defined as the number of obstructive apnea or hypopnea events per hour of sleep. The electrocardiogram (ECG) was recorded using a lead-I configuration at 256 Hz.
Blood Pressure, Heart Rate, and Respiratory Measures
An automated sphygmomanometer (BPM 300, BpTru, British Columbia, Canada) was used to measure systolic blood pressure (SBP), diastolic blood pressure, and heart rate (HR) prior to sleep and immediately after the participant awoke. Mean HR was also measured presaline and postsaline infusion using 5-minute ECG segments.
Respiratory rate and an index of tidal volume were measured using the summation of thoracic and abdominal movement collected from respiratory inductance plethysmography. Respiratory measures were calculated during the same period of data from which the segments were selected for analyzing HRV.
Protocol
This was a randomized, single-blind, double crossover study.11 During each study, a 20-gauge intravenous catheter was inserted into the left forearm vein to facilitate infusion of physiologic saline (0.9% NaCl in water). In the control arm, saline was infused at the minimum rate needed to keep the vein open. In the intervention arm, saline was initially infused at the minimum rate until the participant achieved at least 5 minutes of stage N2 sleep, at which point a bolus of 22 mL/kg body weight saline was infused over 30 minutes. Complete details of the saline infusion protocol have been previously described.11 Participants were blind to the study arm, but the investigator was aware of the allocation as he/she was required to start and stop the saline infusion. The sleep technician who scored the PSG was blind to the experimental condition. All participants slept supine on a single foam pillow. One week after the first session, participants crossed over to the other study arm.
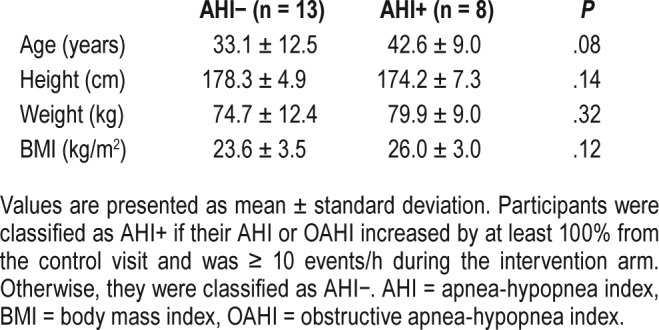
Participants were classified as AHI+ if their AHI or OAHI increased by at least 100% from the control visit and was ≥ 10 events/h during the intervention arm.15 Otherwise, they were classified as AHI−.
Data Analysis
Heart Rate Variability Measures
To compute measurements presaline and postsaline infusion, a single 5-minute ECG segment was selected at the onset of stage N2 sleep before saline was infused, and another single 5-minute segment was selected after saline infusion was complete (Figure 1). The ECG segment-selected postsaline infusion was selected from the first period of stage N2 sleep following saline infusion, which typically occurred during the first sleep cycle. However, some participants experienced stage R sleep before the completion of saline infusion. In those cases (2/8 from AHI+ group and 3/13 from AHI− group), ECG segments were selected from the second sleep cycle. ECG signals were only analyzed during stage N2 sleep to control for the possible effects of sleep stages on HRV.16 ECG data during and 1 minute after an apnea or hypopnea were excluded to avoid the immediate autonomic reflex effect of such events on HRV.17 R-peaks were identified using a semiautomated peak finding procedure in Matlab software to estimate RR intervals (2014a, MathWorks, Natick, Massachusetts).
Figure 1. Time of ECG captures relative to saline infusion and the entire sleep periods.
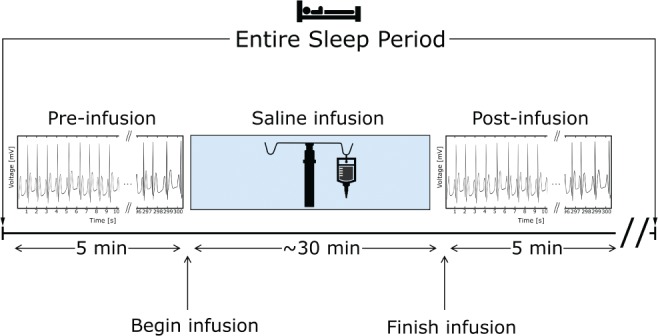
The 5-minute ECG segments were captured before (pre) and after (post) saline infusion.
Preprocessing of the RR interval time series and computation of time and frequency domain measures of HRV were performed using Kubios HRV software (Version 3.0.0, Kubios, Kuopio, Finland)18 in accordance with standard guidelines.19 Artifact correction was performed to remove RR intervals that differed abnormally from the local mean RR interval. The threshold for removing an RR interval was 0.35 seconds, such that any RR intervals greater or less than the local mean by 0.35 seconds were removed. After preprocessing, the following time domain measures of HRV were computed: mean of the RR interval (mean RR), standard deviation of the RR interval (SDNN), and root mean square of successive differences (RMSSD).
Spectral analysis was also performed using the Kubios HRV software. A requirement of spectral analysis is that the RR intervals be equidistantly sampled along the time axis. However, each RR interval datum occurs whenever an R-wave is detected, which means the RR intervals are inherently nonequidistant. A common approach for solving this is to use interpolation methods to convert nonequidistantly sampled time series to equidistantly sampled time series. In particular, we performed a 4 Hz cubic spline interpolation on the RR interval time series. Next, a discrete Fourier transform of the RR time series based on Welch method was performed. Spectral measures computed were low-frequency power (LF: 0.04–0.15 Hz), high-frequency power (HF: 0.15–0.4 Hz), total spectral power, and the ratio of LF to HF (LF:HF) power.
Statistical Analysis
Subject characteristics for both AHI− and AHI+ groups were examined by the independent t test or Mann-Whitney U test. Spectral data were log-transformed to achieve a normal distribution of the data. A two-way analysis of variance was used to compare changes in variables during experiments between the AHI− and AHI+ groups. Data were analyzed presaline and postsaline infusion to compare HRV and ventilatory measures; presleep and post-sleep to compare blood pressure measurements; and at control and intervention study arms to compare sleep apnea outcomes. The interaction effect evaluated differences in the change in variables from either presaline to post-saline infusion; presleep to postsleep; and control to the intervention study arm between AHI− and AHI+ groups. If the interaction effect was significant, we tested the differences between the following groups in outcome variables: presaline versus postsaline infusion, presleep versus postsleep, and control versus intervention using the independent t test or Mann-Whitney U test. The relationship between HRV measures and AHI was examined using Pearson correlation or Spearman rank correlation. A value of P < .05 was considered statistically significant. Statistical analyses were conducted using R open source statistical software version 3.2.1 (The R Foundation, Vienna, Austria). Data are presented as mean ± standard deviation.
RESULTS
Twenty-one males were included in the analysis, of whom 13 were in the AHI− group and 8 were in the AHI+ group. Baseline characteristics of height, weight, and BMI were similar between the AHI− and AHI+ groups (all P > .05, Table 1). However, there was a trend to suggest the AHI+ group was older by 10 years (P = .08).
Table 1.
Baseline characteristics of the subjects.
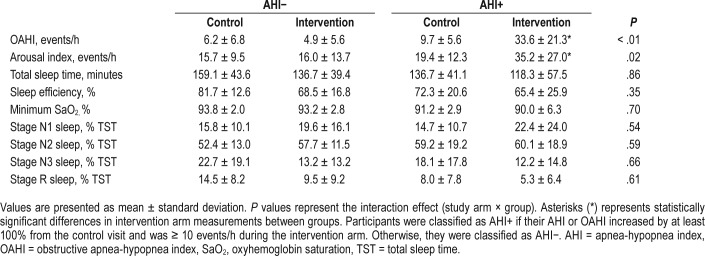
Illustrated in Figure 2, the AHI was similar in the control arm between the AHI+ and AHI− groups (12.8 ± 7.9 versus 9.6 ± 8.2 events/h, respectively; P > .10), but following saline infusion (intervention) the AHI was higher in the AHI+ group, compared to the AHI− group (36.8 ± 23.3 versus 7.7 ± 6.5 events/h, respectively; P < .01). As shown in Table 2, OAHI and arousal index were also similar in the control arm between the AHI+ and AHI− groups (P > .10), but following saline infusion, OAHI was higher in the AHI+ group, compared to the AHI− group (P < .01). Additionally, in both the AHI− and AHI+ groups, sleep efficiency and percentage of time spent in stage N3 sleep were lower in the intervention arm, compared to the control arm (P < .01 and P < .05, respectively). Minimum oxygen saturation, total sleep time, and percentage of time spent in stage N1, N2, and R sleep were not different between the groups or study arms (P > .10).
Figure 2. Change in AHI from control and intervention in both the AHI− and AHI+ groups.
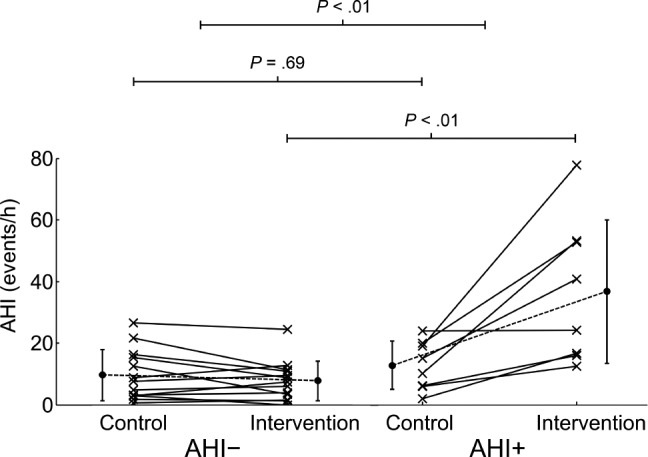
Top horizontal lines represent results of the interaction effect, the middle and lower horizontal bars represent results of the comparisons of preinfusion and postinfusion values between the groups, respectively. Participants were classified as AHI+ if their AHI or OAHI increased by at least 100% from the control visit and was ≥ 10 events/h during the intervention arm. Otherwise, they were classified as AHI−. AHI = apneahypopnea index, OAHI = obstructive apnea-hypopnea index.
Table 2.
Sleep characteristics on the control and intervention day in the AHI− and AHI+ groups.
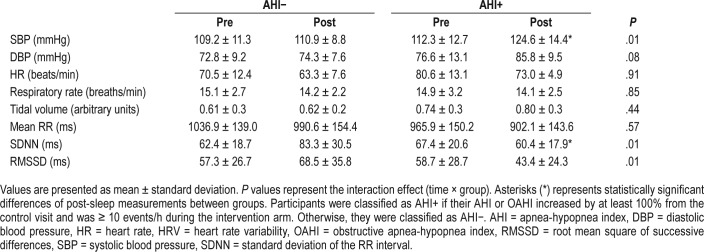
As shown in Table 3, the interaction effect for SBP was statistically significant such that SBP measured pre-sleep was similar between the AHI− and AHI+ groups (P > .10), but post-sleep SBP was higher in the AHI+ than in the AHI− group (P < .05). Diastolic blood pressure showed a similar trend but the interaction effect was not significant (P = .08, Table 3). The interaction effect for HR was not statistically significant (P > .10). Additionally, for both respiratory rate and tidal volume, the interaction effect between groups was not significant (both P > .10, Table 3).
Table 3.
Blood pressure and heart rate measures captured presleep and postsleep, as well as respiratory and HRV measures computed from data captured presaline and postsaline infusion.
With respect to HRV measures, there was no significant interaction effect between the groups for mean RR interval (P > .10, Table 3). There was a significant interaction effect for SDNN (P = .01) and RMSSD (P = .01), as shown in Table 3. At presaline infusion, SDNN and RMSSD were similar between the groups (all P > .10). Postsaline infusion SDNN was lower in the AHI+ group (P < .05) compared to the AHI− group, and RMSSD demonstrated a similar trend (P = .07).
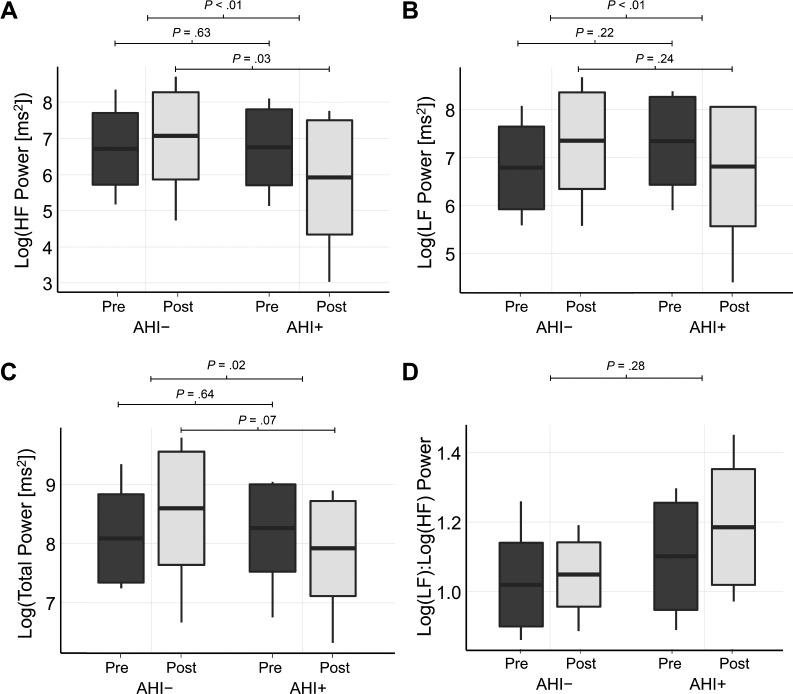
In the frequency domain, there was a significant interaction effect for HF power (P < .01, Figure 3A). At presaline infusion HF power was similar between the groups (P = .63); but postsaline infusion HF power was lower in the AHI+ group (P = .03). For LF power, there was a significant interaction effect (P < .01, Figure 3B); however, between the groups LF power was similar during presaline infusion (P = .22) and post-saline infusion (P = .24). There was also a significant interaction effect for total spectral power (P = .02, Figure 3C). At pre-saline infusion there was no significant difference in total power between the groups (P = .64). However, at post-saline infusion there was a trend to suggest total power was lower in the AHI+ group, compared to the AHI− group (P = .07). Last, for the LF:HF power ratio the interaction effect was not statistically significant (P = .28, Figure 3D).
Figure 3. Box plots illustrating changes in spectral features of HRV from presaline to post-saline infusion in the AHI− and AHI+ groups.
Box plots show changes in high-frequency (HF) power (A), low-frequency (LF) power (B), total power (C), and the ratio of the low-frequency to high-frequency power (D) from presaline to postsaline infusion in the AHI− and AHI+ groups. Mean value is displayed as the horizontal line within the box, limits of the box represent the standard deviation from the mean, and the limits of the vertical line represent the maximum and minimum values. Top horizontal lines represent results of the interaction effect, the middle and lower horizontal bars represent results of the comparisons of preinfusion and postinfusion values between the groups, respectively. Participants were classified as AHI+ if their AHI or OAHI increased by at least 100% from the control visit and was ≥ 10 events/h during the intervention arm. Otherwise, they were classified as AHI−. AHI = apnea-hypopnea index, HRV = heart rate variability, OAHI = obstructive apnea-hypopnea index.
The AHI in the saline infusion arm of the study did not correlate with the change in mean RR interval (r = .06, P = .80), SDNN (r = −.29, P = .21), and total power (r = −.23, P = .32), but did correlate with HF power (r = −.46, P = .04) and trends were observed for RMSSD (r = −.41, P = .06), LF power (r = −.38, P = .09), and LF:HF power (r = .38, P = .09). In addition, arousal index following saline infusion did not correlate with mean RR interval (r = −.33, P = .14), SDNN (r = .10, P = .66), RMSSD (r = .19, P = .40), LF power (r = .23, P = .32), and total power (r = .08, P = .72), but did correlate with LF:HF power (r = .47, P = .03 and trends were observed for HF power (r = −.38, P = .09).
Given the trend that age was higher in the AHI+ group, correlation analysis was also conducted for age and HRV metrics. However, age did not correlate with the change in mean RR interval (r = −.26, P = .25), SDNN (r = −.19, P = .41), RMSSD (r = −.37, P = .10), LF power (r = −.32, P = .16), HF power (r = −.35, P = .12), total power (r = −.14, P = .55), and LF:HF power (r = .29, P = .21). Although not significant, BMI was also higher in the AHI+ group and therefore a correlation analysis was conducted. However, BMI did not correlate with the change in mean RR interval (r = .04, P = .85), SDNN (r = −.12, P = .61), RMSSD (r = −.28, P = .21), LF power (r = −.23, P = .31), HF power (r = −.27, P = .24), total power (r = −.16, P = .50), and LF:HF power (r = .11, P = .64).
DISCUSSION
The current analysis demonstrates that an acute increase in AHI in response to volume loading by saline infusion, simulating the development of postoperative OSA, alters cardiac autonomic regulation in the form of reduced time (SDNN) and spectral (HF power) measures of HRV. These indices reflect reduced cardiac vagal modulation in response to saline infusion in the AHI+ group. Our study conditions therefore demonstrate an immediate effect of OSA on cardiac vagal modulation of heart rate.
These findings are of clinical importance given the effectiveness of HRV in risk stratification for cardiovascular events and mortality. For example, decreased HRV and vagal withdrawal are associated with an increased risk for cardiovascular events in a general population10 and increased mortality in patients with postmyocardial infarction.8,9 Few studies have used the ECG signals from PSG recordings to develop risk stratification using overnight HRV.20 However, decreased HRV from overnight PSG, consistent with decreased vagal control, was associated with increased 5-year mortality in the elderly.21
Prior studies using HRV analysis have demonstrated that OSA is associated with reduced cardiac vagal modulation during sleep17,22–26 and wakefulness.27,28 However, in contrast to these studies, the current investigation controlled for baseline AHI and then used saline infusion to increase the AHI in a subset of participants. This permitted specific examination of the effects of OSA on cardiac vagal modulation. The results are consistent with evidence that acute reversal of OSA by continuous positive airway pressure increased HF power and decreased the LF:HF power ratio.22 Taken together, the current results coupled with the results of previous studies establish that acute increases in severity of OSA during sleep lead to reductions in cardiac vagal modulation that can be corrected upon removal of the stimulus by continuous positive airway pressure.
An alternative mechanism by which saline-induced OSA reduced HRV is through increased atrial stretch caused by the infusion of a saline bolus, which can affect HRV independently of changes to cardiac vagal modulation.29 Horner et al. showed that after both vagal section and β-blockade, stretching the sinoatrial node of a pig's heart decreased SDRR and HF power. These results demonstrate that increased atrial stretch in response to a saline bolus might directly reduce SDRR and HF power, independent of changes to vagal outflow.29 However, in the current study the reduction in vagal heart rate modulation cannot be attributed to stretch alone because it was specific to those in whom OSA developed after saline loading.
Our study was limited by the use of HRV to measure autonomic responses, which restricts accuracy and consistency of HRV for assessing sympathetic activity.30–32 More specifically, surges in sympathetic activity to the ventricle and to resistance vessels may occur without parallel increases in LF oscillations in sinoatrial discharge. Without accurate information on the change in sympathetic activity, it was difficult to explain the rise in SBP that occurred in the AHI+ group, but not the AHI− group. The likely mechanism is the intermittent apnea-related hypoxia and arousals from sleep, which lead to surges in sympathetic nerve activity causing a rise in blood pressure.33 However, this was not shown in the data because LF power and the LF:HF power ratio were not different from presaline to postsaline infusion between the groups. Nonetheless, given the limitations of HRV for assessing sympathetic activity, it is possible that the AHI+ group still experienced an increase in sympathetic vasoconstrictor tone in response to worsening of OSA, despite no differences in LF oscillations of cardiac rhythm between the groups.
The study is also limited by the sample of participants included in the trial. In particular, there was a trend to suggest that the AHI+ group was older than the AHI− group by 10 years. This is not surprising given our previous finding that older men (mean age: 46 years) are more susceptible to OSA by fluid overloading, compared to younger men (mean age: 30 years).11 However, although aging may partially explain increased saline-induced OSA in the AHI+ group, it does not preclude the effect of apneas on HRV observed in the current study. Furthermore, if age was a primary contributor to between-group differences in HRV, measures of HRV captured pre-saline infusion should be different between groups, which was not the case. Instead, it was only after saline infusion that HRV was reduced in the AHI+ group. This is more suggestive of OSA as the primary contributor to the difference in HRV response between the groups. Furthermore, age was not correlated with changes in any of the HRV measures from presaline to postsaline infusion.
The study sample was also restricted to nonobese males, which limits generalizability of the findings. Only men were included because our past work showed that in patients with renal failure and heart failure, strong correlations between overnight shift in leg fluid volume and OSA severity were observed in men, but not women.12,13 Obesity was an exclusion criterion because it might confound the effects of fluid overload on OSA. The study was also limited in its generalizability by requiring participants to deprive themselves of sleep to facilitate daytime sleep. Sleep deprivation can have depressive effects on the upper airway dilator muscles,34 and may therefore amplify OSA severity in the studied group.
Interestingly, the study conditions of sleep deprivation, supine sleep, and volume overload closely simulate the conditions of patients during the postoperative recovery period. As a result, the findings of the current study may be applicable to patients who undergo surgery and in whom OSA develops,1 possibly because of perioperative intravenous volume loading.2 Risk for adverse events, including sudden cardiac death and cardiovascular complications, is increased with the development of OSA in the postoperative period,4 possibly by altering cardiac autonomic regulation.
In conclusion, the current study demonstrates that individuals with saline-induced OSA experience decreased HRV, consistent with cardiac vagal withdrawal, during sleep. The use of infused saline to induce OSA closely simulates the postoperative period where patients are volume loaded and can experience the development or worsening of OSA. In this context, alterations in cardiac autonomic regulation caused by OSA may add to the postoperative risk for cardiovascular events. The possibility that intravenous fluid infusion during surgery can contribute to development or worsening of OSA, cardiac autonomic dysregulation, and cardiovascular events could be tested in future studies.
DISCLOSURE STATEMENT
Research was performed at the University Health Network – Toronto Rehabilitation Institute. All authors have seen and approved the manuscript. The authors report no conflicts of interest. This project was supported by Canadian Institutes of Health Research (CIHR) operating grant MOP-82731, and the CIHR Training Grant in Sleep and Biological Rhythms. D. Vena by Mitacs PhD fellowship. T.D. Bradley by the Clifford Nordal Chair in Sleep Apnea and Rehabilitation Research and the Godfrey S. Pettit Chair in Respiratory Medicine. B. Gavrilovic by fellowships from Toronto Rehabilitation Institute.
ABBREVIATIONS
- AHI
apnea-hypopnea index
- BMI
body mass index
- ECG
electrocardiogram
- HF
high frequency
- HR
heart rate
- HRV
heart rate variability
- LF
low frequency
- LF:HF
ratio of LF to HF power
- Mean RR
mean of the RR interval duration
- OAHI
obstructive apnea-hypopnea index
- OSA
obstructive sleep apnea
- PSG
polysomnography
- RMSSD
root mean square of successive differences
- SBP
systolic blood pressure
- SDNN
standard deviation of the RR intervals
REFERENCES
- 1.Chung F, Liao P, Yegneswaran B, Shapiro CM, Kang W. Postoperative changes in sleep-disordered breathing and sleep architecture in patients with obstructive sleep apnea. Anesthesiology. 2014;120(2):287–298. doi: 10.1097/ALN.0000000000000040. [DOI] [PubMed] [Google Scholar]
- 2.Ramachandran SK. Can intravenous fluids explain increased postoperative sleep disordered breathing and airway outcomes? Sleep. 2014;37(10):1587–1588. doi: 10.5665/sleep.4062. [DOI] [PMC free article] [PubMed] [Google Scholar]
- 3.Lam T, Singh M, Yadollahi A, Chung F. Is perioperative fluid and salt balance a contributing factor in postoperative worsening of obstructive sleep apnea? Anesth Analg. 2016;122(5):1335–1339. doi: 10.1213/ANE.0000000000001169. [DOI] [PubMed] [Google Scholar]
- 4.Opperer M, Cozowicz C, Bugada D, et al. Does obstructive sleep apnea influence perioperative outcome? A qualitative systematic review for the society of anesthesia and sleep medicine task force on preoperative preparation of patients with sleep-disordered breathing. Anesth Analg. 2016;122(5):1321–1334. doi: 10.1213/ANE.0000000000001178. [DOI] [PubMed] [Google Scholar]
- 5.Memtsoudis SG, Stundner O, Rasul R, et al. The impact of sleep apnea on postoperative utilization of resources and adverse outcomes. Anesth Analg. 2014;118(2):407–418. doi: 10.1213/ANE.0000000000000051. [DOI] [PMC free article] [PubMed] [Google Scholar]
- 6.Kleiger RE, Stein PK, Bigger JT. Heart rate variability: measurement and clinical utility. Ann Noninvasive Electrocardiol. 2005;10(1):88–101. doi: 10.1111/j.1542-474X.2005.10101.x. [DOI] [PMC free article] [PubMed] [Google Scholar]
- 7.Hayano J, Sakakibara Y, Yamada A, et al. Accuracy of assessment of cardiac vagal tone by heart rate variability in normal subjects. Am J Cardiol. 1991;67(2):199–204. doi: 10.1016/0002-9149(91)90445-q. [DOI] [PubMed] [Google Scholar]
- 8.Kleiger RE, Miller JP, Bigger JT, Moss AJ. Decreased heart rate variability and its association with increased mortality after acute myocardial infarction. Am J Cardiol. 1987;59(4):256–262. doi: 10.1016/0002-9149(87)90795-8. [DOI] [PubMed] [Google Scholar]
- 9.Bigger JT, Fleiss JL, Steinman RC, Rolnitzky LM, Kleiger RE, Rottman JN. Frequency domain measures of heart period variability and mortality after myocardial infarction. Circulation. 1992;85(1):164–171. doi: 10.1161/01.cir.85.1.164. [DOI] [PubMed] [Google Scholar]
- 10.Tsuji H, Larson MG, Venditti FJ, et al. Impact of reduced heart rate variability on risk for cardiac events The Framingham Heart Study. Circulation. 1996;94(11):2850–2855. doi: 10.1161/01.cir.94.11.2850. [DOI] [PubMed] [Google Scholar]
- 11.Yadollahi A, Gabriel JM, White LH, Montemurro LT, Kasai T, Bradley TD. A randomized, double crossover study to investigate the influence of saline infusion on sleep apnea severity in men. Sleep. 2014;37(10):1699–1705. doi: 10.5665/sleep.4084. [DOI] [PMC free article] [PubMed] [Google Scholar]
- 12.Kasai T, Motwani SS, Yumino D, Mak S, Newton GE, Bradley TD. Differing relationship of nocturnal fluid shifts to sleep apnea in men and women with heart failure. Circ Heart Fail. 2012;5(4):467–474. doi: 10.1161/CIRCHEARTFAILURE.111.965814. [DOI] [PubMed] [Google Scholar]
- 13.Su MC, Chiu KL, Ruttanaumpawan P, et al. Difference in upper airway collapsibility during wakefulness between men and women in response to lower-body positive pressure. Clin Sci. 2009;116(9):713–720. doi: 10.1042/CS20080321. [DOI] [PubMed] [Google Scholar]
- 14.Berry RB, Brooks R, Gamaldo CE, Hardling S, Marcus CL, Vaughn BV for the American Academy of Sleep Medicine. The AASM Manual for the Scoring of Sleep and Associated Events. Rules, Terminology and Technical Specifications. Darien, IL: American Academy of Sleep Medicine; 2012. Version 2.0. [Google Scholar]
- 15.Gavrilovic B, Bradley TD, Vena D, et al. Factors predisposing to worsening of sleep apnea in response to fluid overload in men. Sleep Med. 2016;23:65–72. doi: 10.1016/j.sleep.2016.05.003. [DOI] [PubMed] [Google Scholar]
- 16.Vanoli E, Adamson PB, Ba-Lin, Pinna GD, Lazzara R, Orr WC. Heart rate variability during specific sleep stages. Circulation. 1995;91(7):1918–1922. doi: 10.1161/01.cir.91.7.1918. [DOI] [PubMed] [Google Scholar]
- 17.Vanninen E, Tuunainen A, Kansanen M, Uusitupa M, Lansimies E. Cardiac sympathovagal balance during sleep apnea episodes. Clin Physiol. 1996;16(3):209–216. doi: 10.1111/j.1475-097x.1996.tb00569.x. [DOI] [PubMed] [Google Scholar]
- 18.Tarvainen MP, Niskanen J-P, Lipponen JA, Ranta-Aho PO, Karjalainen PA. Kubios HRV-heart rate variability analysis software. Comput Methods Programs Biomed. 2014;113(1):210–220. doi: 10.1016/j.cmpb.2013.07.024. [DOI] [PubMed] [Google Scholar]
- 19.Task Force of the European Society of Cardiology the North American Society of Pacing Electrophysiology. Heart rate variability: standards of measurement, physiological interpretation, and clinical use. Circulation. 1996;93(5):1043–1065. [PubMed] [Google Scholar]
- 20.Stein PK, Pu Y. Heart rate variability, sleep and sleep disorders. Sleep Med Rev. 2012;16(1):47–66. doi: 10.1016/j.smrv.2011.02.005. [DOI] [PubMed] [Google Scholar]
- 21.Stein P, Domitrovich P, Lundequam E, Redline S. Decreased heart rate variability from polysomnography predicts mortality in the elderly [abstract] Sleep. 2007;30:A110–A111. [Google Scholar]
- 22.Khoo MC, Kim TS, Berry RB. Spectral indices of cardiac autonomic function in obstructive sleep apnea. Sleep. 1999;22(4):443–451. doi: 10.1093/sleep/22.4.443. [DOI] [PubMed] [Google Scholar]
- 23.Penzel T, Kantelhardt JW, Grote L, Peter JH, Bunde A. Comparison of detrended fluctuation analysis and spectral analysis for heart rate variability in sleep and sleep apnea. IEEE Trans Biomed Eng. 2003;50(10):1143–1151. doi: 10.1109/TBME.2003.817636. [DOI] [PubMed] [Google Scholar]
- 24.Guilleminault C, Poyares D, Rosa A, Huang YS. Heart rate variability, sympathetic and vagal balance and EEG arousals in upper airway resistance and mild obstructive sleep apnea syndromes. Sleep Med. 2005;6(5):451–457. doi: 10.1016/j.sleep.2005.03.014. [DOI] [PubMed] [Google Scholar]
- 25.Dingli K, Assimakopoulos T, Wraith PK, Fietze I, Witt C, Douglas NJ. Spectral oscillations of RR intervals in sleep apnoea/hypopnoea syndrome patients. Eur Respir J. 2003;22(6):943–950. doi: 10.1183/09031936.03.00098002. [DOI] [PubMed] [Google Scholar]
- 26.Wang W, Tretriluxana S, Redline S, Surovec S, Gottlieb DJ, Khoo MC. Association of cardiac autonomic function measures with severity of sleep-disordered breathing in a community-based sample. J Sleep Res. 2008;17(3):251–262. doi: 10.1111/j.1365-2869.2008.00652.x. [DOI] [PMC free article] [PubMed] [Google Scholar]
- 27.Narkiewicz K, Montano N, Cogliati C, van de Borne PJH, Dyken ME, Somers VK. Altered cardiovascular variability in obstructive sleep apnea. Circulation. 1998;98(11):1071–1077. doi: 10.1161/01.cir.98.11.1071. [DOI] [PubMed] [Google Scholar]
- 28.Hilton MF, Chappell MJ, Bartlett WA, Malhotra A, Beattie JM, Cayton RM. The sleep apnoea/hypopnoea syndrome depresses waking vagal tone independent of sympathetic activation. Eur Respir J. 2001;17(6):1258–1266. doi: 10.1183/09031936.01.00009301. [DOI] [PubMed] [Google Scholar]
- 29.Horner SM, Murphy CF, Coen B, et al. Contribution to heart rate variability by mechanoelectric feedback. Stretch of the sinoatrial node reduces heart rate variability. Circulation. 1996;94(7):1762–1767. doi: 10.1161/01.cir.94.7.1762. [DOI] [PubMed] [Google Scholar]
- 30.Goldstein DS, Bentho O, Park MY, Sharabi Y. Low-frequency power of heart rate variability is not a measure of cardiac sympathetic tone but may be a measure of modulation of cardiac autonomic outflows by baroreflexes. Exp Physiol. 2011;96(12):1255–1261. doi: 10.1113/expphysiol.2010.056259. [DOI] [PMC free article] [PubMed] [Google Scholar]
- 31.Houle MS, Billman GE. Low-frequency component of the heart rate variability spectrum: a poor marker of sympathetic activity. Am J Physiol. 1999;276(1 Pt 2):H215–H223. doi: 10.1152/ajpheart.1999.276.1.H215. [DOI] [PubMed] [Google Scholar]
- 32.Notarius CF, Floras JS. Limitations of the use of spectral analysis of heart rate variability for the estimation of cardiac sympathetic activity in heart failure. Europace. 2001;3(1):29–38. doi: 10.1053/eupc.2000.0136. [DOI] [PubMed] [Google Scholar]
- 33.Somers VK, Dyken ME, Clary MP, Abboud FM. Sympathetic neural mechanisms in obstructive sleep apnea. J Clin Invest. 1995;96(4):1897–1904. doi: 10.1172/JCI118235. [DOI] [PMC free article] [PubMed] [Google Scholar]
- 34.Leiter JC, Knuth SL, Bartlett D. The effect of sleep deprivation on activity of the genioglossus muscle. Am Rev Respir Dis. 1985;132(6):1242–1245. doi: 10.1164/arrd.1985.132.6.1242. [DOI] [PubMed] [Google Scholar]


