

Abstract
Study Objectives:
Reference data for sleep are needed for the interpretation of clinical sleep parameters. This analysis aimed to provide polysomnography-measured, spectral analytic and subjective reference data based on a sample of healthy adults. In addition, effects of age and sex were investigated.
Methods:
The sample was selected from the archival database of the Sleep Center at the University Medical Center Freiburg and consisted of 206 healthy adults aged 19 to 73 years. For an adaptation and a second examination night, polysomnography parameters, spectral analytic data, and subjective sleep estimations are presented.
Results:
With increasing age, sleep became shorter (less total sleep time, more wake time after sleep onset) and lighter (eg, more percentage of stage N1 sleep, increase in fast activity in the beta range). Sleep in females was deeper than sleep in males (eg, higher percentage of stage N3 sleep). Females had higher overall power density than males. Altogether, it is apparent that sleep parameters exhibit high standard deviations, suggesting a high variability within healthy adults and complicating the specification of reference values.
Conclusions:
Our data suggest that the informative value of sleep reference data in healthy individuals is limited because of high interindividual and intraindividual variation within sleep variables. More research, preferably in the form of meta-analyses and/or large international databases, is needed to further investigate the relevance of such reference data for mental and physical health. In the absence of such knowledge, giving patients feedback about deviations from the norm in their sleep profile may give rise to ill-founded concerns and worry.
Citation:
Hertenstein E, Gabryelska A, Spiegelhalder K, Nissen C, Johann AF, Umarova R, Riemann D, Baglioni C, Feige B. Reference data for polysomnography-measured and subjective sleep in healthy adults. J Clin Sleep Med. 2018;14(4):523–532.
Keywords: healthy adults, polysomnography, reference data, sleep, subjective sleep
BRIEF SUMMARY
Current Knowledge/Study Rationale: A classification of sleep parameters as normal or pathologic is important in order to detect disorders and need for treatment. Such a classification is difficult because clear cutoffs are not available for many parameters.
Study Impact: With our set of normative data of a sample of 206 healthy adults, comprising polysomnography parameters, spectral analytic data, and subjective sleep estimations for 2 consecutive nights, we provide an orientation and guidance for sleep clinicians. However, in light of high interindividual and intraindividual variation within sleep variables, we are far from being able to derive and establish clear cutoff values for healthy versus unhealthy sleep.
INTRODUCTION
The current gold standard tool for the measurement of physiological sleep is polysomnography (PSG). In addition, subjective estimations of sleep with sleep diaries and questionnaires are important because some sleep disorders (such as insomnia) are mainly diagnosed based on subjective complaints. A differentiation between a “normal” and a “pathological” polysomno-gram or sleep diary, yet, is not easy, because values that allow clinicians to determine normal versus pathological sleep are not available for many variables.
Several research groups have provided reference data sets for sleep in healthy adults and, in addition, have investigated differences between the sexes and age changes.1–6 An early publication on the topic was provided by Karacan et al.,6 who investigated sleep in a group of 17 adolescents over 4 years. Their main findings were that there were only small differences between the sexes and that slow wave sleep reached a peak in teenage adolescents. More recent investigations of larger adult samples found decreases in sleep continuity (eg, total sleep time) and sleep depth (eg, percentage of slow wave sleep) with age3 and replicated the finding that differences between the sexes were subtle or absent.2
The authors of a meta-analysis summarizing PSG studies in healthy adults found that total sleep time, sleep efficiency, percentage of slow wave sleep, percentage of stage R sleep, and REM sleep latency significantly decreased with age, whereas sleep latency, percentage of stage N1 sleep, percentage of stage N2 sleep, and wake after sleep onset increased. Within this meta-analysis, large heterogeneity between the included studies was found, that may, among other factors, be attributable to the quality of subject screening.
The aim of the current study was to add to the existing data by providing a replication and verification of previous data regarding PSG-measured sleep in healthy adults, and to critically discuss the relevance of such normative data. In addition, the current study complements the existing literature by providing subjective sleep estimations and power spectral data. Specifically, we measured sleep via PSG, power spectral density, and subjective reports for 2 consecutive nights in a sleep laboratory in a sample of 206 healthy adults aged 19 to 73 years.
METHODS
Sample
The sample was selected from the total sample of healthy individuals in the archival database of the Sleep Center at the Department of Psychiatry and Psychotherapy, Medical Center - University of Freiburg. Healthy participants were recruited as control participants for different sleep studies and received financial remuneration for participation. All participants underwent an extensive screening procedure, including a detailed clinical interview with experienced sleep clinicians (medical doctors and clinical psychologists), routine physical examination, routine electrocardiogram and routine electroencephalogram (EEG), and standard blood count. Individuals in the current sample were examined in the sleep laboratory for 2 consecutive nights between 1996 and 2015.
Inclusion criteria for the current study were age 18 years or older, availability of data for 2 consecutive nights of PSG and spectral data, availability of subjective sleep data for the same 2 nights, time in bed between 450 and 550 minutes for both nights, and total sleep time (TST) above 210 minutes for both nights. Participants with lower TST were excluded because such outliers are likely to reflect special circumstances, not normal sleep.
Exclusion criteria were lifetime history of any sleep disorder according to the International Statistical Classification of Diseases and Related Health Problems, 10th Revision criteria in the clinical interview (eg, insomnia, hypersomnia, parasomnia, sleep apnea syndrome, restless legs syndrome, shift work disorder, and circadian rhythm sleep disorder), irregular sleep wake schedule or international flight 2 weeks prior to the sleep laboratory examination, lifetime history of any psychiatric disorder, lifetime history of any clinically relevant medical or neurological disorder, abuse of or dependency on alcohol or illegal drugs, caffeine intake > 900 mg per day, excessive nicotine use (> 10 cigarettes per day), use of hypnotic medication or medication known to affect sleep during the 2 weeks before or during the sleep laboratory examination, and pregnancy. All studies were conducted in accordance with the Declaration of Helsinki. All individuals gave their informed written consent that their data may be analyzed and published in anonymized form for scientific purposes.
Procedures
All participants underwent 2 consecutive nights of PSG. Sleep was recorded on a 24-channel EEG PSG device for 8 to 9 hours per night from “lights out” (10:00 pm –11:00 pm) until “lights on” (6:00 am – 7:00 am) and digitized at a rate of 200 Hz. All recordings included EEG (C3-A2; C4-A1), electrooculography (horizontal and vertical), and electromyography (submental), and were scored visually by experienced raters. The earlier studies (before 2008) were scored according to Rechtschaffen and Kales criteria.7 From 2008 onward, the American Academy of Sleep Medicine (AASM) criteria8 have been used and additional frontal (Fz) and occipital (Oz) electrodes were included, using Cz as a reference. For consistency reasons, in the older studies, the scored data for stage 3 and stage 4 sleep were combined into stage N3 sleep. Seventy-seven participants were investigated before 2008 according to Rechtschaffen and Kales criteria, and 129 were scored according to AASM criteria from 2008 onward. The following sleep continuity variables were determined: sleep period time (SPT), time from sleep onset until final awakening; TST; sleep efficiency (SE), ratio of TST to time in bed / 100%; sleep onset latency (SOL); wake after sleep onset (WASO), wake time within the SPT. The following sleep architecture variables were determined: REM sleep latency, time from sleep onset until first epoch of stage R sleep; amount of wake and stage N1, N2, N3, and R sleep as a percentage of SPT; number of awakenings within TST; arousal index, number of arousals per hour; periodic limb movements in sleep indices with and without arousal, number of limb movements per hour with and without arousal; apnea-hypopnea index, number of apneas and hypopneas per hour, REM sleep density, ratio of 3-second mini-epochs per REM sleep period, including at least one rapid eye movement, to all of the 3-second mini-epochs per REM sleep (100%).
EEG Spectral Analysis
A standard procedure was used for EEG spectral analysis.9 An all-night spectral analysis was performed on the same 30-second epochs for which sleep stages had been determined. Within each 30-second epoch, spectral power was calculated using the fast Fourier transform algorithm from 22 512-point windows overlapping by half, resulting in a spectral resolution of 0.39 Hz. The goal of the further analysis was to minimize the effects of confounding variables on the spectra averaged across epochs, such as the number of movements or arousals and other sleep parameters that can be analyzed separately.10 This was done by a fully automatic exclusion of “deviant” epochs from the average. Deviant epochs were those containing movements or arousals as determined during staging. All-night spectral power averages (alpha [8–12 Hz], beta 1 [16–24 Hz], beta 2 [24–32 Hz], delta 1 [0.1–1.0 Hz], delta 2 [1.0–3.5 Hz], theta [3.5–8 Hz], gamma [32–48 Hz], sigma 1 [12–14 Hz], and sigma 2 [14–16 Hz] were obtained across all artifact-free epochs of stage N2 and R sleep separately.
Subjective Data
The Sleep Questionnaire-A (SF-A) was administered in the morning after both sleep laboratory nights.11 The SF-A captures subjective aspects of sleep in the preceding night, including subjective ratings of TST, SOL, and WASO. Subjective SE was calculated using SF-A wake times and bed times documented in the sleep laboratory as a way to eliminate discrepancies solely due to erroneous bed time responses in the questionnaire. Sleep quality was computed as the arithmetic mean of seven SF-A subscales.11 On the seven subscales, participants rated how regular, deep, relaxed, calm, undisturbed, good, and extensive their sleep had been in the preceding night on five-point Likert scales. Values range from 1 (not at all) to 5 (very much). Higher values indicate better subjective sleep quality.
Statistical Analysis
All statistics were calculated with SPSS version 22 (IBM Corp, Armonk, New York, United States). First, with the objective of providing reference data for healthy individuals, means and standard deviations (SD) were calculated for all PSG and subjective sleep parameters. In addition, percentiles were calculated for the PSG variables. Secondary analyses were carried out to test for the influence of age and sex on sleep variables, and linear regression analyses were calculated with the predictors age and sex and the sleep variables as dependent variables. For paired samples, t tests were carried out to test for the influence of night number (first versus second night) on sleep continuity variables and percentages of sleep stages. To test for symmetric data distribution as a prerequisite for the linear regression analyses, the distribution of the dependent variables was visually inspected with histograms. Logarithmic transformation was performed for variables with skewed distributions. This was the case for the variables SOL, WASO, subjective WASO, and percentage of stage N1 sleep (skewed to the right) as well as TST and SE (skewed to the left).
RESULTS
Description of the Sample
The sample consisted of 85 males and 121 females with a mean age of 39.8 ± 12.9 years. The age range for the total sample was 19–73 years. In line with Mitterling et al.,2 individuals were divided into five age groups: 19–30 years (34 female, 39 male), 31–40 years (16 female, 20 male), 41–50 years (35 female, 15 male), 51–60 years (30 female, 17 male), and older than 60 years (6 female, 4 male).
Reference Data
Reference data (mean ± SD) for the PSG variables are listed in Table 1. Reference data for subjective sleep are shown in Table 2. Reference data for spectral data are listed in Table 3. Percentiles for PSG variables and spectral data are shown in Figure 1, Figure 2, Figure 3, and Figure 4.
Table 1.
Polysomnography data for healthy subjects.

Table 2.
Subjective sleep data for healthy subjects.

Table 3.
Logarithmic spectral band power.

Figure 1. Percentile curves for total sleep time, wake time after sleep onset, sleep onset latency, sleep efficiency, and percentages of wake and different sleep stages.

Figure 2. Percentile curves for logarithmic spectral power during stage N2 sleep.

Percentile curves for logarithmic spectral power during stage N2 sleep for alpha (8–12 Hz), beta 1 (16–24 Hz), beta 2 (24–32 Hz), delta 1 (0.1–1.0 Hz), delta 2 (1.0–3.5 Hz), theta (3.5–8 Hz), gamma (32–48 Hz), sigma 1 (12–14 Hz), and sigma 2 (14–16 Hz).
Figure 3. Percentile curves for logarithmic spectral power during stage R sleep.

Percentile curves for logarithmic spectral power during stage R sleep for alpha (8–12 Hz), beta 1 (16–24 Hz), beta 2 (24–32 Hz), delta 1 (0.1–1.0 Hz), delta 2 (1.0–3.5 Hz), theta (3.5–8 Hz), gamma (32–48 Hz), sigma 1 (12–14 Hz), and sigma 2 (14–16 Hz).
Figure 4. Sleep EEG spectral power density in stage N2 sleep and stage R sleep.
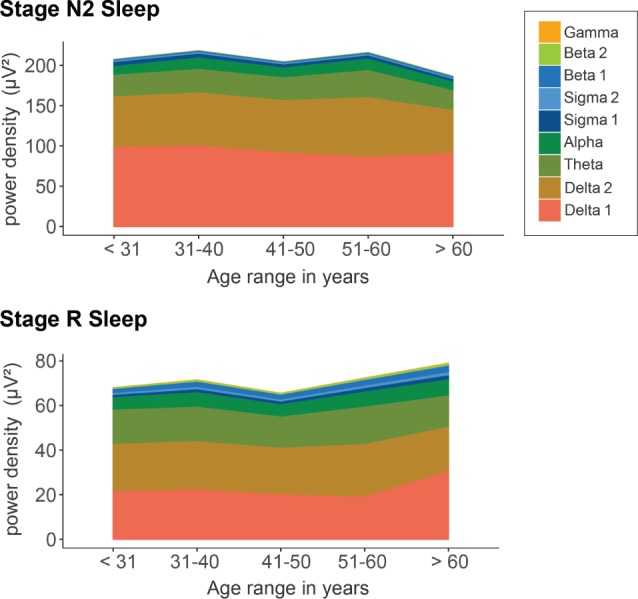
Bands were defined as follows: alpha = 8–12 Hz, beta 1 = 16–24 Hz, beta 2 = 24–32 Hz, delta 1 = 0.1–1.0 Hz, delta 2 = 1.0–3.5 Hz, gamma = 32–48 Hz, sigma 1 = 12–14 Hz, sigma 2 = 14–16 Hz, theta = 3.5–8 Hz.
Influence of Age and Sex on Polysomnography
The results of the linear regression analysis investigating the influence of age and sex on polysomnography and spectral data are shown in Table 4. Age was a significant predictor of the following variables: objective TST, SE, and WASO as well as number of wake periods, arousal index, percentages of wake, stage N1, R, and N3 sleep, REM sleep density, as well as subjective TST, SE, and WASO, such that sleep became shorter (ie, less total sleep time, more wake time after sleep onset) and lighter (ie, more percentage of stage N1 sleep, less percentage of stage N3 sleep) with age. Sex was a significant predictor of PSG-measured number of wake periods, percentage of stage N1 and N3 sleep, whereby sleep in females was deeper than in males (less wake periods and percentage of stage N1 sleep, higher percentage of stage N3 sleep in females). Interestingly, sex was not a significant predictor of subjective sleep quality. The amount of variance explained through age and sex was between 10% and 27% for PSG-measured SE, WASO, the amount of wake periods, percentage of wake, and percentage of stage N1 and N3 sleep as well as periodic limb movements in sleep index with and without arousal. The explained variance was in the single digit range for all other variables (including subjective sleep).
Table 4.
Linear regression analysis.

Influence of Night Number on Polysomnography
Paired sample t tests yielded highly significant effects (all P < .001) of night number on TST, SE, SOL, WASO, arousal indices, and percentages of wake and sleep stages. The results were consistent with the first-night effect hypothesis whereby sleep was better during the second night (longer TST, higher SE, shorter SOL and WASO, lower arousal index, lower percentages of wake and stage N1 sleep, higher percentages of stage N2, N3, and R sleep).
Influence of Age and Sex on Spectral Data
As shown in Table 4, age was a significant predictor of beta and sigma power during stage R sleep as well as delta 1 and sigma 1 power during stage N2 sleep. The results of the spectral analysis complement the results of the PSG analysis so that sleep became lighter with age (increase in fast activity in the beta range, less sigma activity, ie, sleep spindles range). Sex was a significant predictor of almost all spectral variables, so that females had higher overall power density than males.
DISCUSSION
The current analysis of PSG, EEG power spectral density, and subjective sleep estimations provides a set of reference data for sleep researchers and clinicians. It is apparent that most sleep continuity variables exhibit relatively high standard deviations, indicating a high variability within this group of healthy adults. For example, for the total sample of males, the area of one standard deviation around the mean was 4 to 40 minutes for SOL and 71% to 93% for SE. This indicates that values often classified as pathological by clinicians, such as a SOL longer than 30 minutes and a SE below 80%, are well within the bounds of the healthy sample.
For a comparison of our PSG results to previously published reference data, we focus on two recent publications by Mitterling et al.2 and Danker-Hopfe et al.3 with which we find large similarities. Our findings of decreases in sleep continuity and changes in sleep architecture with age corroborate previous publications and most likely reflect normal aging processes. In line with our data, Mitterling et al.2 found decreases in TST, SE, and percentages of stage N3 and R sleep as well as increases in WASO with age. Danker-Hopfe et al.3 also found similar influences of age, though they did not perform a statistical comparison between age groups. In contrast to our results, Mitterling et al.2 did not find significant changes in percentages of stage N1 sleep with age. This discrepancy may be due to differences in the sample, setup, or scoring procedures (ie, Mitterling et al. had only one investigation night without adaptation and scored according to AASM criteria whereas we had an adaptation night and scored primarily according to Rechtschaffen and Kales criteria). In line with our results, Mitterling et al.2 found sex differences for the percentages of stage N1 sleep, but not for most of the other investigated sleep variables. Our results complement previous findings with the result that sex did not influence subjective sleep.
Earlier publications also demonstrated marked effects of age and sex on spectral density.5,12 Previous findings suggest that aging leads to a decrease of homeostatic sleep pressure and an increase in cortical arousal during sleep.7 Corroborating this hypothesis, our data show a decrease in non-rapid eye movement sigma activity with increasing age (sleep spindle range) that has been identified as a marker of stable, interference-resistant sleep,13 as well as an increase of power in the beta range that is associated with cognitive processes.14 This pattern of age-related changes suggests that with increasing age, sleep becomes more prone to external disturbances (eg, noise), and increasingly resembles wake-like cognitive activity, which may lead to enhanced remembering of cognitive processes during sleep and the subjective experience of sleep disturbance. Our finding that females have higher power density in most spectra is also consistent with previous results4,5 and may, among other potential factors, be related to differences in cranial bones.14 Whereas Carrier et al.5 found this difference only in the delta, theta, alpha 1, and sigma 2 band, Svetnik et al.,4 Dijk et al.,15 and our own analysis demonstrated higher power density in females throughout all bands.
We believe that our data add to the existing literature in terms of replication and verification of previous results in a different sample. Strengths of the current analysis include the large and thoroughly screened sample of healthy good sleepers, the presence of 2 consecutive nights of PSG, and the inclusion of spectral data and subjective sleep ratings. A limitation is the small number of individuals older than 60 years, which is due to difficulties in recruiting healthy participants without medication in this age group. A further limitation is that all reference data were collected under laboratory conditions. Thus, the results cannot be generalized to sleep in the home environment or to different laboratory conditions (eg, different bedtimes and rise times or a different time in bed). In addition, because older studies (before 2008) were scored according to Rechtschaffen and Kales criteria, including only central EEG without frontal and occipital electrodes, the percentage of stage N3 sleep may have been underestimated.
The high clinical importance of sleep is underpinned by high prevalence rates of sleep disturbances in patients with mental16 and neurological17 disorders, the identification of sleep disorders as predictors for the de novo onset of other diseases. For example, insomnia is seen as a predictor of major depression,18 REM sleep behavior disorder as a predictor of neurodegenerative disorders,19 as well as the identification of sleep characteristics as predictors of the course of illness and treatment response (eg, mortality in chronic heart failure,20 relapse in alcohol dependence,21 and recurrence in depression22,23).
However, the potential predictive value of sleep variations in mentally and physically healthy individuals (eg, for the de novo onset of a disorder) is less well studied. Therefore, the significance of reference data for healthy individuals and the informative value of deviations from the reference framework in the absence of a manifest sleep disorder are not well understood.
Better subjective sleep in healthy individuals seems to be associated with aspects of better physical health. For example, in a sample of 153 healthy individuals (age range 21–55 years), subjective sleep was monitored over a period of 14 days.24 Subsequently, participants were exposed to a rhinovirus using nasal drops. In participants with fewer than 7 hours of sleep per night, symptoms of a cold were 2.9 times more likely to develop than in individuals with 8 or more hours of sleep. A limitation of the study is that the duration of sleep per night was not related to the individual sleep need of the participants. Although 7 hours of sleep may be sleep restriction for individuals with a high sleep need, the same duration may be enough for habitual short sleepers. However, because the percentage of days with self-reported restful sleep was not associated with the likelihood of catching a cold, it seems rather unlikely that the relationship between sleep need and actual sleep time plays an important role in this case.
Although this study suggests that measures of sleep continuity and sleep architecture are associated with various health outcomes in healthy individuals, we are far from being able to derive and establish clear cutoff values for healthy versus unhealthy sleep for most PSG-measured and subjective sleep variables. In medicine and clinical psychology, reference data are often used to describe an individual in relation to the population. Such a classification is important for the identification of pathological deviations from the norm, which are indicative of certain diseases and may need treatment. Abnormal values are typically defined as values that are above or below a certain percentile rank (often 2.5%, meaning that the value of the patient is higher or lower than the values of 97.5% of healthy control persons).
The difficulty in providing such reference data for sleep is due to the high interindividual and intraindividual variations as well as a paucity of research into the long-term outcomes of so-called “poor” PSG-measured and subjective sleep in healthy individuals. Currently in society, however, there is an abundant interest in monitoring physiological functions to manage and optimize health and health care. This also comprises sleep, which is reflected in an increasing number of devices and smartphone applications aiming to measure, interpret, and improve sleep. Although a commitment to health is generally welcome, there are also potential risks and downsides to this development. Monitoring and optimization of a health parameter make sense if a valid healthy target range is known. Yet a definition of healthy, “normal” sleep is difficult. It is probably misleading to conclude that every deviation from a statistical norm (eg, very high or low percentile rank), is pathological. For sleep variables, the “normal” range is quite wide and difficult to define. Sleep clinicians often face the tasks of diagnosing and treating pathological sleep and reassuring clients who are excessively worried about potential adverse consequences of poor sleep.
In light of the high interindividual variations, an appropriate definition of healthy sleep may need to take into account the individual sleep need. Future studies investigating whether a certain degree of discrepancy between individual sleep need and habitual sleep duration makes people more vulnerable to mental and somatic disorders would be of high interest. For this purpose, the development of a large, international sleep database (biobank) is desirable.
DISCLOSURE STATEMENT
All authors have contributed to the preparation of the manuscript and have approved its final version. Work for this study was performed at the Department of Psychiatry and Psychotherapy, Medical Center – University of Freiburg, Faculty of Medicine, University of Freiburg, Germany. Dr. Nissen received speaker honoraria from Vanda Pharmaceuticals during the conduct of the study. The other authors report no conflicts of interest.
ABBREVIATIONS
- AHI
apnea-hypopnea index
- EEG
electroencephalogram
- PLMS
periodic limb movements in sleep
- PSG
polysomnography
- REM
rapid eye movement
- REM sleep density
ratio of 3-second mini-epochs per REM sleep period, including at least one rapid eye movement, to all of the 3-second mini-epochs per REM sleep
- SE
sleep efficiency
- SF-A
Schlaffragebogen (sleep questionaire) A
- SD
standard deviation
- SOL
sleep onset latency
- SPT
sleep period time
- SQ
subjective sleep quality
- TST
total sleep time
- WASO
wake minutes after sleep onset
REFERENCES
- 1.Ohayon MM, Carskadon MA, Guilleminault C, Vitiello MV. Meta-analysis of quantitative sleep parameters from childhood to old age in healthy individuals: developing normative sleep values across the human lifespan. Sleep. 2004;27(7):1255–1273. doi: 10.1093/sleep/27.7.1255. [DOI] [PubMed] [Google Scholar]
- 2.Mitterling T, Högl B, Schönwald SV, et al. Sleep and respiration in 100 healthy Caucasian sleepers--a polysomnographic study according to American Academy of Sleep Medicine Standards. Sleep. 2015;38(6):867–875. doi: 10.5665/sleep.4730. [DOI] [PMC free article] [PubMed] [Google Scholar]
- 3.Danker-Hopfe H, Schäfer M, Dorn H, et al. Percentile reference charts for selected sleep parameters for 20-to 80-year-old healthy subjects from the SIESTA database. Somnologie. 2005;9(1):3–14. [Google Scholar]
- 4.Svetnik V, Snyder ES, Ma J, Tao P, Lines C, Herring WJ. EEG spectral analysis of NREM sleep in a large sample of patients with insomnia and good sleepers: effects of age, sex and part of the night. J Sleep Res. 2017;26(1):92–104. doi: 10.1111/jsr.12448. [DOI] [PubMed] [Google Scholar]
- 5.Carrier J, Land S, Buysse DJ, Kupfer DJ, Monk TH. The effects of age and gender on sleep EEG power spectral density in the middle years of life (ages 20-60 years old) Psychophysiology. 2001;38(2):232–242. [PubMed] [Google Scholar]
- 6.Karacan I, Anch M, Thornby JI, Okawa M, Williams RL. Longitudinal sleep patterns during pubertal growth: four-year follow up. Pediatr Res. 1975;9(11):842–846. doi: 10.1203/00006450-197511000-00008. [DOI] [PubMed] [Google Scholar]
- 7.Rechtschaffen A, Kales A. A Manual of Standardized Terminology, Techniques and Scoring System for Sleep Stages of Human Subjects. US Government Printing Office, US Public Health Service; 1968. [Google Scholar]
- 8.Iber C, Ancoli-Israel S, Chesson AL, Jr, Quan SF for the American Academy of Sleep Medicine. The AASM Manual for the Scoring of Sleep and Associated Events: Rules, Terminology and Technical Specifications. 1st ed. Westchester, IL: American Academy of Sleep Medicine; 2007. [Google Scholar]
- 9.Spiegelhalder K, Regen W, Feige B, et al. Increased EEG sigma and beta power during NREM sleep in primary insomnia. Biol Psychol. 2012;91(3):329–333. doi: 10.1016/j.biopsycho.2012.08.009. [DOI] [PubMed] [Google Scholar]
- 10.Feige B, Voderholzer U, Riemann D, Hohagen F, Berger M. Independent sleep EEG slow-wave and spindle band dynamics associated with 4 weeks of continuous application of short-half-life hypnotics in healthy subjects. Clin Neurophysiol. 1999;110(11):1965–1974. doi: 10.1016/s1388-2457(99)00147-9. [DOI] [PubMed] [Google Scholar]
- 11.Görtelmeyer R. Schlaffragebogen SF-A Und SF-B. Internationale Skalen Für Psychiatrie. Weinheim: Beltz; 1981. [Google Scholar]
- 12.Schwarz JFA, Åkerstedt T, Lindberg E, Gruber G, Fischer H, Theorell-Haglöw J. Age affects sleep microstructure more than sleep macrostructure. J Sleep Res. 2017;26(3):277–287. doi: 10.1111/jsr.12478. [DOI] [PubMed] [Google Scholar]
- 13.Dang-Vu TT, McKinney SM, Buxton OM, Solet JM, Ellenbogen JM. Spontaneous brain rhythms predict sleep stability in the face of noise. Curr Biol. 2010;20(15):R626–R627. doi: 10.1016/j.cub.2010.06.032. [DOI] [PubMed] [Google Scholar]
- 14.Engel AK, Fries P. Beta-band oscillations--signalling the status quo? Curr Opin Neurobiol. 2010;20(2):156–165. doi: 10.1016/j.conb.2010.02.015. [DOI] [PubMed] [Google Scholar]
- 15.Dijk DJ, Beersma DG, Bloem GM. Sex differences in the sleep EEG of young adults: visual scoring and spectral analysis. Sleep. 1989;12(6):500–507. doi: 10.1093/sleep/12.6.500. [DOI] [PubMed] [Google Scholar]
- 16.Baglioni C, Nanovska S, Regen W, et al. Sleep and mental disorders: A meta-analysis of polysomnographic research. Psychol Bull. 2016;142(9):969–990. doi: 10.1037/bul0000053. [DOI] [PMC free article] [PubMed] [Google Scholar]
- 17.Mayer G, Jennum P, Riemann D, Dauvilliers Y. Insomnia in central neurologic diseases - Occurrence and management. Sleep Med Rev. 2011;15(6):369–378. doi: 10.1016/j.smrv.2011.01.005. [DOI] [PubMed] [Google Scholar]
- 18.Baglioni C, Battagliese G, Feige B, et al. Insomnia as a predictor of depression: A meta-analytic evaluation of longitudinal epidemiological studies. J Affect Disord. 2011;135(1-3):10–19. doi: 10.1016/j.jad.2011.01.011. [DOI] [PubMed] [Google Scholar]
- 19.Howell MJ, Schenck CH. Rapid eye movement sleep behavior disorder and neurodegenerative disease. JAMA Neurol. 2015;72(6):707–712. doi: 10.1001/jamaneurol.2014.4563. [DOI] [PubMed] [Google Scholar]
- 20.Reinhard W, Plappert N, Zeman F, et al. Prognostic impact of sleep duration and sleep efficiency on mortality in patients with chronic heart failure. Sleep Med. 2013;14(6):502–509. doi: 10.1016/j.sleep.2012.12.014. [DOI] [PubMed] [Google Scholar]
- 21.Brower KJ, Aldrich MS, Hall JM. Polysomnographic and subjective sleep predictors of alcoholic relapse. Alcohol Clin Exp Res. 1998;22(8):1864–1871. [PubMed] [Google Scholar]
- 22.Giles DE, Jarrett RB, Roffwarg HP, Rush AJ. Reduced rapid eye movement latency. A predictor of recurrence in depression. Neuropsychopharmacology. 1987;1(1):33–39. doi: 10.1016/0893-133x(87)90007-8. [DOI] [PubMed] [Google Scholar]
- 23.Svendsen K, Christensen PG. Duration of REM sleep latency as predictor of effect of antidepressant therapy. A preliminary report. Acta Psychiatr Scand. 1981;64(3):238–243. doi: 10.1111/j.1600-0447.1981.tb00779.x. [DOI] [PubMed] [Google Scholar]
- 24.Cohen S, Doyle WJ, Alper CM, Janicki-Deverts D, Turner RB. Sleep habits and susceptibility to the common cold. Arch Intern Med. 2009;169(1):62–67. doi: 10.1001/archinternmed.2008.505. [DOI] [PMC free article] [PubMed] [Google Scholar]