

Abstract
RNA–protein interactions play numerous roles in cellular function and disease. Here we describe RNA–protein interaction detection (RaPID), which uses proximity-dependent protein labeling, based on the BirA* biotin ligase, to rapidly identify the proteins that bind RNA sequences of interest in living cells. RaPID displays utility in multiple applications, including in evaluating protein binding to mutant RNA motifs in human genetic disorders, in uncovering potential post-transcriptional networks in breast cancer, and in discovering essential host proteins that interact with Zika virus RNA. To improve the BirA*-labeling component of RaPID, moreover, a new mutant BirA* was engineered from Bacillus subtilis, termed BASU, that enables >1,000-fold faster kinetics and >30-fold increased signal-to-noise ratio over the prior standard Escherichia coli BirA*, thereby enabling direct study of RNA–protein interactions in living cells on a timescale as short as 1 min.
RNA–protein interactions are pervasive in biology and play critical roles in regulating cellular function1,2. Approximately 5% of the human proteome is capable of binding RNA3, and recent work has revealed several networks of RNA–protein interactions that regulate genomic stability, cellular signaling and gene expression3–5. Consequently, there is growing interest in using synthetic RNAs as tools to control cellular circuits6,7.
Because of limitations in existing methods, characterization of RNA–protein interactions has lagged despite the growing appreciation of their importance. Current methods that rely on purifying RNAs of interest to discover bound proteins lead to biases from postlysis protein reassortment8–12. RNAs adopt complex structures in cellular environments, and such structures are critical for binding to proteins. Methods to study known RNA–protein interactions, such as RNA-MaP and RNA-compete, require specialized equipment performed in settings that do not reflect RNA–protein interactions in living cells (Supplementary Table 1)13.
To overcome these limitations, a methodology was developed to directly label proteins that bind to specific RNA motifs in intact live cells. A modified promiscuous biotin ligase from E. coli, BirA*, biotinylates proximal proteins within a range of 10 nm and has been used to study protein–protein interactions14,15. Biotinylation of target proteins permits stringent washing and reduces background. Phage biology was leveraged to design a tool using BirA* to biotin-tag proteins bound to RNA motifs in living cells followed by streptavidin pulldown and mass spectrometry to identify RNA-proximal proteins via an approach termed RNA–protein interaction detection (RaPID).
Development of RaPID
RaPID involves two elements—an RNA component and a RaPID protein. The RNA component is comprised of BoxB stem loops flanking any RNA motif of interest (Fig. 1a). Bacteriophage lambda BoxB stem loops bind the λN peptide at high affinity with a dissociation constant of 200 ± 56 pM16. The 22-amino-acid λN peptide fused to the N terminus of the HA-BirA* biotin ligase (λN–HA-BirA*) comprises the protein component. BoxB stem loops recruit the RaPID protein, thereby biotinylating proteins bound to the flanked adjacent RNA motif of interest (Fig. 1a), permitting streptavidin capture of motif-bound proteins for analysis by western blotting and mass spectrometry (MS).
Figure 1.

RNA–protein interaction detection (RaPID). (a) Schematic. BoxB RNA stem loops (blue) flank RNA sequence of interest (red). RaPID (λN-HA-BirA*) fusion protein binding to BoxB sites leads to biotinylation of proteins proximal to inserted RNA sequence in living cells grown in biotin-containing media. Streptavidin (SA) beads capture biotinylated protein for MS or western blotting. (b) Quantification of biotinylated RNA pulldowns (bio-EDEN15 and bio-scr control) versus RaPID-Westerns for EDEN15 (n = 3 biologically independent experiments; bars represent mean signal, and error bars denote s.e.m.; one-way ANOVA performed; ****, P < 0.0001). (c) RaPID-MS for EDEN15 identifies CELF1 as binding partner.
Validation of RaPID with known RNA–protein interactions
EDEN15 is a UG-rich RNA sequence known to bind CELF117. Conventional biotinylated RNA pulldown18 with EDEN15 yielded ~4-fold enrichment of CELF1 proteins over scrambled controls in HEK293T cells (Supplementary Fig. 1a). RaPID RNA and protein components were expressed in HEK293T cells in biotin-containing media, then pulldown of biotinylated proteins was performed using streptavidin beads followed by western blotting (RaPID-Western). The EDEN15 sequence demonstrated significantly higher CELF1 pull-down on RaPID-Western compared to two scrambled control sequences (Fig. 1b). While RaPID cannot be directly compared to conventional biotinylated RNA pulldown methods quantitatively, the latter yields a low enrichment of CELF1 over scrambled control (Fig. 1b and Supplementary Fig. 1). RaPID mass spectrometry (RaPID-MS) was then performed in HEK293T and Huh7 cells, using CRAPome filtering analysis19 and a significance analysis of interactome (SAINT) threshold score of 0.9 to identify true binding proteins (Supplementary Note 1). The SAINT algorithm calculates interaction probabilities ranging from 0 to 1. A SAINT score cutoff of 0.9 was used, as in prior studies19, to ensure high specificity in identifying RNA–protein associations. SAINT scores were plotted against fold change (FC) obtained through CRAPome analysis19. This identified CELF1 as binding partner of the EDEN15 motif in both HEK293T and Huh7 cells (Fig. 1c and Supplementary Tables 2 and 3). The identification of CELF1 as binding partner of EDEN15 confirmed RaPID’s ability to identify known RNA–protein interactions in living cells.
RNA–protein interaction information
RaPID’s capacity to study RNA–protein interactions associated with human disease was next examined. The iron responsive element (IRE) RNA motif in the L-ferritin (FTL) gene transcript is altered by point mutations in Hereditary Hyperferritinemia-Cataract Syndrome (HHCS)20, a disorder characterized by increased serum ferritin levels and early-onset cataracts. IRE motifs are bound by IRE binding proteins, IREB2 and IRP1 (IREB1/ACO1), which regulate the translation/stability of target transcripts in the iron metabolic pathway. RaPID-Western with the wild-type FTL IRE motif showed significant IREB2 enrichment over scrambled controls (Fig. 2a,b), and RaPID-MS in HEK293T cells identified IREB2 as the top IRE binding partner (Supplementary Table 4). Three distinct HHCS FTL IRE point mutations from patients bearing the London, Paris and Verona mutations20 (Fig. 2a) were then compared to WT for binding to IREB2. Replicate RaPID-Westerns demonstrated that disease-associated IRE mutants had lower fold IREB2 binding enrichment compared to wild type IRE (Fig. 2b and Supplementary Fig. 2). Moreover, binding loss correlated with increased serum ferritin levels seen in specific HHCS patient mutations20 (Fig. 2b), although the magnitude of the differences were not quantitatively proportional. These data are consistent with the notion that the severity of HHCS may relate to the extent of IRE–IREBP protein interaction loss and demonstrate RaPID’s sensitivity in assessing the impact of RNA mutations on RNA–protein interactions in living cells.
Figure 2.

Application of RaPID to single-nucleotide human genetic disorders and to viral disease. (a) Schematic of wild-type FTL IRE; circled residues indicate position of previously identified HHCS point mutations; city denotes mutation kindred. (b) RaPID-Western quantified replicates of WT and mutant IREs from HHCS kindreds. IREB2 RaPID signal for each mutant is normalized to IREB2 RaPID signal obtained for wild type and plotted in box graph and serum ferritin levels for each mutant from Allerson et al.20 are shown in green (n = 3 RaPID-Westerns performed, biologically independent experiments). WT, wild type. (c) GO analysis performed on host proteins found to be bound to ZIKV 5′ and 3′ UTR (SAINT score > 0.9) by RaPID-MS. (d) qPCR measurement of ZIKV viral RNA load in U87 cells (n = 3 biologically independent experiments) comparing control shRNA with QKI shRNA samples. Data normalized to control shRNA. Scatter plots with mean signal and error bars denote s.e.m. (e) Quantification of CVB3 viral RNA load in U87 cells (n = 3 biologically independent experiments) comparing control shRNA with QKI shRNA samples, normalized to control shRNA. Scatter plots with mean signal and error bars denote s.e.m.
Increased levels of iron lead to destruction of IREB2 protein and thereby reduce the association of IREB2 with the IRE motif21. In contrast, IRP1 binds to iron and has reduced affinity to IRE21. We performed RaPID-Western in HEK293T cells with ferric ammonium chloride (FAC) added to media to raise iron levels and evaluated the interaction between IRP1 and the IRE. While DMSO and Deferoxamine (DFO) treatment showed IRE motif interaction with IRP1, there was no interaction detected between IRE and IRP1 upon FAC treatment (Supplementary Fig. 3). RaPID can therefore detect changes in RNA–protein interaction in response to exogenous stimuli in living cells.
Identification of host proteins associated with ZIKV RNA
Zika virus (ZIKV) is associated with fetal microcephaly and Guillain–Barré syndrome in adults22. RNA viruses co-opt host proteins at their untranslated regions (UTRs) to aid the viral life cycle23. To identify host proteins that bind ZIKV RNA, RaPID-MS was performed using ZIKV UTR sequences from the current epidemic strain (KU527068) (Supplementary Tables 5 and 6). Host proteins associated with ZIKV UTR sequences were enriched for cell cycle proteins (Fig. 2c and Supplementary Table 7), mirroring the dysregulation in cell cycle genes observed in studies of ZIKV-infected neural progenitor cells (NPCs) (Supplementary Fig. 4a)24. ZIKV is highly neurotropic, thus proteins that bind the ZIKV RNA UTRs were distilled into a subset that display enriched expression in neural tissue (Supplementary Fig. 4b, Supplementary Table 8 and Supplementary Note 2)25. This identified QKI, an RNA-binding protein that is highly expressed in neural progenitor cells (NPCs)26, as the ZIKV RNA-binding protein most enriched in neural tissues. To determine if QKI impacts ZIKV replication, QKI was depleted in the U87 glioblastoma cell line (Supplementary Fig. 4c–e). QKI loss decreased ZIKV viral RNA levels by 90% (Fig. 2d) without altering control Coxsackievirus B3 viral RNA levels (Fig. 2e), suggesting that QKI is a host protein selectively important for ZIKV replication. Interestingly, Qki mutation in mice leads to abnormal neural development, seizures and white matter loss27, which are also observed in congenital ZIKV syndrome. Consistent with this, QKI protein decreases as NPCs differentiate to neurons (Supplementary Fig. 5). ZIKV RNA binding to QKI could thus sequester QKI, contributing to a relative QKI deficiency that may impair neural development.
Characterization of synthetic RNA motifs
To examine RaPID specificity and to expand the scope of RaPID data generation with a goal to discovering additional RNA–protein interactions, RaPID-MS was performed with three representative conserved RNA motifs (Histone SL-UTRP11, PPP1R3C–UTRP30, IRE–UTRP35) identified by a comparative analysis of 41 vertebrate genomes28. Additionally, a synthetic concatamer was generated termed Syn-EIR consisting of the EDEN15, IRE and ROQ CDE motifs, well-characterized RNA motifs that are known to bind CELF1, IREB2 and RC3H1 proteins, respectively. RaPID-MS demonstrated protein-binding selectivity for RNA motifs and Syn-EIR RaPID-MS successfully identified binding of all three proteins to the RNA motif concatamer (Fig. 3a and Supplementary Fig. 6). RaPID thus demonstrates specificity in identifying RNA-proximal proteins and can assess a concatamerized synthetic array of RNA motifs.
Figure 3.

Assessment of RaPID specificity by RaPID-MS and identification of RC3H1 binding to the SM1v1 motif. (a) RaPID-MS summary of LC-MS/MS experiments comprising independent two biological replicates for each RNA sequence examined. RNA sequences (rows) and top interacting proteins (columns) are shown with LC-MS/MS SAINT score noted for each protein–RNA motif pair. Syn-EIR represents a synthetic concatamer of the EDEN15, IRE and ROQ CDE motifs. (b) Analysis of TCGA breast cancer patient survival comparing patients with RC3H1 and RC3H2 upregulation (red line) versus without upregulation (blue line). Logrank test P value calculated using cbioportal noted on plot. (c) CLIP-qPCR (n = 3 biologically independent experiments) shows direct interaction between SM1v1 motif and HA-RC3H1 compared to HA-mCherry (P < 0.0001, exact P value = 0.00005891, P values were calculated using unpaired t-test). Scatter plots with mean signal and error bars denote s.e.m.
RaPID-MS specificity and new RNA–protein interactions
In addition to validating known RNA motif binders, RaPID identified new RNA–protein interactions (Fig. 3a and Supplementary Tables 9–13). Among new interactions identified by RaPID-MS is RC3H1 protein binding to the SM1v1 RNA motif (Fig. 3a and Supplementary Tables 9–13). Tavazoie et al.29 recently demonstrated decreased levels of RNA transcripts bearing SM1v1 motifs in breast cancer patients with advanced tumors. However, putative binding factors to the SM1v1 motif have not been characterized. Analysis of TCGA breast cancer data demonstrated that RC3H1 mRNA upregulation correlates with poorer breast cancer survival (Supplementary Fig. 7a)30,31. RC3H1 and its paralog RC3H2 are known RNA-binding proteins that promote RNA decay32,33. Similar to RC3H1, upregulation of RC3H2 in breast cancer was also correlated with poorer survival (Fig. 3b and Supplementary Fig. 7b,c)30,31. Upregulation of RC3H1 and RC3H2 in breast cancer is mutually exclusive (Fisher exact test, 0.035)30,31. Tavazoie et al.29 showed that SM1v1 presence in the 3′ UTR reduces host transcript stability. CLIP-qPCR demonstrated the direct nature of the interaction between SM1v1 RNA and RC3H1 protein, similar to TNF-CDE RNA and RC3H1 positive control (Fig. 3c), confirming RaPID’s ability to identify new RNA–protein interactions. Taken together with breast cancer survival data, these findings raise the possibility that overexpression of RC3H1 may lead to abnormal post-transcriptional control of RNAs bearing SM1v1-like motifs, potentially contributing to an altered disease course.
Additional BirA* proximity-labeling proteins
E. coli BirA* requires 16–18 h for optimal labeling14,15. To generate a faster biotin ligase for RaPID, the structure of E. coli BirA* was first compared to other biotin ligases present in the UniProt database. Based on structure and sequence analysis, four motifs were identified: (i) a reactive biotin-5-AMP binding motif (RBAM) (ii) an avidin-like biotin binding motif (ABM), (iii) an adenylation motif (AM) and (iv) a proximal to adenylation motif (PTAM) (Fig. 4a and Supplementary Fig. 8). Mutation of a positively charged arginine residue to glycine in the RBAM motif is critical to reduce affinity of biotin ligase to biotin-5-AMP and thereby permit vicinal labeling. We identified four biotin ligases, in addition to E. coli BirA and Aquifex aeolicus (BioID2), which contain RBAM (Fig. 4a)34. Each of the mutant BirA*s were tagged with HA and transfected at equal amounts. BirA*s from Rhodanabacter spp. and Taneralla spp. expressed at a lower level than other BirA*s, making it difficult to compare their activity to the other four ligases (Supplementary Fig. 9b). For B. subtilis biotin ligase, the DNA binding domain was identified to be unnecessary for biotinylation35. Based on sequence and structural alignment, additional C-terminal mutations were made in the B. subtilis protein (Supplementary Fig. 12d) to generate the BASU (from Bacillus subtilis) biotin ligase. BASU was then assessed for labeling activity by exposing cells for 1 h in 200 μM biotin media. BASU displayed substantially higher global streptavidin signal relative to other mutant BirA*s (Fig. 4b and Supplementary Fig. 9b).
Figure 4.
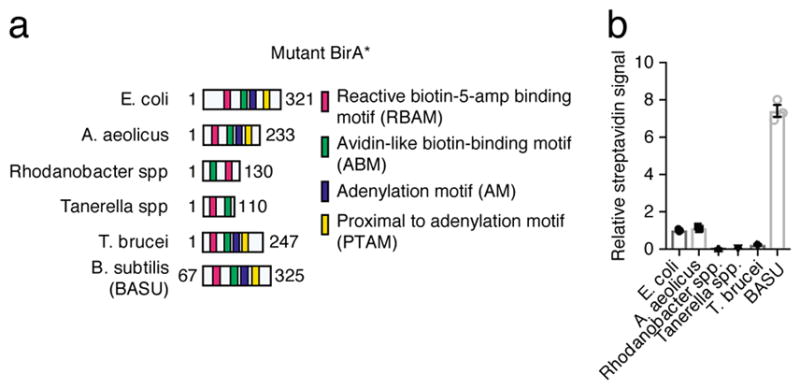
Faster proximity labeling with engineered biotin ligase BASU. (a) Annotation and comparison of biotin ligases used in the screen. (b) Relative streptavidin signal of total cell lysate with each mutant normalized to streptavidin signal obtained using E. coli BirA*.
Increased labeling kinetics and signal-to-noise ratio of RaPID BASU
To compare BASU to E. coli BirA* and BioID2 in the context of RaPID, the RC3H1 protein-binding TNF-CDE RNA motif36 was used. First, equal amounts of TNF-CDE RNA motif and BASU-RaPID protein constructs were transfected in a 6-well plate, with each well biotin labeled from 1 h to 0 min. BASU-RaPID yielded a strong signal in as little as 1 min (Supplementary Fig. 10). Next, cells containing the TNF-CDE RNA motif were biotin pulsed for 1 min with either the BioID2 or BASU construct. At 1 min, no RC3H1 pulldown was detected with the BioID2 (Supplementary Fig. 11a,b). BASU, in contrast, displayed ~250-fold enrichment of RC3H1 compared to TNF-CDE RNA motif to scrambled controls (Supplementary Fig. 11c,d). The E. coli BirA*-based RaPID protein was tested at its 18-h labeling optimum timepoint, which yielded ~8-fold enrichment of RC3H1 (Supplementary Fig. 11e,f). BASU at 1 min labeling is thus able to achieve >30-fold higher fold enrichment relative to E. coli BirA* at 18 h of labeling (Supplementary Fig. 11g). To compare specificity, RaPID-MS with BASU was performed using EDEN15 and IRE RNA motifs. As with RaPID-MS performed with E. coli BirA*, BASU RaPID-MS identified CELF1-EDEN15 and IREB2-IRE interactions (Supplementary Fig. 11h,i and Supplementary Tables 14 and 15). BASU thus improves RaPID labeling speed as well as signal-to-noise ratio with retained specificity.
BASU’s labeling kinetics and nontoxic reagents suggest it is applicable to short timeframe studies in tissue. Mutant peroxidases perform vicinal labeling (APEX2) with similar speed to BASU, but they require cytotoxic reagents, hydrogen peroxide and biotin-phenol, that preclude their use in tissue and model organisms37. E. coli BirA* can study protein–protein interactions in model organisms but has poor labeling kinetics that hinder its use in spatially and temporally resolving protein interactions15. To characterize BASU labeling in tissue, 3D organotypic human skin tissue expressing BASU was exposed to biotin for 0 min (baseline) or 30 min. The same experiment was performed with E. coli BirA. While there was no streptavidin signal observed in E. coli BirA, there was substantial increase in streptavidin signal comparing 0- and 30-min timepoint with BASU (Supplementary Fig. 12). Thus, BASU enables faster function in living tissue.
DISCUSSION
Here we describe RaPID as a method to identify and study RNA–protein interactions in living cells. RaPID labels RNA-associated proteins in living cells without the need for formaldehyde cross-linking and requires fewer cells than many available methods. Because it can interrogate motifs <50 nucleotides long, RaPID may be of particular utility in studying short RNA sequences inaccessible to other available methods requiring greater sequence length.
RaPID has been used to qualitatively assess impact of disease-associated RNA mutations on RNA–protein interactions in living cells. Hence, RaPID could serve as a complement to in vitro methods such as EMSA to study RNA–protein interactions. Moreover, RaPID could help to assay impact of small molecules on RNA– protein interactions. This potentially opens up the opportunity to design and test small molecules against an array of natural and disease variant RNA motifs in living cells. In infectious disease, RaPID identified host proteins that bind ZIKV RNA, including the neural-enriched QKI protein. RaPID can thus incorporate publically available sequence information to discover new pathogen RNA–host protein interactions of biologic significance. Finally, starting with the prior observation that RNA transcripts bearing SM1v1 motifs are decreased in advanced breast cancer, RaPID identified RCH31 as a protein that bound SM1v1 RNA motifs. RC3H1 downregulated a reporter RNA fused to an SM1v1 motif, raising the possibility that RC3H1 may contribute to the dysregulation of RNA levels observed in this setting. Therefore, RaPID enables both characterization as well as discovery of protein–RNA interactions in a variety of applications.
The generation of the smaller and faster biotin ligase BASU may provide a basis for future design of additional fast and small promiscuous biotin ligases. Faster labeling by BASU may enable studies of short timescale impacts of drug action and signaling events in tissue on RNA–protein and protein–protein interactions. Because BirA* proteins, unlike APEX-based methods, can operate in tissue and model organisms, BASU may further enable short timescale protein interaction studies in vivo.
The approach presented here has some limitations in its current form. For example, because biotin-ligase-based proximity proteomics is based on biotinylation of lysine residues of proteins, it has the limitation that not all proteins may be equally detected because of variation in lysines exposed on the surface of proximal proteins. As a modular framework, however, RaPID is not limited to use of biotin ligases; and other vicinal labeling approaches, such as APEX237, may be used. Cells have endogenously biotinylated protein, and each cell type may have a different set of background biotinylated proteins. Hence, using scrambled sequences along with motifs of interest is an important control when performing RaPID-MS and subsequent CRAPome analysis to subtract background proteins and to identify true proximal proteins. With HEK293T cells, we collated a reference list of highly biotinylated background proteins (Supplementary Table 16). Moreover, RaPID cannot distinguish between directly interacting proteins or proteins that engage indirectly with RNA, and it cannot be used to study endogenous RNAs at their physiological concentrations. The latter limitation, however, may be addressed in the future by increasingly efficient approaches to homology-directed recombinatorial knock-in technologies, which may permit incorporation of BoxB sites into endogenous RNA sequences expressed from native regulatory elements38.
ONLINE METHODS
A step-by-step protocol is available as a Supplementary Protocol and an open resource in Protocol Exchange39.
Cell culture and transfection
HEK293T and Huh-7 cells were maintained in DMEM supplemented with 10% FBS and 1% penicillin–streptomycin at 37 °C with 5% CO2. HEK293T cells were transfected with Lipofectamine 2000 (Invitrogen). For RaPID-Western, transfections were performed in 6-well plates. 300,000 cells were seeded in each well the day before transfection. 2 μg of motif RNA and 0.3 μg of RaPID construct were cotransfected with 5 μL of Lipofectamine 2000 in each well. The day following transfection, biotin (200 μM) was added to media and incubated for 18 h, following which the cells were harvested. For each RaPID-MS experiment, a single 10 cm plate of cells was used. 2 million cells were seeded in each plate the day before transfection. 12 μg of motif RNA and 2 μg of RaPID construct were cotransfected with 30 μL of Lipofectamine 2000. The day after transfection, biotin (200 μM) was added to media. Cells were incubated in biotin 200 μM for 18 h, following which the cells were harvested as described below.
Plasmids
DNA for RaPID protein was synthesized from IDT using geneBlock with optimized λN sequence (MNARTR RRERRAEKQAQWKAAN) fused to the N terminus of E. coli BirA*36. The lyophilized geneBlock was resuspended in 20 μL of H2O, and inFusion reaction (Clontech) was performed. To generate motif RNA plasmid, pairs of single-stranded DNA oligonucleotides encoding the motif RNA were annealed together to generate short double-stranded DNA fragments with 4 bp overhangs. These fragments were ligated into BsmBI-digested motif RNA plasmid. Plasmids to perform RaPID deposited in Addgene (plasmid IDs: 107250, 107251, 107252, 107253). RNA motif sequences are listed in Supplementary Table 14.
RaPID-Western
On day of harvest, cells were washed with cold PBS (1×). Compositions of buffers used are described in Supplementary Table 15. Volumes mentioned in this section are for sample from individual well of a 6-well plate. Lysis was performed with 200 μL lysis buffer at room temperature. 20 μL of 25% Triton X-100 was added and mixed thoroughly. Then, 220 μL of cold 50 mM Tris pH 7.4 was added, following which samples were sonicated for 10 s. Lysate was spun down at 4 °C for 10 min. Protein concentration in each sample was quantified using spectrophotometer with Pierce Protein Quantitation Assay (ThermoFisher). Protein concentration across samples was normalized, and 40 μL of the sample was taken and labeled as Lysate. Pull down of biotinylated proteins was performed with MyOne C1 Streptavidin Beads (Thermofisher), and sample was rotated with beads for 2 h at room temperature. Three washes were performed as described previously14. Beads were then boiled in Elution Buffer for 45 min at 98 °C and labeled as Pulldown. Both Pulldown & Lysate samples were loaded and run out on 4–12% Bis-Tris gel (Thermofisher) and electrotransferred to nitrocellulose membrane. Membrane was blocked in blocking buffer (LI-COR Biosciences 927-40000) for 1 h and subsequently incubated with primary antibodies overnight. Primary Antibodies used: anti- HA (Cell Signaling) anti-CELF1 (Santa Cruz Biotechnology, sc-20003), anti-IREB2 (Santa Cruz Biotechnology, sc-33682). Membranes were washed with PBS-T and incubated with secondary goat anti-mouse and goat anti-rabbit antibodies (LI-COR Biosciences 925-32210, 925-32211) at a dilution of 1:4,000 for 1 h at room temperature. The membrane was then washed with PBS-T and visualized using the Odyssey CLx Infrared Imaging System (LI-COR Biosciences). Quantification was performed using the Licor ImageStudioLite software (LI-COR Biosciences).
RaPID-MS
For sample preparation for LC-MS/MS, streptavidin biotin magnetic particles were washed with 500 μL 50 mM ammonium bicarbonate three times. Beads were resuspended in 200 μL 50 mM ammonium bicarbonate with the addition of DTT to a final concentration of 5 mM, incubated on a heat block at 50 °C for 5 min followed by head-over-head rocking for 30 min at room temperature. Alkylation was performed by the addition of propionamide to a final concentration of 10 mM and head-over-head shaking for 30 min at room temperature. 250 ng of trypsin/LysC (Promega) was added to each sample and digested overnight at room temperature in the head-over-head shaker followed by the addition of formic acid to 1%. Peptides were removed and washed with 50 μL 0.1% formic acid water. The acidified peptide pools were C18 STAGE tip 40 purified (NEST group) using microspin columns and dried in a speed vac40. For LC-MS/MS, peptide pools were reconstituted and injected onto a C18 reversed-phase analytical column 10 cm in length (New Objective). The UPLC was a Waters NanoAcquity, operated at 600 nL/min using a linear gradient from 4% mobile phase B to 35% B. Mobile phase A consisted of 0.1% formic acid, water; mobile phase B was 0.1% formic acid, water. The mass spectrometer was an Orbitrap Elite set to acquire data in a data-dependent fashion selecting and fragmenting the 15 most intense precursor ions in the ion trap where the exclusion window was set at 60 s, and multiple charge states of the same ion were allowed.
LC-MS/MS data analysis
MS/MS data were analyzed using both Preview and Byonic v1.4 (ProteinMetrics). All data were first analyzed in Preview to provide recalibration criteria and then reformatted to .MGF before full analysis with Byonic. Analyses used Uniprot canonical .fasta files for Human, concatenated with common contaminant proteins. Data were searched at 10 p.p.m. mass tolerances for precursors, with 0.4 Da fragment mass tolerances assuming up to two missed cleavages and allowing for N-ragged tryptic digestion. These data were validated at a 1% false discovery rate using typical reverse-decoy techniques. The resulting identified peptide spectral matches and assigned proteins were then exported for further analysis using custom tools developed in MatLab (MathWorks) to provide visualization and statistical characterization. SAINT scores were generated using the online CRAPome tool with spectral counts from experimental samples and controls (Supplementary Note 1)19.
hiPSC-derived NPCs and neurons
Episomally derived human induced pluripotent stem cells were differentiated using a combination of SMAD inhibition and retinoid signaling41,42. Neural progenitor cells (NPCs) and neurons were characterized and harvested at Day 21 and Day 35 of the differentiation protocol, respectively, for quantification of QKI expression. Antibodies: anti-PAX6 (Biolegend 901301), anti-NCad (BD Biosciences 610920), anti-Tuj1 (Abcam ab78078), anti-NeuN (Abcam ab177487), anti-QKI (Abcam ab126742).
Gene Ontology analysis
Gene Ontology (GO) analysis on biological process was performed with Database for Annotation, Visualization and Integrated Discovery (DAVID) v6.7.
Viral quantification
U87 cells (shControl or shQKI) were plated in 96-well plates (4,000 cells per well) and infected with an MOI of 0.1 of Zika Virus Puerto Rico strain (ZIKV/Homo sapiens/PRI/PRVABC59/2015). Cells were collected 24 h postinfection, and reverse transcription (RT) and quantitative PCR (qPCR) was performed as outlined in the Ambion Power SYBR Green Cells-to-Ct kit (Ambion 4402954). All samples were normalized to 18S expression. Three independent experiments were performed with triplicate infections, and one representative is shown. The primers used for the real time quantitative PCR are the following: Zika Virus Forward 5′-CCGCTGCCCAACACAAG-3′; Zika Virus Reverse: 5′-CCACTAACGTTCTTTTGCAGACAT-3′; 18S Forward 5′-AGAAACGGCTACCACATCCA-3′; 18S Reverse 5′-CACCAGACTTGCCCTCCA-3′. For coxsackie-virus control, a luciferase-expressing coxsackievirus B3 strain (CVB3-Luc) described previously43 was used to infect U87 cells in a 96-well format (4,000 cells per well) with a MOI 0.1. The primers used for the real time quantitative PCR are the following: CVB3 Virus Forward 5′-CGCTAGATTACTGCCCTGGG -3′; CVB3 Virus Reverse: 5′-CTGGTGCCCTGCTAAACGTA -3′; 18S Forward 5′-AGAAACGGCTACCACATCCA-3′; 18S Reverse 5′-CACCAGACTTGCCCTCCA-3′. Three independent experiments were performed with triplicate infections, and one representative is shown.
RNA motif qPCR quantification
HEK293T cells were transfected in 12-well plate (100,000 cells per well) with 0.5 μg of RNA motif construct. All RNA motif constructs had eGFP at the ORF and the motif at 3′ UTR (Supplementary Fig. 1a). Cells were collected 48 h post-transfection and RNA prepared using RNeasy Plus mini kit (Qiagen) according to the manufacturer’s instructions. 1 μg of total RNA was reverse transcribed with the iScript cDNA synthesis kit (Bio-Rad). qRT–PCR was performed using the Maxima SYBR Green qPCR master mix (2×, Fermentas). Samples were run in triplicate, and samples were normalized to 18S expression. The primers used for the real time quantitative PCR are the following: GFP Forward 5′-GAAGCAGCACGACTTCTTCAA-3′; GFP Reverse: 5′-AAGTCGATGCCCTTCAGCTC-3′; 18S Forward 5′-GCAATTATTCCCCATGAACG-3′; 18S Reverse 5′-GGCCTCACTAAACCATCCAA-3′.
Generation and comparison of mutant biotin ligases
BASU was generated by deleting N terminus (1–65 amino acids) and introducing the following amino acid substitutions (R142G, E323S, G325R) in the reference B. subtilis biotin ligase sequence (UniProt ID: P0CI75). Mutants in biotin ligases from the following species were also engineered with the following mutations designed to enhance their promiscuous activity: A. aeolicus (R40G, UniProt ID: O66837), Rhodanobacter spp. (R120G, UnirProt ID: I4WBG1), Tanerella spp. (Q45G, UniProt ID: G9S3T4), T. brucei (T49G, UniProt ID: Q383S3).
Streptavidin blot for comparison of mutant biotin ligases HEK293T
Cells were plated in 6-well plate (300,000 cells per well). Following plating, cells were transfected the next day with 0.2 μg of mutant biotin ligases. Cells were grown in DMEM supplemented with 10% dialyzed FBS (ThermoFisher) and 1% penicillin–streptomycin at 37 °C with 5% CO2. On Day 2 posttransfection, biotin labeling was performed with 200 μM biotin DMEM media for the 1 h. Following lysis, cells were blotted for Lysate, and samples were loaded and run out on 4–12% Bis-Tris gel (Thermofisher) and electrotransferred to nitrocellulose membrane. Membrane was blocked in blocking buffer (LI-COR Biosciences) for 1 h and subsequently incubated with IR-800 Streptavidin antibody (LI-COR Biosciences) at a dilution of 1:4,000 for 1 h at room temperature. The membrane was then washed with PBS-T and visualized using the Odyssey CLx Infrared Imaging System (LI-COR Biosciences).
CLIP-qPCR
293T cells were transfected with pLEX-HA-RC3H1 or pLEX-HA-mCherry along with TNF-CDE/SM1v1/scr motif plasmid. Transfected 293Ts were cross-linked with 254 nm UV-C 0.3J/cm2 and harvested in 1 ml ice-cold PBS. 10% of cells were taken for isolation of RNA input fractions and the remainder lysed in CLIP lysis buffer (50 mM Tris, pH 7.5, 200 mM NaCl, 0.5% Sarkosyl, 0.2% Triton-X 100, 0.1% Igepal, 10% glycerol, 1 mM EDTA). Lysates were briefly sonicated to eliminate viscosity, clarified by centrifugation at 14,000 r.p.m. for 10 min and quantified using the Pierce BCA assay. 200 μg of each lysate was then added to 40 μl of anti-HA agarose (Thermo Fisher 26181) and immunoprecipitated for 2 h at 4 °C with rotation. Immunoprecipitates were washed as described44. After the final wash, 200 μl of Proteinase K buffer, without proteinase K, was added to each immunoprecipitation and incubated at 55 °C for 5 min in a thermomixer, 15 s 1,350 r.p.m., 45s rest. Beads were the packed by brief centrifugation and ~180 μl transferred to a new 1.5 ml Eppendorf containing 5 μl of 20 mg/ml Proteinase K (ThermoFisher) and incubated in the thermomixer for an additional 45 min. Immunoprecipitated RNA was then precipitated by addition of 10 μg of linear polyacrylamide, 20 μl of 2 M NaCl, 600 μl of ethanol and overnight incubation at −20C. RNA was then pelleted by centrifugation at 13,000 r.p.m. for 1 h, washed with 1 ml of 80% ethanol and dried. The RNA pellet was resuspended in 10 μl of water containing 5 pmol of EGFP reverse primer and incubated at 70 °C for 10 min. cDNA was generated with the iScript (Bio-Rad) and analyzed by QPCR with SybrMax (ThermoFisher).
BASU RaPID labeling
Time Series HEK293T cells were plated in 6-well plates (300,000 cells per well). Following plating, cells were transfected the next day with equal amount of plasmids coding for RaPID protein (0.2 μg per well) and RNA motif (2 μg per well). Cells were grown in DMEM supplemented with 10% dialyzed FBS (ThermoFisher) and 1% penicillin–streptomycin at 37C with 5% CO2. On Day 2 post-transfection, biotin labeling was performed with 200 μM biotin DMEM media for the indicated time. Cells were then subject to RaPID-Western protocol.
BASU RaPID-MS
The same protocol was used to perform BASU RaPID-MS as with original E. coli BirA. Labeling was performed for 30 min with 200 μM biotin and instead of transfecting E. coli BirA, BASU was transfected, and the resulting mass spectrometry results were analyzed as before with CRAPome tool.
3D organotypic human skin tissue
Primary human epidermal keratinocytes were isolated from fresh surgical specimens (IRB-12568 “Gene Expression Analysis of Human Skin Disease”). Lentiviral infection of BASU or E. coli BirA was performed on keratinocytes. BASU or E. coli BirA stably expressing keratinocytes were then seeded on devitalized human dermis along with fibroblasts and grown as described previously45. Once 3D organotypic human skin tissue had stratified, 200 μM biotin containing keratinocyte media was added for 30 min to obtain the 30 min timepoint. For 0 min timepoint, no change in media was performed. 3D organotypic human skin tissue was embedded with OTC (Sakura, Torrance, California), and frozen sections were obtained using standard techniques. Antibodies: Streptavidin, Alexa Fluor 488 conjugate (Thermofisher S11223 at 1:100 dilution 1:100 dilution). Immunofluorescence images were taken using Zeiss Axiovert inverted microscope.
Determination of highly biotinylated background proteins
10 cm plate of HEK293T cells (2 million cells) were seeded and then transfected with 2ug of E. coli BirA* protein plasmid. No motif plasmid was transfected. Samples were labeled in 200 μM biotin + DMEM media for ~18 h, and samples were processed as in RaPID-MS. Matrix of proteins with spectral count data was obtained by mass spectrometry analysis. Proteins identified in duplicate samples with spectral counts greater than 70 (median + s.d.) were labeled as highly biotinylated background proteins.
Code availability
CRAPome analysis was performed online at crapome.org. Steps to perform crapome analysis listed in Supplementary Note 1. Custom R code to perform analysis of Tissue Protein Atlas data is provided in Supplementary Note 2.
Life Sciences Reporting Summary
Further information on experimental design is available in the Life Sciences Reporting Summary.
Data availability
All RaPID-Western CRAPome analysis files (Excel) have been provided in the supplementary tables. Sequences of RNA motifs used in the experiments along with buffer compositions for performing RaPID experiments are provided in Supplementary Tables 17 and 18, respectively. Source data for Figures 1–4, and Supplementary Figures 1–5 and 11 are available online.
Supplementary Material
Acknowledgments
We thank C. Adams, R. Leib and Vincent Coates Foundation Mass Spectrometry Laboratory, Stanford University Mass Spectrometry for help with mass spectrometry. We also thank P. Oikonomou and S. Tavazoie for providing position weight matrixes. We thank A. Fire, H. Chang, J. Elias, P. Sarnow, R. Flynn, J. Quinn, A. Bhaduri, A. Rubin and M. Kay for presubmission review. We thank L. Morcom and P. Bernstein for expert administrative assistance and members of the Khavari lab for helpful discussions. This work was supported by the US VA Office of Research and Development, by NIH AR49737, and NIH AR43799 (P.A.K.). The project described was supported by Award Number S10RR027425 from the National Center For Research Resources. The content is solely the responsibility of the authors and does not necessarily represent the official views of the National Center for Research Resources or the National Institutes of Health.
Footnotes
Note: Any Supplementary Information and Source Data files are available in the online version of the paper.
AUTHOR CONTRIBUTIONS
M.R. designed and executed experiments, analyzed the data and wrote the manuscript. K.M. designed and performed viral replication assays. J.G.R., H.G., D.S.R., J.R.K., P.H.N., B.J.Z., Z.S. and S.M. performed experiments. J.E.C. and T.D.P. supervised work. P.A.K. designed experiments, analyzed data, and wrote the manuscript.
COMPETING FINANCIAL INTERESTS
The authors declare no competing financial interests.
Publisher’s note: Springer Nature remains neutral with regard to jurisdictional claims in published maps and institutional affiliations.
References
- 1.Moore MJ. From birth to death: the complex lives of eukaryotic mRNAs. Science. 2005;309:1514–1518. doi: 10.1126/science.1111443. [DOI] [PubMed] [Google Scholar]
- 2.Keene JD. RNA regulons: coordination of post-transcriptional events. Nat Rev Genet. 2007;8:533–543. doi: 10.1038/nrg2111. [DOI] [PubMed] [Google Scholar]
- 3.Castello A, et al. Insights into RNA biology from an atlas of mammalian mRNA-binding proteins. Cell. 2012;149:1393–1406. doi: 10.1016/j.cell.2012.04.031. [DOI] [PubMed] [Google Scholar]
- 4.Lee JT. Epigenetic regulation by long noncoding RNAs. Science. 2012;338:1435–1439. doi: 10.1126/science.1231776. [DOI] [PubMed] [Google Scholar]
- 5.Wang P, et al. The STAT3-binding long noncoding RNA lnc-DC controls human dendritic cell differentiation. Science. 2014;344:310–313. doi: 10.1126/science.1251456. [DOI] [PubMed] [Google Scholar]
- 6.Keefe AD, Pai S, Ellington A. Aptamers as therapeutics. Nat Rev Drug Discov. 2010;9:537–550. doi: 10.1038/nrd3141. [DOI] [PMC free article] [PubMed] [Google Scholar]
- 7.Galloway KE, Franco E, Smolke CD. Dynamically reshaping signaling networks to program cell fate via genetic controllers. Science. 2013;341:1235005. doi: 10.1126/science.1235005. [DOI] [PMC free article] [PubMed] [Google Scholar]
- 8.Butter F, Scheibe M, Mörl M, Mann M. Unbiased RNA-protein interaction screen by quantitative proteomics. Proc Natl Acad Sci USA. 2009;106:10626–10631. doi: 10.1073/pnas.0812099106. [DOI] [PMC free article] [PubMed] [Google Scholar]
- 9.Mili S, Steitz JA. Evidence for reassociation of RNA-binding proteins after cell lysis: implications for the interpretation of immunoprecipitation analyses. RNA. 2004;10:1692–1694. doi: 10.1261/rna.7151404. [DOI] [PMC free article] [PubMed] [Google Scholar]
- 10.Matia-González AM, Iadevaia V, Gerber AP. A versatile tandem RNA isolation procedure to capture in vivo formed mRNA-protein complexes. Methods. 2017;118–119:93–100. doi: 10.1016/j.ymeth.2016.10.005. [DOI] [PubMed] [Google Scholar]
- 11.Rogell B, et al. Specific RNP capture with antisense LNA/DNA mixmers. RNA. 2017;23:1290–1302. doi: 10.1261/rna.060798.117. [DOI] [PMC free article] [PubMed] [Google Scholar]
- 12.McHugh CA, et al. The Xist lncRNA interacts directly with SHARP to silence transcription through HDAC3. Nature. 2015;521:232–236. doi: 10.1038/nature14443. [DOI] [PMC free article] [PubMed] [Google Scholar]
- 13.Buenrostro JD, et al. Quantitative analysis of RNA-protein interactions on a massively parallel array reveals biophysical and evolutionary landscapes. Nat Biotechnol. 2014;32:562–568. doi: 10.1038/nbt.2880. [DOI] [PMC free article] [PubMed] [Google Scholar]
- 14.Kim DI, et al. Probing nuclear pore complex architecture with proximity-dependent biotinylation. Proc Natl Acad Sci USA. 2014;111:E2453–E2461. doi: 10.1073/pnas.1406459111. [DOI] [PMC free article] [PubMed] [Google Scholar]
- 15.Roux KJ, Kim DI, Raida M, Burke B. A promiscuous biotin ligase fusion protein identifies proximal and interacting proteins in mammalian cells. J Cell Biol. 2012;196:801–810. doi: 10.1083/jcb.201112098. [DOI] [PMC free article] [PubMed] [Google Scholar]
- 16.Austin RJ, Xia T, Ren J, Takahashi TT, Roberts RW. Designed arginine-rich RNA-binding peptides with picomolar affinity. J Am Chem Soc. 2002;124:10966–10967. doi: 10.1021/ja026610b. [DOI] [PubMed] [Google Scholar]
- 17.Edwards JM, Long J, de Moor CH, Emsley J, Searle MS. Structural insights into the targeting of mRNA GU-rich elements by the three RRMs of CELF1. Nucleic Acids Res. 2013;41:7153–7166. doi: 10.1093/nar/gkt470. [DOI] [PMC free article] [PubMed] [Google Scholar]
- 18.Zheng X, et al. Detecting RNA–protein interaction using end-labeled biotinylated RNA oligonucleotides and immunoblotting. 2016;1421:35–44. doi: 10.1007/978-1-4939-3591-8_4. [DOI] [PubMed] [Google Scholar]
- 19.Mellacheruvu D, et al. The CRAPome: a contaminant repository for affinity purification-mass spectrometry data. Nat Methods. 2013;10:730–736. doi: 10.1038/nmeth.2557. [DOI] [PMC free article] [PubMed] [Google Scholar]
- 20.Allerson CR, Cazzola M, Rouault TA. Clinical severity and thermodynamic effects of iron-responsive element mutations in hereditary hyperferritinemia-cataract syndrome. J Biol Chem. 1999;274:26439–26447. doi: 10.1074/jbc.274.37.26439. [DOI] [PubMed] [Google Scholar]
- 21.Wang J, et al. Iron-dependent degradation of apo-IRP1 by the ubiquitin-proteasome pathway. Mol Cell Biol. 2007;27:2423–2430. doi: 10.1128/MCB.01111-06. [DOI] [PMC free article] [PubMed] [Google Scholar]
- 22.Mlakar J, et al. Zika virus associated with microcephaly. N Engl J Med. 2016;374:951–958. doi: 10.1056/NEJMoa1600651. [DOI] [PubMed] [Google Scholar]
- 23.Li Z, Nagy PD. Diverse roles of host RNA binding proteins in RNA virus replication. RNA Biol. 2011;8:305–315. doi: 10.4161/rna.8.2.15391. [DOI] [PMC free article] [PubMed] [Google Scholar]
- 24.Tang H, et al. Zika virus infects human cortical neural progenitors and attenuates their growth. Cell Stem Cell. 2016;18:587–590. doi: 10.1016/j.stem.2016.02.016. [DOI] [PMC free article] [PubMed] [Google Scholar]
- 25.Uhlén M, et al. Tissue-based map of the human proteome. Science. 2015;347:1260419. doi: 10.1126/science.1260419. [DOI] [PubMed] [Google Scholar]
- 26.Hardy RJ. QKI expression is regulated during neuron-glial cell fate decisions. J Neurosci Res. 1998;54:46–57. doi: 10.1002/(SICI)1097-4547(19981001)54:1<46::AID-JNR6>3.0.CO;2-H. [DOI] [PubMed] [Google Scholar]
- 27.Höistad M, et al. Linking white and grey matter in schizophrenia: oligodendrocyte and neuron pathology in the prefrontal cortex. Front Neuroanat. 2009;3:9. doi: 10.3389/neuro.05.009.2009. [DOI] [PMC free article] [PubMed] [Google Scholar]
- 28.Parker BJ, et al. New families of human regulatory RNA structures identified by comparative analysis of vertebrate genomes. Genome Res. 2011;21:1929–1943. doi: 10.1101/gr.112516.110. [DOI] [PMC free article] [PubMed] [Google Scholar]
- 29.Oikonomou P, Goodarzi H, Tavazoie S. Systematic identification of regulatory elements in conserved 3′ UTRs of human transcripts. Cell Rep. 2014;7:281–292. doi: 10.1016/j.celrep.2014.03.001. [DOI] [PMC free article] [PubMed] [Google Scholar]
- 30.Cerami E, et al. The cBio cancer genomics portal: an open platform for exploring multidimensional cancer genomics data. Cancer Discov. 2012;2:401–404. doi: 10.1158/2159-8290.CD-12-0095. [DOI] [PMC free article] [PubMed] [Google Scholar]
- 31.Gao J, et al. Integrative analysis of complex cancer genomics and clinical profiles using the cBioPortal. Sci Signal. 2013;6:pl1. doi: 10.1126/scisignal.2004088. [DOI] [PMC free article] [PubMed] [Google Scholar]
- 32.Pratama A, et al. Roquin-2 shares functions with its paralog Roquin-1 in the repression of mRNAs controlling T follicular helper cells and systemic inflammation. Immunity. 2013;38:669–680. doi: 10.1016/j.immuni.2013.01.011. [DOI] [PubMed] [Google Scholar]
- 33.Janowski R, et al. Roquin recognizes a non-canonical hexaloop structure in the 3′-UTR of Ox40. Nat Commun. 2016;7:11032. doi: 10.1038/ncomms11032. [DOI] [PMC free article] [PubMed] [Google Scholar]
- 34.Kim DI, et al. An improved smaller biotin ligase for BioID proximity labeling. Mol Biol Cell. 2016;27:1188–1196. doi: 10.1091/mbc.E15-12-0844. [DOI] [PMC free article] [PubMed] [Google Scholar]
- 35.Henke SK, Cronan JE. Successful conversion of the Bacillus subtilis BirA Group II biotin protein ligase into a Group I ligase. PLoS One. 2014;9:e96757. doi: 10.1371/journal.pone.0096757. [DOI] [PMC free article] [PubMed] [Google Scholar]
- 36.Schlundt A, et al. Structural basis for RNA recognition in roquin-mediated post-transcriptional gene regulation. Nat Struct Mol Biol. 2014;21:671–678. doi: 10.1038/nsmb.2855. [DOI] [PubMed] [Google Scholar]
- 37.Lam SS, et al. Directed evolution of APEX2 for electron microscopy and proximity labeling. Nat Methods. 2015;12:51–54. doi: 10.1038/nmeth.3179. [DOI] [PMC free article] [PubMed] [Google Scholar]
- 38.Zhang JP, et al. Efficient precise knockin with a double cut HDR donor after CRISPR/Cas9-mediated double-stranded DNA cleavage. Genome Biol. 2017;18:35. doi: 10.1186/s13059-017-1164-8. [DOI] [PMC free article] [PubMed] [Google Scholar]
- 39.Ramanathan M, Khavari PA. RNA-protein interaction detection. Protocol Exchange. 2018 http://dx.doi.org/10.1038/protex.2018.003.
- 40.Rappsilber J, Ishihama Y, Mann M. Stop and go extraction tips for matrix-assisted laser desorption/ionization, nanoelectrospray, and LC/MS sample pretreatment in proteomics. Anal Chem. 2003;75:663–670. doi: 10.1021/ac026117i. [DOI] [PubMed] [Google Scholar]
- 41.Okita K, et al. A more efficient method to generate integration-free human iPS cells. Nat Methods. 2011;8:409–412. doi: 10.1038/nmeth.1591. [DOI] [PubMed] [Google Scholar]
- 42.Shi Y, Kirwan P, Smith J, Robinson HPC, Livesey FJ. Human cerebral cortex development from pluripotent stem cells to functional excitatory synapses. Nat Neurosci. 2012;15:477–486. doi: 10.1038/nn.3041. [DOI] [PMC free article] [PubMed] [Google Scholar]
- 43.Sharma A, et al. Human induced pluripotent stem cell-derived cardiomyocytes as an in vitro model for coxsackievirus B3-induced myocarditis and antiviral drug screening platform. Circ Res. 2014;115:556–566. doi: 10.1161/CIRCRESAHA.115.303810. [DOI] [PMC free article] [PubMed] [Google Scholar]
- 44.Zarnegar BJ, et al. irCLIP platform for efficient characterization of protein-RNA interactions. Nat Methods. 2016;13:489–492. doi: 10.1038/nmeth.3840. [DOI] [PMC free article] [PubMed] [Google Scholar]
- 45.Ridky TW, Chow JM, Wong DJ, Khavari PA. Invasive three-dimensional organotypic neoplasia from multiple normal human epithelia. Nat Med. 2010;16:1450–1455. doi: 10.1038/nm.2265. [DOI] [PMC free article] [PubMed] [Google Scholar]
Associated Data
This section collects any data citations, data availability statements, or supplementary materials included in this article.
Supplementary Materials
Data Availability Statement
All RaPID-Western CRAPome analysis files (Excel) have been provided in the supplementary tables. Sequences of RNA motifs used in the experiments along with buffer compositions for performing RaPID experiments are provided in Supplementary Tables 17 and 18, respectively. Source data for Figures 1–4, and Supplementary Figures 1–5 and 11 are available online.