

Supplemental Digital Content is available in the text.
Keywords: biomarkers, cluster analysis, heart failure, HIV infection, mortality
Abstract
Background:
Although individual cardiac biomarkers are associated with heart failure risk and all-cause mortality in HIV-infected individuals, their combined use for prediction has not been well studied.
Methods and Results:
Unsupervised k-means cluster analysis was performed blinded to the study outcomes in 332 HIV-infected participants on 8 biomarkers: ST2, NT-proBNP (N-terminal pro-B-type natriuretic peptide), hsCRP (high-sensitivity C-reactive protein), GDF-15 (growth differentiation factor 15), cystatin C, IL-6 (interleukin-6), D-dimer, and troponin. We evaluated cross-sectional associations of each cluster with diastolic dysfunction, pulmonary hypertension (defined as echocardiographic pulmonary artery systolic pressure ≥35 mm Hg), and longitudinal associations with all-cause mortality. The biomarker-derived clusters partitioned subjects into 3 groups. Cluster 3 (n=103) had higher levels of CRP, IL-6, and D-dimer (inflammatory phenotype). Cluster 2 (n=86) displayed elevated levels of ST2, NT-proBNP, and GDF-15 (cardiac phenotype). Cluster 1 (n=143) had lower levels of both phenotype-associated biomarkers. After multivariable adjustment for traditional and HIV-related risk factors, cluster 3 was associated with a 51% increased risk of diastolic dysfunction (95% confidence interval, 1.12–2.02), and cluster 2 was associated with a 67% increased risk of pulmonary hypertension (95% confidence interval, 1.04–2.68), relative to cluster 1. Over a median 6.9-year follow-up, 48 deaths occurred. Cluster 3 was independently associated with a 3.3-fold higher risk of mortality relative to cluster 1 (95% confidence interval, 1.3–8.1), and cluster 2 had a 3.1-fold increased risk (95% confidence interval, 1.1–8.4), even after controlling for diastolic dysfunction, pulmonary hypertension, left ventricular mass, and ejection fraction.
Conclusions:
Serum biomarkers can be used to classify HIV-infected individuals into separate clusters for differentiating cardiopulmonary structural and functional abnormalities and can predict mortality independent of these structural and functional measures.
WHAT IS NEW?
The analyses in this article build on our earlier finding that elevated levels of ST2 and GDF-15 in HIV-infected people are associated with cardiac dysfunction and mortality. Despite effective antiretroviral therapy, HIV-infected people have an increased risk of heart failure. However, heart failure is a heterogeneous condition, and the pathophysiology in HIV infection appears to be multifactorial.
Our current study finds that patients can be partitioned into separate phenotypes of inflammatory and cardiac risk, based solely on the measurements of 6 serum biomarkers.
WHAT ARE THE CLINICAL IMPLICATIONS?
Patients with a cardiac phenotype appear to have an increased risk of both pulmonary hypertension and mortality. Patients with an inflammatory phenotype have an increased risk of both diastolic dysfunction and mortality. Both phenotypes are associated with a 3-fold higher risk of all-cause mortality.
These associations are independent of traditional cardiovascular disease risk factors, HIV-related factors, and echocardiographic findings.
Serum biomarker–derived phenotypes can help inform the diagnosis and staging of heart failure and can improve prediction of mortality in HIV-infected patients.
Highly active antiretroviral therapy has dramatically reduced morbidity and mortality in people with HIV infection, and yet HIV disease remains associated with early onset of cardiovascular disease (CVD). CVD is a leading cause of death among HIV-infected people, and similar to the uninfected population, heart failure (HF) is a growing source of morbidity. The reported prevalence of diastolic dysfunction (DD) ranges from 26% to 50% in contemporary HIV-infected cohorts.1 Although symptomatic pulmonary hypertension (PH) is rare in HIV infection, our group and others2,3 have reported elevated pulmonary artery systolic pressures in HIV-infected people. DD is a risk factor for progression to HF and is also a significant cause of PH.4 Both DD and PH are strongly associated with all-cause mortality among individuals without HIV.5,6
We recently reported2 that biomarkers of inflammation, thrombosis, apoptosis, and myocardial injury are elevated in HIV-infected people relative to uninfected controls. In addition, we found that several of these markers were individually associated with both cardiac dysfunction and all-cause mortality, independent of traditional CVD risk factors and HIV-related factors. However, HF is a heterogeneous condition, especially in the setting of HIV infection,7 where the epidemiology has changed over time with the use of effective combination antiretroviral therapy, and the pathophysiology seems to be multifactorial.
The heterogeneity of the HF syndrome suggests that multiple cardiac biomarkers reflecting different pathophysiologic pathways and consequences may be needed to represent the spectrum of the disease.8 How such biomarkers inter-relate9 and how to integrate them in risk prediction and patient management remains unclear. In other settings such as cancer and rhinosinusitis, cluster analysis has been used to identify disease subtypes and to predict treatment outcomes.10,11 Classifying patients beyond traditional risk factors using a biomarker-generated phenotype could improve diagnosis and determination of prognosis and could inform therapeutic strategies.12
In this study, we used an unsupervised cluster approach (ie, blinded to the outcome variable) to categorize participants into separate subgroups based on the results of multiple serum biomarkers to obtain maximum prognostic ability. We hypothesized that in combination, a complementary, parsimonious set of biomarkers would identify separate clusters of risk for DD and PH, while improving mortality risk prediction beyond that ascertained by traditional CVD risk factors and HIV-related risk factors.
Methods
Study Population
Individuals with HIV infection were consecutively enrolled between September 2004 and March 2011 from the SCOPE (Study of the Consequences of the Protease Inhibitor Era), a large clinic-based cohort at San Francisco General Hospital. All participants of SCOPE were documented to be HIV infected by medical records, letter of diagnosis, or HIV-antibody testing. The only inclusion criterion for this analysis was HIV infection, and there were no exclusion criteria. Individuals were not preselected on the basis of cardiovascular risk factors, symptoms, or antiretroviral drug regimens. The present analysis includes (1) 71 untreated patients, defined as no antiretroviral therapy (ART) in the preceding 6 months; (2) 83 treated patients with detectable viremia, as defined as >24 weeks of ART with the most recent or previous HIV-RNA level >75 copies/mL; and (3) 178 treated patients who achieved full viral suppression, as defined as >24 weeks of ART with 2 most recent HIV-RNA levels <75 copies/mL. The study was approved by the University of California, San Francisco, Committee on Human Research, and all study participants provided written informed consent before study enrollment. The data, analytic methods, and study materials will not be made available to other researchers for purposes of reproducing the results or replicating the procedure.
Serum Biomarkers
Biomarkers measured in this study at baseline included ST2 (fibrosis); GDF-15 (apoptosis); NT-proBNP (N-terminal pro-B-type natriuretic peptide; myocyte stretch); cTnI (cardiac troponin I; myocardial injury); hsCRP and IL-6 (interleukin-6; inflammation); cystatin C (renal dysfunction); and D-dimer (thrombosis).13–18 GDF-15, cystatin C, and IL-6 were measured using a Quantikine Human Immunoassay (R&D Systems, Minneapolis, MN). ST2 was measured using the Presage Assay (Critical Diagnostics, San Diego, CA). C-Reactive Protein (CRP) was measured using the CardioPhase High Sensitivity C-Reactive Protein Immunoassay (Siemens Medical Solutions Diagnostics, Tarrytown, NY). Troponin was measured using the Advia Centaur TnI-Ultra Assay (Siemens Medical Solutions Diagnostics). NT-proBNP was measured by the Roche E Modular assay (Roche Diagnostics Corporation, Indianapolis, IN). D-dimer was measured using the Zymutest D-Dimer ELISA (Aniara, West Chester, OH). Details on sensitivity, range, and coefficients of variation have been published previously.2
Echocardiography
As described previously,19 a 2-dimensional transthoracic echocardiogram was performed on each participant within 6 months of enrollment by a sonographer blinded to participant’s HIV status. The presence of DD was determined using the guidelines from the American Society of Echocardiography.20 Left ventricular (LV) end-diastolic and end-systolic volumes and LV ejection fraction were assessed using the modified Simpson rule and indexed to body surface area. Pulmonary artery systolic pressure was quantified by using the modified Bernoulli equation to obtain the calculated pressure gradient (based on peak tricuspid regurgitation jet velocity) and then added to the mean right atrial pressure, which was estimated from the diameter of the inferior vena cava, and degree of inspiratory collapse.21 All calculations and interpretations were performed off-line by 2 cardiologists who were blinded to participants’ HIV infection and clinical status.
Outcomes
All patients were followed longitudinally after enrollment as part of the SCOPE study. The main echocardiographic outcomes (measured at baseline only) were DD (defined as ≥grade 1), PH (classified as pulmonary artery systolic pressure >35 mm Hg),21 and LV hypertrophy (defined as LV mass ≥110 or ≥125 g/m2 in females and males, respectively). DD was classified as grade 1 (n=128), grade 2 (n=5), grade 3 (n=3), grade 5 (n=2), or none (n=166) and was missing in 28 participants. Systolic dysfunction, defined as a LV ejection fraction of <50%, was not considered a primary outcome because of the low prevalence in the HIV population22 and in our cohort (14 out of 332 participants). Pulmonary artery systolic pressure measures were available in all but 2 participants. We did not assess for presence of atrial fibrillation, but previous studies suggest that atrial fibrillation remains uncommon (<3% incidence) in the setting of HIV infection.23 For all-cause mortality, participants were followed through January 2015 or until the time of death as determined by the National Death Index.
Construction of Clusters
The goal of our clustering procedure was to simplify the data from 8 distinct serum biomarkers to partition subjects into a small number of groups based on the totality of biomarker information. This grouping was based solely on the aggregate biomarker data and did not use clinical characteristics or subsequent outcomes. We first examined unadjusted Spearman correlations between markers. We used k-means clustering (chosen for its relative efficiency) to perform unsupervised clustering of biomarkers.24 K-means is considered a flat clustering algorithm because it generates clusters without any prespecified ordering or structure, unlike hierarchical clustering methods. Groups of participants having similar biomarker patterns can be identified as clusters.
Because the biomarkers were right-skewed, we log-transformed each marker to normalize its distribution. We also standardized each biomarker to the same scale (mean=0; SD=1) so that biomarkers with larger variances would not have a greater influence on cluster assignment. We used k-means clustering to partition subjects into separate clusters, using the SAS FASTCLUS procedure to identify outliers and reduce their effect on cluster centers. We identified a parsimonious set of biomarkers using the 6 most distinguishing biomarkers to construct clusters. Markers used in cluster construction were those with the highest ratio of between- to within-group variance in biomarker levels. We used canonical correlation analysis to construct integrated biomarker scores, which represent weighted sums of the 6 biomarkers (standardized to the same scale). Biomarkers with larger coefficients contribute more weight to the score.
In addition to using the k-means algorithm to generate clusters, we compared other clustering algorithms including hierarchical (using Ward method), Single, Complete, Average, McQuitty, Median, and Centroid (Figure I in the Data Supplement).25 We also performed internal validation to assess the quality and stability of clusters generated using k-means and other algorithms (using the clValid package in R; Figures II and III in the Data Supplement). Additional details and results are summarized in the Data Supplement.
Statistical Analysis
We compared baseline clinical and demographic characteristics across clusters using χ2 and Kruskal–Wallis tests for categorical and continuous variables, respectively. Multinomial logistic regression was used to identify factors associated with cluster membership, using cluster 1 as the reference group. Relative risk regression (using a modified Poisson approach) was used to examine associations of clusters with DD, PH, and LV hypertrophy, and Cox proportional hazards regression was used to examine associations with all-cause mortality. We assessed the proportional hazards assumption for mortality by testing weighted Schoenfeld residuals. Covariates from the baseline examination included demographics (age, sex, and race/ethnicity), CVD risk factors (smoking, hypertension, diabetes mellitus, body mass index, high-density lipoprotein, low-density lipoprotein, and triglycerides), and HIV-related risk factors (CD4 count, HIV-RNA, hepatitis C, history of opportunistic infection, and highly active antiretroviral therapy [HAART] use). Additionally, we included baseline echocardiographic measures as covariates in models of mortality. We calculated risk ratios for each outcome using cluster 1 as the reference category.
We assessed model performance using discrimination, calibration, Nagelkerke R2 (for overall performance), and the category-less IDI (integrated discrimination improvement, for reclassification).26 For survival models, Harrell c was used to assess discrimination.27 Results are summarized in the Data Supplement (Figure IV in the Data Supplement).
Statistical analyses for comparisons of clinical data and associations with outcomes were conducted using SAS version 9.4 (SAS Institute, Inc, Cary, NC).
Results
Construction of Biomarker Clusters
In unadjusted analysis, the serum biomarkers were only modestly intercorrelated (all correlation coefficients <0.4). A heat map and dendrogram showing biomarker relationships found separate cardiac and inflammatory domains (Figure 1). The strongest correlation was between CRP and IL-6 (r=0.35), and the weakest correlations were between troponin and the other biomarkers (all r≤0.11). Clusters were derived by an unsupervised cluster approach using the 6 most distinguishing biomarkers (ST2, NT-proBNP, GDF-15, CRP, IL-6, and D-dimer), blinded to study outcomes. The 2 excluded markers (troponin and cystatin C) contributed little to cluster membership (Figure V in the Data Supplement. Cluster membership was similar when all 8 markers versus the 6 most distinguishing were used.
Figure 1.
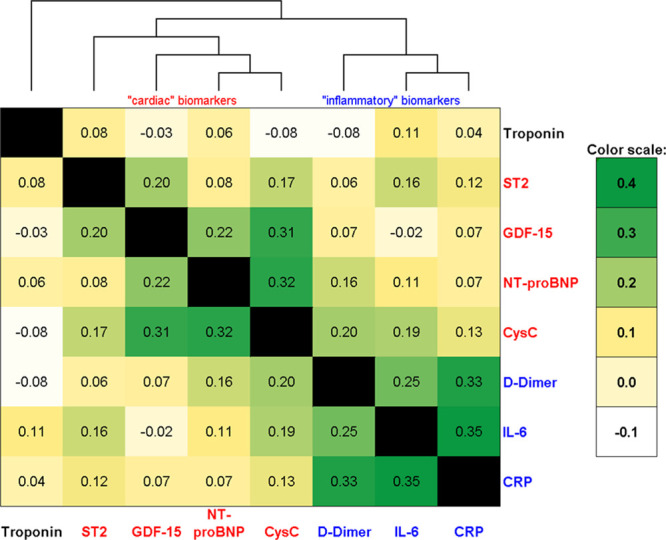
Correlations of biomarkers among HIV-infected participants. Spearman correlation coefficients are shown for intracorrelations of biomarkers. Heat map with overlaid dendrogram depicts separation of cardiac and inflammatory biomarkers. CysC indicates Cystatin C; GDF-15, growth differentiation factor-15; IL-6, interleukin-6; and NT-proBNP, N-terminal pro-B-type natriuretic peptide.
Increased cardiac markers (ST2, NT-proBNP, and GDF-15) were most able to distinguish cluster 2 from cluster 1, while increased inflammatory markers (CRP, IL-6, and D-dimer) best distinguished cluster 3 from cluster 1 (Figure V in the Data Supplement; Table 1). In addition, both clusters 2 and 3 had worse estimated glomerular filtration rate (eGFR) by cystatin C compared with cluster 1, while cluster 2 also had worse eGFR by creatinine compared with clusters 1 and 3. Rates of detectable troponin were similar across the clusters (27% overall).
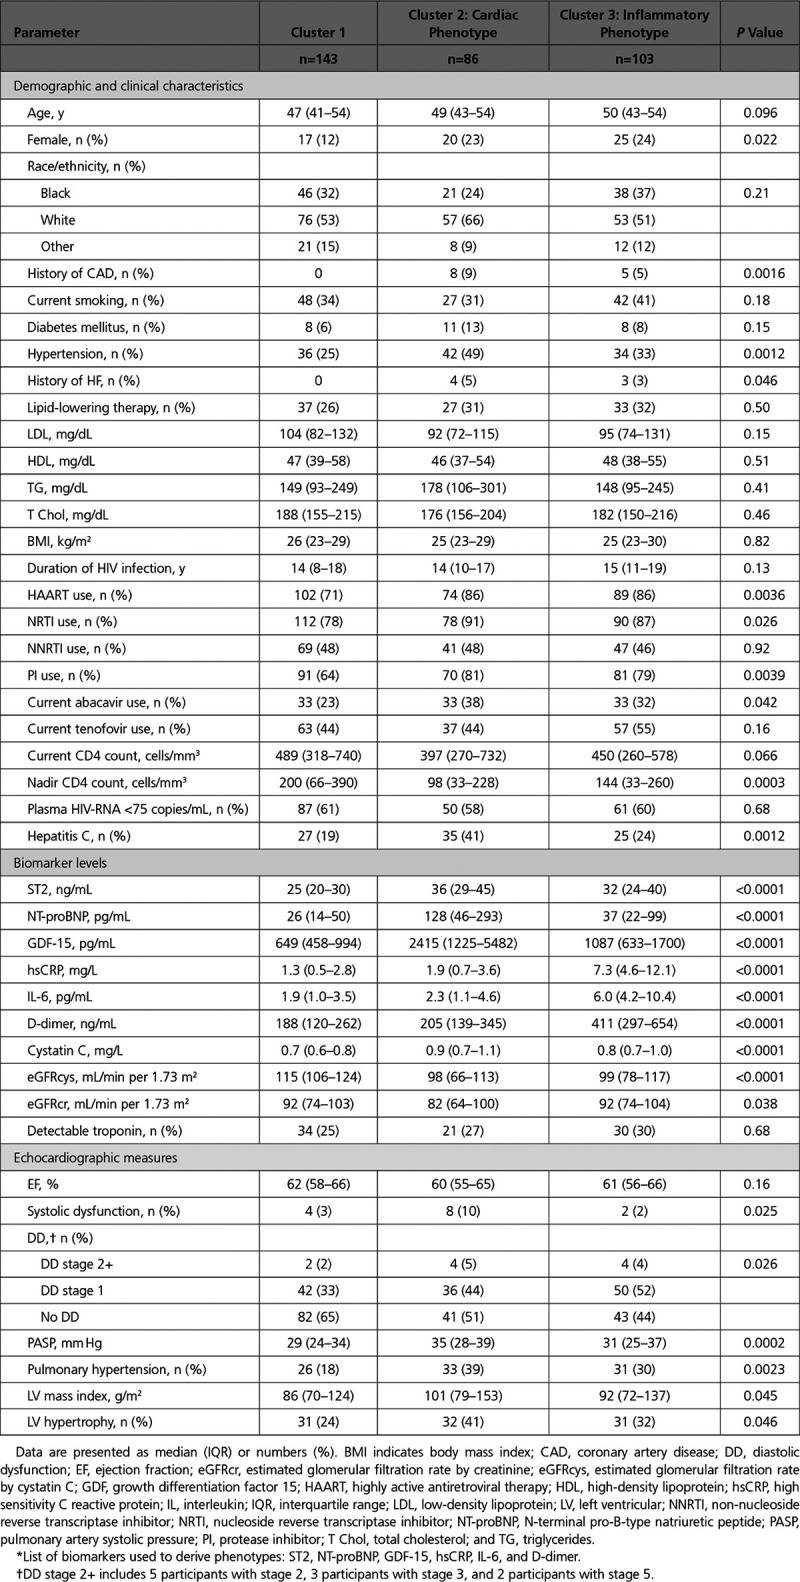
Table 1.
Baseline and Demographic Characteristics, Stratified by Biomarker-Derived Phenotype*
Weighted biomarker scores generated using canonical correlation analysis showed that the first score I was driven by inflammatory markers (CRP, IL-6, and D-dimer) and the second score C by HF markers (ST2, NT-proBNP, and GDF-15). A comparison of scores I and C showed good differentiation between the 3 k-means–derived clusters (Figure 2): cluster 1 was characterized by low levels of all markers, cluster 2 had elevated cardiac markers (score C) but not inflammatory markers, and cluster 3 had elevated inflammatory markers (score I), with some having increases in cardiac markers.
Figure 2.
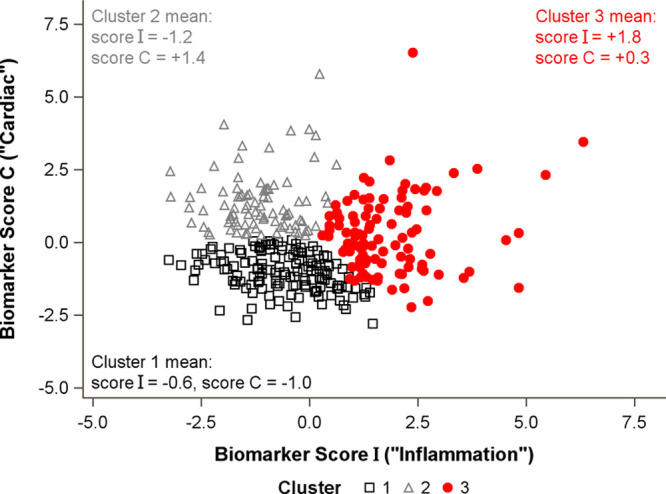
Association of integrated biomarker scores with cluster membership.Scatterplot shows separation of clusters by integrated biomarker scores. Standardized canonical coefficients were used to calculate integrated biomarker scores as follows: Score I=−0.08×ST2–0.40×BNP−0.27×GDF-15+0.81×CRP+0.61×IL-6+0.71×D-dimer. Score C=+0.53×ST2+0.59×BNP+0.80×GDF-15+0.05×CRP+0.03×IL-6+0.12×D-dimer. Each biomarker is log-transformed and standardized to a mean of 0 and SD of 1. BNP indicates N-terminal pro-B-type natriuretic peptide; CRP, C-reactive protein; GDF-15, growth differentiation factor-15; and IL-6, interleukin-6.
Cohort Characteristics
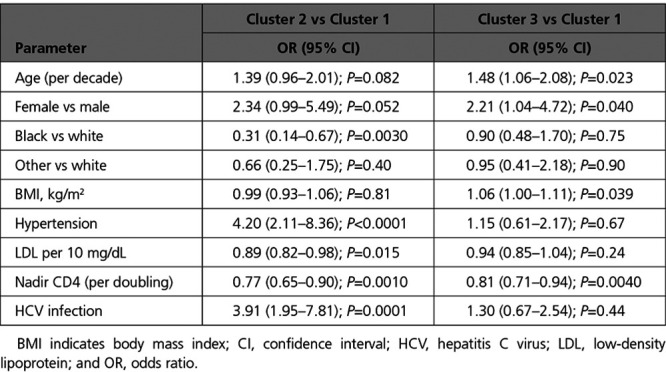
Demographic and baseline clinical characteristics stratified by biomarker-derived cluster are shown in Table 1. The overall median age was 49 years, 19% were female, 32% were black, 56% were white, and 12% were of other race or ethnicity. In multinomial logistic regression analysis, factors independently associated with cluster 2 (cardiac) membership included white race, hypertension, lower low-density lipoprotein, lower nadir CD4 count, and hepatitis C virus coinfection (Table 2). Factors independently associated with cluster 3 (inflammatory) membership included older age, female sex, higher body mass index, and lower nadir CD4 count.
Table 2.
Multinomial Logistic Regression Analysis of Factors Associated With Cluster Membership
Associations of Biomarker Clusters With Echocardiographic Measures
Associations of biomarker-derived clusters with echocardiographic measures are also shown in Table 1. Levels of LV ejection fraction were similar across the clusters (median 61% overall), and rates of systolic dysfunction were somewhat higher in cluster 2 but low overall (5%). DD was most prevalent in cluster 3 and intermediate in cluster 2. In contrast, PH and LV hypertrophy were most prevalent in cluster 2 and intermediate in cluster 3.
In demographic adjusted analysis, cluster 3 was associated with a 59% increased risk (P=0.0018) of DD relative to cluster 1 (Table 3). Cluster 2 had a 36% increased risk of DD relative to cluster 1, but the association did not reach statistical significance (P=0.064). After adjustment for traditional and HIV-related factors, cluster 3 remained independently associated with a 55% increased risk of DD (P=0.0047), whereas the association for cluster 2 weakened substantially. Similarly, cluster 3 was associated with a 51% increased risk of DD relative to cluster 1 (P=0.0060) in a parsimonious model that retained only statistically significant covariates.
Table 3.
Association of Biomarker-Derived Phenotype* With Echo-Derived Outcomes and All-Cause Mortality
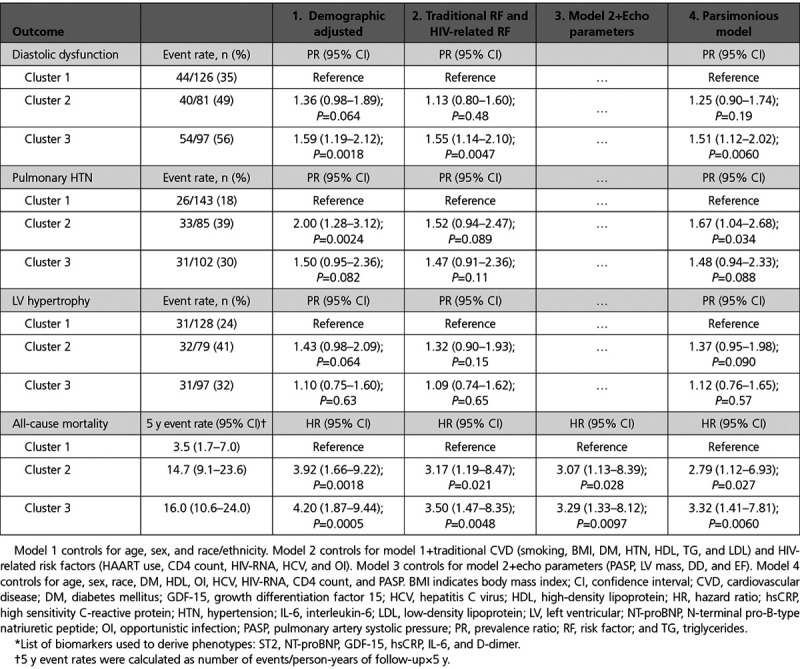
Cluster 2 was associated with a 2-fold higher risk of PH in demographic adjusted analysis (P=0.0024) relative to cluster 1, whereas cluster 3 had a 50% increased risk (P=0.082). After adjustment for traditional and HIV-related factors, cluster 2 was associated with a 52% increased risk of PH (P=0.089). In a parsimonious model that retained only statistically significant covariates, cluster 2 was associated with a 67% increased risk of PH (P=0.034).
Cluster 2 was associated with a 43% increased risk of LV hypertrophy in demographic adjusted analysis (P=0.064). However, the association weakened after multivariable adjustments.
Associations of Biomarker Clusters With All-Cause Mortality
We next examined associations of cluster membership with all-cause mortality. A total of 48 deaths occurred over a median 6.9-year follow-up. Rates of all-cause mortality were lowest in cluster 1 and highest in clusters 2 and 3 (Figure 3). In demographic adjusted analysis, both clusters 2 and 3 were associated with a 4-fold higher risk of mortality (Table 3). After adjustment for traditional risk factors, HIV-related factors, and echocardiographic measures, clusters 2 and 3 each remained independently associated with a 3-fold higher risk of mortality, relative to cluster 1 (both P<0.05).
Figure 3.
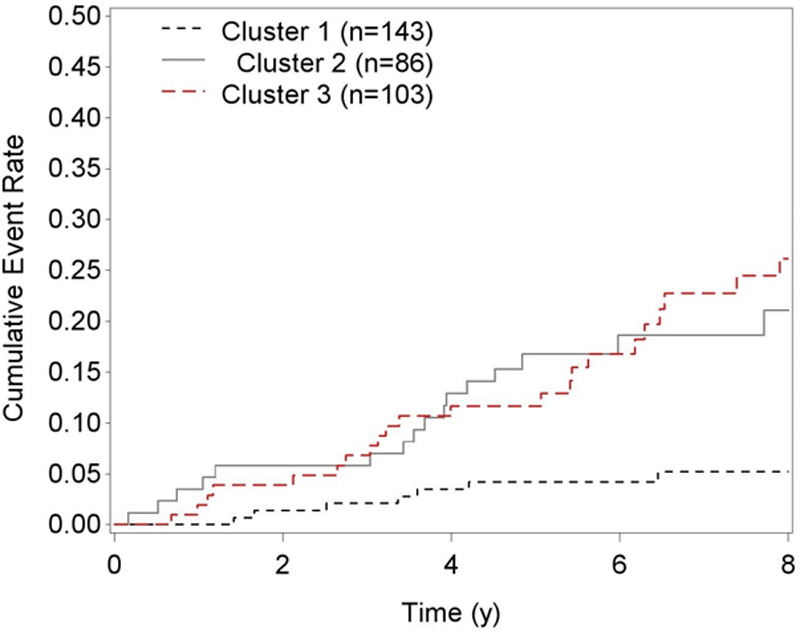
Cumulative mortality by biomarker-derived phenotype. The following is a list of biomarkers used to derive phenotypes: ST2, NT-proBNP (N-terminal pro-B-type natriuretic peptide), GDF-15 (growth differentiation factor 15), hsCRP (high sensitivity C-reactive protein), IL-6 (interleukin-6), and D-dimer.
As an alternative, we tested the 2 integrated biomarker scores in place of the clusters. When adjusted simultaneously, we found that the first score (inflammatory) showed a statistically significant association only with DD (hazard ratio [HR], 1.10 per 1 SD increase; P=0.014). By contrast, the second score (cardiac) had statistically significant associations with all outcomes, independent of traditional and HIV-related risk factors. Specifically, each 1 SD increase in the cardiac score was associated with DD (prevalence ratio [PR], 1.10; P=0.035), pulmonary hypertension (PH) (PR, 1.19; P=0.0009), LV hypertrophy (PR, 1.15; P=0.0016), and all-cause mortality (HR, 1.43; P=0.0009).
Because our earlier work found that ST2 was independently associated with both mortality and echocardiography findings, we performed sensitivity analyses to determine whether our cluster variable was independent of ST2. When we tested ST2 and the cluster variable simultaneously in multivariable adjusted models, we found that ST2 was no longer statistically significant for DD, PH, or mortality (data not shown). By contrast, cluster 3 remained independently associated with DD (PR, 1.4; P=0.029) and mortality (HR, 2.5; P=0.045) and cluster 2 remained independently associated with PH (PR, 1.7; P=0.032). Additional models found that cluster 3 was independent of GDF-15 and cluster 2 was independent of D-dimer for mortality (HR, 2.8; P=0.028 and HR, 2.6; P=0.040, respectively).
Because a large percentage of our cohort had detectable viremia at baseline, we also assessed interactions of cluster membership with viremia for each outcome. Tests for cluster by HIV-RNA interaction were weak and did not reach statistical significance for DD (P=0.63), PH (P=0.62), or mortality (P=0.71).
Alternative Cluster Results
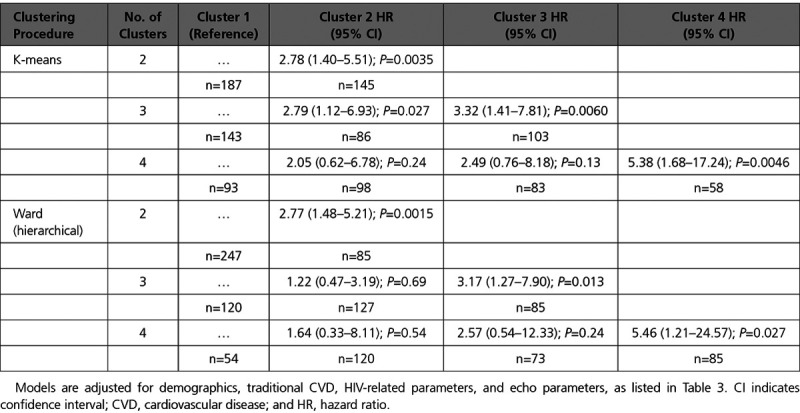
We also performed sensitivity analyses in which we varied the number of clusters and compared our method (k-means) to an alternative, hierarchical clustering procedure (Ward method) for prediction of all-cause mortality. Models adjusting for traditional CVD risk factors, HIV-related factors, and echocardiographic measures are shown in Table 4. When the number of clusters was chosen to be 2, we found a statistically significant difference between clusters for mortality risk for both k-means (HR, 2.78; P=0.0035) and Ward method (HR, 2.77; P=0.0015). When the number of clusters was chosen to be 3, we found that clusters 2 and 3 were both associated with increased mortality risk for k-means, while only cluster 3 reached statistical significance for Ward method (HR, 3.17; P=0.013). When the number of clusters was chosen to be 4, we found that only cluster 4 had a significantly increased mortality risk (k-means: HR, 5.38; P=0.0046; Ward: HR, 5.46; P=0.027). By contrast, clusters 2 and 3 showed 2-fold and 2.5-fold increased mortality risks, respectively, for k-means, but neither association reached statistical significance (P=0.24 and P=0.13). Similarly, Ward method showed that the intermediate clusters did not reach statistical significance (HR, 1.6 for cluster 2; P=0.54; HR, 2.6 for cluster 3; P=0.24).
Table 4.
Associations of Cluster Membership With All-Cause Mortality, by Procedure and Number of Clusters
Discussion
In this cohort of 332 HIV-infected men and women, we found that serum biomarker–derived clusters can be used to partition subjects into different phenotypes for differentiating cardiopulmonary structural and functional abnormalities and for predicting mortality risk. We used 6 distinct biomarkers to classify participants into separate clusters, without incorporating any clinical information. Cluster 2 (cardiac phenotype) had an increased risk of both PH and mortality, whereas those classified into cluster 3 (inflammatory phenotype) had an increased risk of both DD and mortality, independent of standard CVD risk factors and HIV-related factors. Both clusters 2 and 3 predicted mortality independent of echocardiographic findings (PH and DD).
Clusters 2 and 3 were both characterized by lower nadir CD4 cell counts consistent with having more advanced HIV disease. In addition, cluster 2 participants had a higher prevalence of hypertension, lower low-density lipoprotein, and hepatitis C virus coinfection, whereas cluster 3 participants were characterized by older age, female sex, and higher body mass index. Our cluster variable was independently associated with DD, PH, and all-cause mortality, even when controlling for traditional and CVD risk factors.
We previously reported that ST2 and GDF-15 are associated with both cardiovascular dysfunction and mortality risk, even after controlling for traditional CVD risk factors and HIV-related factors.2 In this analysis, we found that our cluster categories had strong, independent associations with DD, PH, and all-cause mortality. Although individual biomarkers also showed statistically significant associations with cardiac dysfunction and mortality, these markers were not simultaneously predictive, making it difficult to reconcile the findings of multiple markers.
We examined associations of both clusters and integrated biomarker scores with our study outcomes. Although the continuous biomarker scores had more statistical power than the clusters (which are categorical and therefore discard information), a disadvantage is that they are less interpretable and harder to communicate clinically. Clusters are a useful first step in phenotyping a population. Our goal in this study was not to maximize prediction but rather to create clinically meaningful categories that could be used to differentiate structural and functional abnormalities. An advantage of our cluster-based analysis is that it allows partitioning of subjects into discrete categories of risk, based solely on biomarker levels. In addition, our analysis identified risk factors for these cardiac and inflammatory phenotypes, which are readily available to the clinician. Although clusters have value in understanding the heterogeneity in a population, translation to the clinical setting can be facilitated using integrated biomarker scores. Such scores could be applied to an individual patient to quantify their risk, giving a more flexible assessment because the degree of HF risk exists on a continuum.
To our knowledge, this is the first study to use biomarker-based cluster analysis to classify cardiopulmonary abnormalities and to predict mortality in the setting of HIV infection. A recent study of HF patients used phenotype data (67 variables including ECG, echocardiography, clinical, and laboratory measures) to cluster patients into 3 distinct risk categories, and the authors found strong associations with clinical outcomes.12 By contrast, our study used biomarkers alone to define the clusters, so that we could distinguish and evaluate the biomarkers’ ability to stratify patients into distinct phenotype and risk categories. Although the clusters’ prediction ability would certainly improve if they comprised biomarkers combined with clinical risk factors, our goal was to evaluate serum biomarkers in isolation to measure their incremental contribution, as well as to understand the pathophysiologic pathways that mediate risk.
One potential advantage of using biomarkers from just one sample type (ie, serum) is that the selected panel can be used to develop a multiplex assay, which may offer advantages of efficiency over individual ELISAs and could be performed using a single methodology.28 Multiplex assays could be used to facilitate clinical applicability, providing a simple, clinically relevant message to clinicians and patients about the risk of disease. Cluster phenotypes could also be derived from larger discovery-based platforms. A recent study of a cohort with stable coronary heart disease29 derived a 9 protein prognostic score from an initial panel of 1130 proteins. This score had associations with a composite cardiovascular outcome, which were independent of traditional Framingham variables. Additional work is needed to study these proteins in the setting of HIV infection.
Our results illustrate the strengths and limitations of the use of serum biomarkers for the classification of cardiac structural abnormalities and prediction of mortality in the setting of HIV infection. Our novel cluster method allowed us to select a relevant subset of 6 markers from 8 candidates, without knowledge of study outcomes. A strength of this approach is that clusters can define useful groups of patients and can mitigate the problems of multicollinearity30 that may arise with the inclusion of multiple correlated measures in a multivariable regression model. A limitation of this approach is that the optimal number of clusters and optimal procedure can be difficult to determine. Although increasing the number of clusters might allow the detection of more heterogeneity of HF, this comes at a cost of generalizability because of the smaller resulting sample sizes. We found that increasing the number of clusters resulted in smaller, less informative clusters and did not improve model fit materially, whereas using only 2 clusters ignored the distinction between the cardiac and inflammatory phenotypes. An advantage of our chosen procedure (k-means) is that it does not impose a hierarchical structure on the clusters, so that subjects can be partitioned based on unspecified, distinct patterns (eg, elevated in 1 domain and normal in another).
Although our results have not yet been validated in an external cohort, our work serves as a prototype for future cardiac biomarker studies. Precedent for this approach includes use of gene expression data to identify cancer subtypes10 and use of prognostic biomarkers to identify patients who can benefit from a treatment.11 We envision that clinicians will be able to use such a biomarker panel to determine both the stage and type of HF risk (cardiac versus inflammatory) of an individual HIV-infected patient for HF and early mortality. Although our biomarker clusters were derived using cross-sectional data, they may represent a serial progression of risk in which inflammation occurs first, leading to DD, which in turn leads to cardiac biomarker elevation and PH.31,32 In addition, this biomarker panel could be repeated to provide updated information on a patient’s cardiac health.
Our study includes several limitations. Our 8 biomarkers were measured at a single time point, so we cannot rule out the possibility that DD and PH were a cause rather than a consequence of biomarker elevations. We did not use a high-sensitivity troponin assay, and only one third of our participants had detectable troponin levels. We did not have adjudicated HF outcomes, and our diagnosis of PH by echocardiogram lacks specificity compared with hemodynamic studies and cannot discriminate between the causes of PH.33 Our analysis found that GDF-15 and soluble ST2 clustered with NT-proBNP and not with the inflammatory markers. Although both GDF-15 and soluble ST2 have been strongly associated with CVD in multiple studies and have shown usefulness in HF staging,34 GDF-15 is also elevated in a variety of malignancies, such as colorectal cancer,35 whereas soluble ST2 is elevated in allergic and inflammatory disorders.36 However, our biomarker clusters were associated with PH, DD, and mortality even after controlling for immune status (CD4 count and HIV-RNA level), suggesting that GDF-15 and soluble ST2 are useful in staging HF in the setting of HIV infection. Although NT-proBNP is considered the gold-standard biomarker for HF, it does not capture all dimensions of HF. These results suggest that markers that identify other aspects of heart function/damage may be needed to inform prognosis and diagnosis. Additional work is needed to understand the role of potentially cardiotoxic antiretroviral drugs, such as abacavir, and to validate our findings in other cohorts. Forty percent of our participants had detectable viremia; however, we found that cluster associations were similar in those with both detectable and undetectable viremia. Finally, there may have been incomplete or inadequate control for factors that may confound or mediate the association of elevations in cardiac biomarkers with HF and mortality.
Conclusions
In summary, we have shown that unsupervised cluster analysis (ie, uninformed by the outcome variable) of cardiac biomarkers can identify distinct categories of risk and thereby help differentiate cardiopulmonary structural and functional abnormalities, as well as mortality risk. Further studies of HIV-infected people are needed to validate these results. A study of low-dose methotrexate is currently being conducted to determine whether inflammatory marker reduction can improve endothelial function in HIV-infected adults (NCT01949116). Additional studies of other anti-inflammatory therapies may also be needed to identify safe and effective methods of reducing inflammation in HIV-infected people. A broader array of candidate biomarkers may improve discrimination potential. In the future, the use of cardiac biomarker panels could help inform the diagnosis and staging of HF and may be used to identify patients who are at risk of drug toxicity.
Sources of Funding
This study was funded by the National Institutes of Health (K24AI112393 to Dr Hsue). The SCOPE cohort (Study of the Consequences of the Protease Inhibitor Era) is also supported in part by National Institute of Allergy and Infectious Diseases (K24AI069994), the University of California, San Francisco/Gladstone Institute of Virology and Immunology (P30AI027763), the University of California, San Francisco, Clinical and Translational Research Institute Center (UL1RR024131), and the Center for AIDS Research Network of Integrated Systems (R24 AI067039).
Disclosures
Dr Scherzer received an honorarium from Merck for participating in a Renal Expert Input Forum in June 2014; this honorarium was donated to Northern California Institute for Research and Education to support kidney research. Dr Hsue has received honoraria from Gilead. The other authors report no conflicts.
Supplementary Material
Footnotes
The Data Supplement is available at http://circheartfailure.ahajournals.org/lookup/suppl/doi:10.1161/CIRCHEARTFAILURE.117.004312/-/DC1.
REFERENCES
- 1.Shah MR, Wong RP. The changing paradigm of HIV-related heart failure. Glob Heart. 2015;10:241–244. doi: 10.1016/j.gheart.2015.09.001. doi: 10.1016/j.gheart.2015.09.001. [DOI] [PubMed] [Google Scholar]
- 2.Secemsky EA, Scherzer R, Nitta E, Wu AH, Lange DC, Deeks SG, Martin JN, Snider J, Ganz P, Hsue PY. Novel biomarkers of cardiac stress, cardiovascular dysfunction, and outcomes in HIV-infected individuals. JACC Heart Fail. 2015;3:591–599. doi: 10.1016/j.jchf.2015.03.007. doi: 10.1016/j.jchf.2015.03.007. [DOI] [PMC free article] [PubMed] [Google Scholar]
- 3.Mondy KE, Gottdiener J, Overton ET, Henry K, Bush T, Conley L, Hammer J, Carpenter CC, Kojic E, Patel P, Brooks JT SUN Study Investigators. High prevalence of echocardiographic abnormalities among HIV-infected persons in the era of highly active antiretroviral therapy. Clin Infect Dis. 2011;52:378–386. doi: 10.1093/cid/ciq066. doi: 10.1093/cid/ciq066. [DOI] [PubMed] [Google Scholar]
- 4.Hoeper MM, Barberà JA, Channick RN, Hassoun PM, Lang IM, Manes A, Martinez FJ, Naeije R, Olschewski H, Pepke-Zaba J, Redfield MM, Robbins IM, Souza R, Torbicki A, McGoon M. Diagnosis, assessment, and treatment of non-pulmonary arterial hypertension pulmonary hypertension. J Am Coll Cardiol. 2009;54(suppl 1):S85–S96. doi: 10.1016/j.jacc.2009.04.008. doi: 10.1016/j.jacc.2009.04.008. [DOI] [PubMed] [Google Scholar]
- 5.Lam CS, Roger VL, Rodeheffer RJ, Borlaug BA, Enders FT, Redfield MM. Pulmonary hypertension in heart failure with preserved ejection fraction: a community-based study. J Am Coll Cardiol. 2009;53:1119–1126. doi: 10.1016/j.jacc.2008.11.051. doi: 10.1016/j.jacc.2008.11.051. [DOI] [PMC free article] [PubMed] [Google Scholar]
- 6.Aljaroudi W, Alraies MC, Halley C, Rodriguez L, Grimm RA, Thomas JD, Jaber WA. Impact of progression of diastolic dysfunction on mortality in patients with normal ejection fraction. Circulation. 2012;125:782–788. doi: 10.1161/CIRCULATIONAHA.111.066423. doi: 10.1161/CIRCULATIONAHA.111.066423. [DOI] [PubMed] [Google Scholar]
- 7.Remick J, Georgiopoulou V, Marti C, Ofotokun I, Kalogeropoulos A, Lewis W, Butler J. Heart failure in patients with human immunodeficiency virus infection: epidemiology, pathophysiology, treatment, and future research. Circulation. 2014;129:1781–1789. doi: 10.1161/CIRCULATIONAHA.113.004574. doi: 10.1161/CIRCULATIONAHA.113.004574. [DOI] [PMC free article] [PubMed] [Google Scholar]
- 8.D’Elia E, Vaduganathan M, Gori M, Gavazzi A, Butler J, Senni M. Role of biomarkers in cardiac structure phenotyping in heart failure with preserved ejection fraction: critical appraisal and practical use. Eur J Heart Fail. 2015;17:1231–1239. doi: 10.1002/ejhf.430. doi: 10.1002/ejhf.430. [DOI] [PubMed] [Google Scholar]
- 9.Storrow AB, Lindsell CJ, Han JH, Slovis CM, Miller KF, Gibler WB, Hoekstra JW, Peacock WF, Hollander JE, Pollack CV, Jr EMCREG-i*trACS Investigators. Discordant cardiac biomarkers: frequency and outcomes in emergency department patients with chest pain. Ann Emerg Med. 2006;48:660–665. doi: 10.1016/j.annemergmed.2006.05.016. doi: 10.1016/j.annemergmed.2006.05.016. [DOI] [PubMed] [Google Scholar]
- 10.Pal NR, Aguan K, Sharma A, Amari S. Discovering biomarkers from gene expression data for predicting cancer subgroups using neural networks and relational fuzzy clustering. BMC Bioinformatics. 2007;8:5. doi: 10.1186/1471-2105-8-5. doi: 10.1186/1471-2105-8-5. [DOI] [PMC free article] [PubMed] [Google Scholar]
- 11.Soler ZM, Hyer JM, Rudmik L, Ramakrishnan V, Smith TL, Schlosser RJ. Cluster analysis and prediction of treatment outcomes for chronic rhinosinusitis. J Allergy Clin Immunol. 2016;137:1054–1062. doi: 10.1016/j.jaci.2015.11.019. doi: 10.1016/j.jaci.2015.11.019. [DOI] [PMC free article] [PubMed] [Google Scholar]
- 12.Shah SJ, Katz DH, Selvaraj S, Burke MA, Yancy CW, Gheorghiade M, Bonow RO, Huang CC, Deo RC. Phenomapping for novel classification of heart failure with preserved ejection fraction. Circulation. 2015;131:269–279. doi: 10.1161/CIRCULATIONAHA.114.010637. doi: 10.1161/CIRCULATIONAHA.114.010637. [DOI] [PMC free article] [PubMed] [Google Scholar]
- 13.Wang TJ, Wollert KC, Larson MG, Coglianese E, McCabe EL, Cheng S, Ho JE, Fradley MG, Ghorbani A, Xanthakis V, Kempf T, Benjamin EJ, Levy D, Vasan RS, Januzzi JL. Prognostic utility of novel biomarkers of cardiovascular stress: the Framingham Heart Study. Circulation. 2012;126:1596–1604. doi: 10.1161/CIRCULATIONAHA.112.129437. doi: 10.1161/CIRCULATIONAHA.112.129437. [DOI] [PMC free article] [PubMed] [Google Scholar]
- 14.Duprez DA, Neuhaus J, Tracy R, Kuller LH, Deeks SG, Orkin C, Stoehr A, Woolley IJ, Neaton JD INSIGHT SMART Group. N-terminal-proB-type natriuretic peptide predicts cardiovascular disease events in HIV-infected patients. AIDS. 2011;25:651–657. doi: 10.1097/QAD.0b013e32834404a1. doi: 10.1097/QAD.0b013e32834404a1. [DOI] [PMC free article] [PubMed] [Google Scholar]
- 15.Duprez DA, Neuhaus J, Kuller LH, Tracy R, Belloso W, De Wit S, Drummond F, Lane HC, Ledergerber B, Lundgren J, Nixon D, Paton NI, Prineas RJ, Neaton JD INSIGHT SMART Study Group. Inflammation, coagulation and cardiovascular disease in HIV-infected individuals. PLoS One. 2012;7:e44454. doi: 10.1371/journal.pone.0044454. doi: 10.1371/journal.pone.0044454. [DOI] [PMC free article] [PubMed] [Google Scholar]
- 16.De Luca A, de Gaetano Donati K, Colafigli M, Cozzi-Lepri A, De Curtis A, Gori A, Sighinolfi L, Giacometti A, Capobianchi MR, D’Avino A, Iacoviello L, Cauda R, D’Arminio Monforte A. The association of high-sensitivity c-reactive protein and other biomarkers with cardiovascular disease in patients treated for HIV: a nested case-control study. BMC Infect Dis. 2013;13:414. doi: 10.1186/1471-2334-13-414. doi: 10.1186/1471-2334-13-414. [DOI] [PMC free article] [PubMed] [Google Scholar]
- 17.Lucas GM, Cozzi-Lepri A, Wyatt CM, Post FA, Bormann AM, Crum-Cianflone NF, Ross MJ INSIGHT SMART Study Group. Glomerular filtration rate estimated using creatinine, cystatin C or both markers and the risk of clinical events in HIV-infected individuals. HIV Med. 2014;15:116–123. doi: 10.1111/hiv.12087. doi: 10.1111/hiv.12087. [DOI] [PMC free article] [PubMed] [Google Scholar]
- 18.Neuhaus J, Jacobs DR, Jr, Baker JV, Calmy A, Duprez D, La Rosa A, Kuller LH, Pett SL, Ristola M, Ross MJ, Shlipak MG, Tracy R, Neaton JD. Markers of inflammation, coagulation, and renal function are elevated in adults with HIV infection. J Infect Dis. 2010;201:1788–1795. doi: 10.1086/652749. doi: 10.1086/652749. [DOI] [PMC free article] [PubMed] [Google Scholar]
- 19.Hsue PY, Hunt PW, Ho JE, Farah HH, Schnell A, Hoh R, Martin JN, Deeks SG, Bolger AF. Impact of HIV infection on diastolic function and left ventricular mass. Circ Heart Fail. 2010;3:132–139. doi: 10.1161/CIRCHEARTFAILURE.109.854943. doi: 10.1161/CIRCHEARTFAILURE.109.854943. [DOI] [PMC free article] [PubMed] [Google Scholar]
- 20.Nagueh SF, Appleton CP, Gillebert TC, Marino PN, Oh JK, Smiseth OA, Waggoner AD, Flachskampf FA, Pellikka PA, Evangelista A. Recommendations for the evaluation of left ventricular diastolic function by echocardiography. J Am Soc Echocardiogr. 2009;22:107–133. doi: 10.1016/j.echo.2008.11.023. doi: 10.1016/j.echo.2008.11.023. [DOI] [PubMed] [Google Scholar]
- 21.Rudski LG, Lai WW, Afilalo J, Hua L, Handschumacher MD, Chandrasekaran K, Solomon SD, Louie EK, Schiller NB. Guidelines for the echocardiographic assessment of the right heart in adults: a report from the American Society of Echocardiography endorsed by the European Association of Echocardiography, a registered branch of the European Society of Cardiology, and the Canadian Society of Echocardiography. J Am Soc Echocardiogr. 2010;23:685–713; quiz 786. doi: 10.1016/j.echo.2010.05.010. doi: 10.1016/j.echo.2010.05.010. [DOI] [PubMed] [Google Scholar]
- 22.Cerrato E, D’Ascenzo F, Biondi-Zoccai G, Calcagno A, Frea S, Grosso Marra W, Castagno D, Omedè P, Quadri G, Sciuto F, Presutti D, Frati G, Bonora S, Moretti C, Gaita F. Cardiac dysfunction in pauci symptomatic human immunodeficiency virus patients: a meta-analysis in the highly active antiretroviral therapy era. Eur Heart J. 2013;34:1432–1436. doi: 10.1093/eurheartj/ehs471. doi: 10.1093/eurheartj/ehs471. [DOI] [PubMed] [Google Scholar]
- 23.Hsu JC, Li Y, Marcus GM, Hsue PY, Scherzer R, Grunfeld C, Shlipak MG. Atrial fibrillation and atrial flutter in human immunodeficiency virus-infected persons: incidence, risk factors, and association with markers of HIV disease severity. J Am Coll Cardiol. 2013;61:2288–2295. doi: 10.1016/j.jacc.2013.03.022. doi: 10.1016/j.jacc.2013.03.022. [DOI] [PubMed] [Google Scholar]
- 24.Hartigan JA, Wong A. A k-means clustering algorithm. Appl Stat. 1979;28:100–108. [Google Scholar]
- 25.Charrad M, Ghazzali N, Boiteau V, Niknafs A. NbClust: an R package for determining the relevant number of clusters in a data set. J Stat Softw. 2014;61:1–36. [Google Scholar]
- 26.Steyerberg EW, Vickers AJ, Cook NR, Gerds T, Gonen M, Obuchowski N, Pencina MJ, Kattan MW. Assessing the performance of prediction models: a framework for traditional and novel measures. Epidemiology. 2010;21:128–138. doi: 10.1097/EDE.0b013e3181c30fb2. doi: 10.1097/EDE.0b013e3181c30fb2. [DOI] [PMC free article] [PubMed] [Google Scholar]
- 27.Harrell FE, Jr, Lee KL, Mark DB. Multivariable prognostic models: issues in developing models, evaluating assumptions and adequacy, and measuring and reducing errors. Stat Med. 1996;15:361–387. doi: 10.1002/(SICI)1097-0258(19960229)15:4<361::AID-SIM168>3.0.CO;2-4. doi: 10.1002/(SICI)1097-0258(19960229)15:4<361::AID-SIM168>3.0.CO;2-4. [DOI] [PubMed] [Google Scholar]
- 28.Vistnes M, Christensen G, Omland T. Multiple cytokine biomarkers in heart failure. Expert Rev Mol Diagn. 2010;10:147–157. doi: 10.1586/erm.10.3. doi: 10.1586/erm.10.3. [DOI] [PubMed] [Google Scholar]
- 29.Ganz P, Heidecker B, Hveem K, Jonasson C, Kato S, Segal MR, Sterling DG, Williams SA. Development and validation of a protein-based risk score for cardiovascular outcomes among patients with stable coronary heart disease. JAMA. 2016;315:2532–2541. doi: 10.1001/jama.2016.5951. doi: 10.1001/jama.2016.5951. [DOI] [PubMed] [Google Scholar]
- 30.Belsley DA, Kuh E, Welsch RE. Regression Diagnostics: Identifying Influential Data and Sources of Collinearity. Hoboken, NJ: John Wiley & Sons; 2005. [Google Scholar]
- 31.Georgiopoulou VV, Kalogeropoulos AP, Borlaug BA, Gheorghiade M, Butler J. Left ventricular dysfunction with pulmonary hypertension: Part 1: epidemiology, pathophysiology, and definitions. Circ Heart Fail. 2013;6:344–354. doi: 10.1161/CIRCHEARTFAILURE.112.000095. doi: 10.1161/CIRCHEARTFAILURE.112.000095. [DOI] [PubMed] [Google Scholar]
- 32.Kalogeropoulos AP, Georgiopoulou VV, Butler J. From risk factors to structural heart disease: the role of inflammation. Heart Fail Clin. 2012;8:113–123. doi: 10.1016/j.hfc.2011.08.002. doi: 10.1016/j.hfc.2011.08.002. [DOI] [PubMed] [Google Scholar]
- 33.Grignola JC. Hemodynamic assessment of pulmonary hypertension. World J Cardiol. 2011;3:10–17. doi: 10.4330/wjc.v3.i1.10. doi: 10.4330/wjc.v3.i1.10. [DOI] [PMC free article] [PubMed] [Google Scholar]
- 34.Wang J, Tan GJ, Han LN, Bai YY, He M, Liu HB. Novel biomarkers for cardiovascular risk prediction. J Geriatr Cardiol. 2017;14:135–150. doi: 10.11909/j.issn.1671-5411.2017.02.008. doi: 10.11909/j.issn.1671-5411.2017.02.008. [DOI] [PMC free article] [PubMed] [Google Scholar]
- 35.Li C, Wang J, Kong J, Tang J, Wu Y, Xu E, Zhang H, Lai M. GDF15 promotes EMT and metastasis in colorectal cancer. Oncotarget. 2016;7:860–872. doi: 10.18632/oncotarget.6205. doi: 10.18632/oncotarget.6205. [DOI] [PMC free article] [PubMed] [Google Scholar]
- 36.Januzzi JL., Jr ST2 as a cardiovascular risk biomarker: from the bench to the bedside. J Cardiovasc Transl Res. 2013;6:493–500. doi: 10.1007/s12265-013-9459-y. doi: 10.1007/s12265-013-9459-y. [DOI] [PubMed] [Google Scholar]