Abstract
Height and weight are measurements explored to tracking nutritional diseases, energy expenditure, clinical conditions, drug dosages, and infusion rates. Many patients are not ambulant or may be unable to communicate, and a sequence of these factors may not allow accurate estimation or measurements; in those cases, it can be estimated approximately by anthropometric means. Different groups have proposed different linear or non-linear equations which coefficients are obtained by using single or multiple linear regressions. In this paper, we present a complete study of the application of different learning models to estimate height and weight from anthropometric measurements: support vector regression, Gaussian process, and artificial neural networks. The predicted values are significantly more accurate than that obtained with conventional linear regressions. In all the cases, the predictions are non-sensitive to ethnicity, and to gender, if more than two anthropometric parameters are analyzed. The learning model analysis creates new opportunities for anthropometric applications in industry, textile technology, security, and health care.
Keywords: Machine learning, statistical learning, health information management
We present a complete study of the application of different learning models to estimate height and weight from anthropometric measurements: Support Vector Regression, Gaussian Process, and Artificial Neural Networks are compared. The predicted values are significantly more accurate than those obtained with conventional linear regressions. This learning model analysis creates new opportunities for anthropometric applications in industry, textile technology, security, and healthcare.
I. Introduction
Height and Weight are measurements broadly explored to tracking child’s growth, nutritional diseases, energy expenditure, clinical conditions and health status [1]; Patients regularly are not ambulant or may be unable to communicate, and a sequence of these factors may not allow accurate estimation or measurements [2], [3].
Intensive care unit scoring systems, drug dosages, and infusion rates are commonly based on body weight, as well as, height is usually used to obtain a relation of healthy versus unhealthy weight [4]. Therefore, a correct estimation of height and weight of critically ill patients are critical for an adequate clinical care [1], [2].
W. C. Chumlea has been one of the first researchers to proposed linear equations to predict body height [1], [5], [6] and weight [1], [7] from anthropometric measurements for an elderly population. The equations are based on linear regressions, developed for a selected population in the USA, predicting weight within 95% confidence limits in a range of 7.60-8.96kg, as well as, height with standard errors between 7.84cm and 8.44cm, depending on gender and Ethnicity; Therefore, the equations may be inappropriate for other populations [1].
Different groups have proposed subtly different weight/ height prediction equations, based on single and multiple linear regressions, exploring other anthropometric parameters or analyzing other populations, achieving similar standard errors [8]–[12]. Linear regressions are attractive models because their representations are simple, and a straightforward algebra returns an analytical solution [13], that can be easily implemented by a healthcare professional.
Contemporaneously with the Chumlea’s work, the Machine Learning (ML) field and its models from statistics and probability theory began to play and important role in research, engineering, economy, health, etc. [14]–[16]. ML is closely related to computational statistics, and it is defined as the development of algorithms that learn and make predictions from data or experience [17]. ML algorithms can find patterns in complex scenarios, usually impossible to be identified by humans [18], therefore, ML regressions are usually more accurate than conventional regressions [13].
Recently, kernel machines have been presented as an appropriated approach for regression of biometric data [19]–[21]. As stated by Scholkopf, kernel machines provide modularity in the design, enabling easy combination with different learning algorithms, and have few parameters to be tuned in comparison with other models such as neural networks in an optimization procedure without spurious local minima [22], [23]. Moreover, other works have demonstrated that kernel machines have a strong founding theory, providing a more appropriated data representation for the problem that has been studied [24], [25].
Therefore, in this work, we aim to analyze the regression capability of kernel machines in comparison with traditional approaches for height and weight estimation from anthropometric measurements. We consider both sparse and non-sparse kernel machines - Support Vector Regression and Gaussian Process, respectively - to address the regression problem. Additionally, we also include a comparison with the results obtained by neural networks since such models have been extensively applied in machine learning problems recently. The method is demonstrated using the Third National Health and Nutrition Examination Survey [26] and the U.S. Army Anthropometry Survey [27] databases. Finally, the potentiality of the method is explored in a scenario of a patient without or partial mobility.
II. Methods
A. Statistical Regressions
In statistical regression, the relationships are modeled using linear or nonlinear predictor functions whose unknown model parameters are estimated from the experimental data. For instance, a mapping has two or more explanatory variables, given by [13]:
 |
where  is the dot product between the weight vector
  and the inputs values
  and
and  is a bias or residual error, conventional regression models are often fitted using the least squares approach. For example, Chumlea et al.
[5] establish a linear prediction equation where
  is height,
  is the knee height, and
  is a multiplicative coefficient different for each analysed population.
Statistical regressions are attractive models to drawing conclusions about general principles based on a set of observations. In this work, the results obtained for different statistical traditional regressions are similar to the obtained with linear regressions (LR); for that reason, our discussion is limited to LR.
B. Machine Learning Regressions
ML regression models are highly adaptable and are capable of modeling complex relationships; it can be implemented instead of statistical regression for the following cases: the primary goal is to predict rather than explain, predictor variables are correlated or have non-linear relationships to the target variable, and there are numerous complex variable interactions.
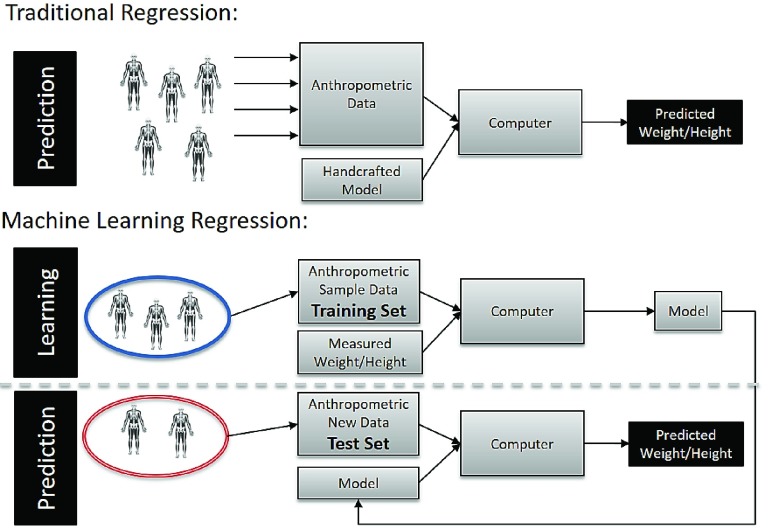
As represented in Figure 1, in the case of ML Regression, instead of defined functions (Hand-crafted model) as used in statistical regression, one part of the existing data (i.e. Training and Validation Set) is used to identify settings for the model parameters that return the best realistic predictive performance, building and tuning the model. Another part of the data with new examples (i.e. Test Set) is used to test the performance of the regression model [28].
FIGURE 1.
Comparison between traditional and machine learning work-flow regressions.
Sparse kernel machines are those one in which the kernel evaluation needs only a subset of the training data. In SVMs, for example, as less support vectors are used, sparser is the model since it will assign zero weights to most training patterns. Therefore, usually sparsity is a desired behavior because it gives a better interpretability and provides much faster solutions reducing the computational cost of the model. However, the information carried in the patterns with assigned zero weights is lost and it could be important in some type of problems [29], in special, those problems that are more susceptible to overfitting.
1). Support Vector Regression (SPARSE)
Support Vector Regression (SVR) with different Kernel functions such as Linear, Polynomial, and Gaussian function were explored. SVR with Gaussian Kernel achieved the best performance, the Gaussian base function is given by  , where
  is a transformation that maps
  to a high-dimensional space. For that reason, in this work our discussion is limited to SVR with Gaussian Kernel [30].
2). Gaussian Processes Regression (NON-SPARSE)
Gaussian process Regression (GPR) uses lazy learning methods and a similarity measure between points to predict values for unseen points from training data, more details can be found in [31] and [32]. Therefore, it is possible to compute the prediction intervals using the trained model.
3). Neural Network Regression
The Neural Network Regression (NNR) is composed by Two-layer feed-forward with ten hidden sigmoid neurons. A Levenberg-Marquardt algorithm has been explored for training [33].
In this work, 70% of the analyzed data corresponds to the training group (train the ML regression and adjust the model weights); other 15% is the validation group, used to determine whether the classification accuracy of the ML regression is increasing or over-fitting. Finally, the rest 15% is going to test the trained ML model. The weight and height prediction performance of the different models were assessed using the Root Mean Square Error (RMSE). RMSE amplifies and severely punishes significant errors, and it is more appropriate to gauge model performance [34]. Moreover, it is on the same scale and units of the analyzed parameter (i.e. weight in kilograms and height in centimeters).
C. Databases
1). NHANES III
The Third National Health and Nutrition Examination Survey were collected between 1988 and 1994, contains data for 33,994 persons. Three ethnic groups are analyzed, non-Hispanic white (40%), non-Hispanic Black (30%) and Mexican-American (30%) subgroups for the US population [26]. In this work, we have selected adult subjects (over 21 years), with full data about anthropometric parameters related with height and weight corresponding to 4261 and 14783 subjects, respectively. Details about the measurement methodology to collect data can be found in [5] and [26].
2). ANSUR
The 1988 U.S. Army Anthropometry Survey is one of the most widely used anthropometry databases because of the rigorous methodology and a large number of measures [27]. The database is composed of two Gender subgroups: Male (1774) and Female (2208) subjects, totalizing 3982 samples.
III. Anthropometric Correlation Analysis
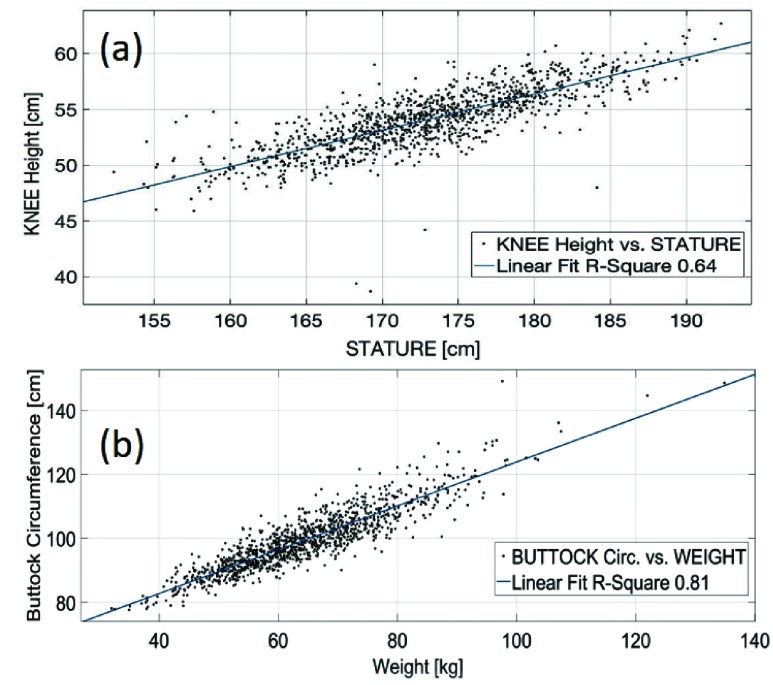
There are several correlations between anthropometric measurements of the human body, such as body height and Member-height, as well as, weight and Member-circumference. In Figure 2 are represented, usual correlations explored in healthcare: Height vs. Knee-height (a) and weight vs. Buttock-circumference (b).
FIGURE 2.
Scatter diagrams for a non-Hispanic white male group (1369 subjects): Height vs. Knee-height (a) and weight vs. Buttock-circumference (b).
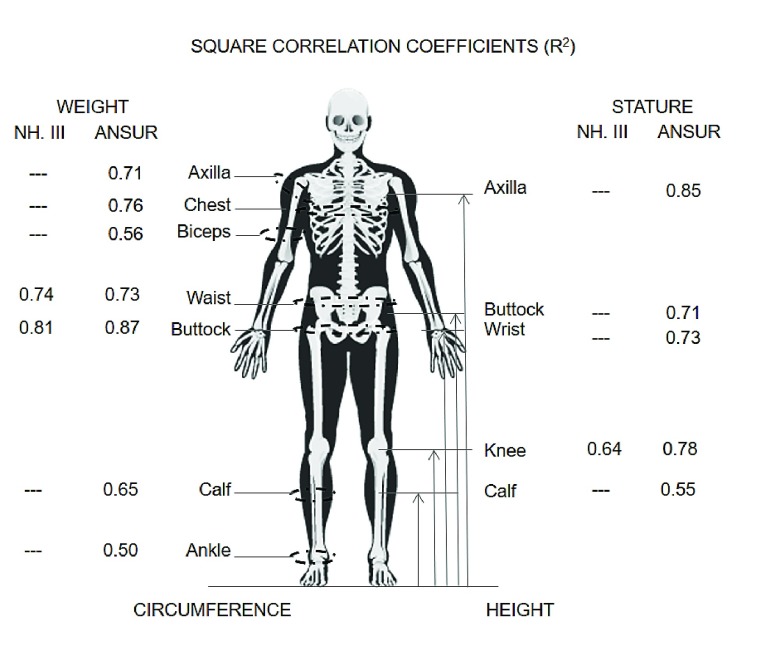
The most representative anthropometric Square Correlation Coefficients ( ) for weight and height are summarized in Figure 3. The correlation analysis has been elaborated for a non-Hispanic white male group (NHANES III, 1369 subjects) and a Male Group (ANSUR, 1776 subjects).
FIGURE 3.
Weight and Member-circumference (left), as well as, height and Member-height (right) correlations for a non-Hispanic white Male Group (NHANES III, 1369 subjects) and a Male Group (ANSUR, 1776 subjects).
Weight is often related with Waist-circumference [5], without regard that there are high correlations with Buttock, Arm, Calf, Biceps, and Chest circumference as well. Therefore, an individual or combinational parameter analysis of other parameters may be explored in cases where is not possible to measure Waist-circumference.
An analysis of the predicted weight and height for different individual or combinations of Anthropometric Measurements is illustrated in the following subsections.
A. Predicted Weight
Three cases of the multiple possible combinations of anthropometric parameters are explored to analyze the performance to predict weight of the ML regressions. Anthropometric data corresponds to 14783 adult subjects from NHANES III database.
The combination of anthropometric parameter inputs are organized as follow:
-
•
Comb. 1: Waist circumference;
-
•
Comb. 2: Gender, Ethnicity, height, as well as, Buttock and Waist circumferences;
-
•
Comb. 3: Comb. 2 in addition to Arm circumference.
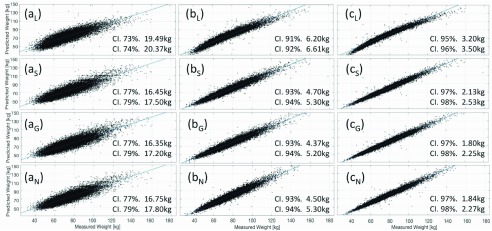
Figure 4 shows the scatter diagram of the Predicted vs. Measured weight of the proposed combinations obtained by Linear and ML regressions; a solid line is used to represent a perfect correlation ( ).
).
FIGURE 4.
Predicted vs Measured weight scatter diagram; for Linear (L), Support Vector (S), Gaussian Process (G) and Neural Network (N) regressions. Anthropometric parameters explored are: (a) Waist circumference (Waist); (b) Waist, Height, Buttock circumference (Butt.), Thigh Circumference (Thigh), Gender, Ethnicity (Ethn.); (c) Waist, Height, Butt., Thigh, Arm Circumference (Arm), Gender and Ethn. Group of 14783 adult subjects from NHANES III.
For Comb. 1, (Fig. 4(a)) where the Waist circumference parameter is the only input parameter, the RMSE values obtained are similar to the reported in the literature [5], which confidence interval (CI) is next to 78% and limits between 16.55kg and 18.49kg.
Furthermore, in the cases of Comb 2. and Comb. 3 (Fig. 5(b) and (c)), if more parameters are explored to train the models, the prediction is much more accurate. A CI of 95% with limits of 3.20kg and 3.50kg is obtained with linear regression, whereas, the best prediction performance is achieved with GPR, CI of 98% with limits of 1.80kg and 2.25kg. The prediction performance of NNR and SVR are subtly larger than the obtained with GPR.
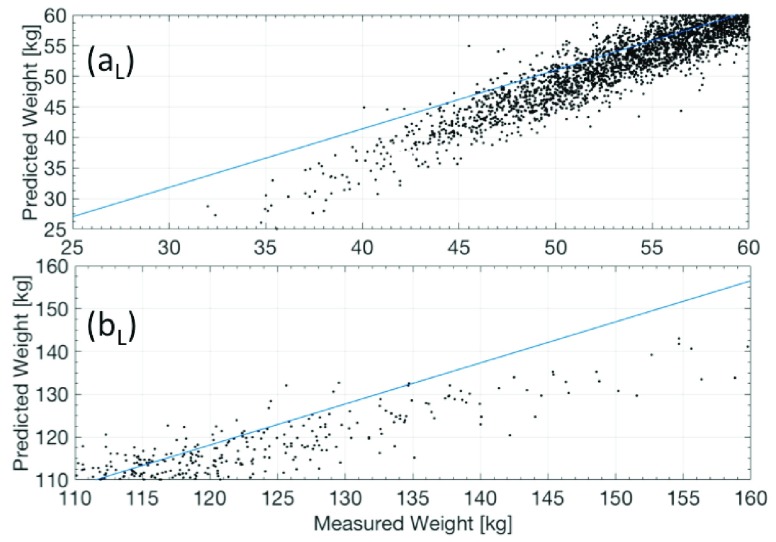
FIGURE 5.
Scatter diagram of the Predicted vs. Measured weight by using a conventional (Linear) regression, for a group of adult subjects from the NHANES III database (14783 subjects); (a) lighter 50kg (approx. 1500 subjects), and (b) heavier than 110kg (approx. 300 subjects). The solid line is a perfect weight prediction.
Unlike ML regressions, the weight prediction with conventional regressions fails ( ) for values smaller than 50kg and higher than 110kg, as shown in Figure 4. (c). The same behavior is observed for other possible combinations of anthropometric values. In Figure 5, it can be seen the tendency of the weight prediction with a LR and its difference with a perfect correlation (Solid Line).
Examples of the prediction model performance for different anthropometric parameter combinations are summarized in Table 1; each subtable is organized by the number of anthropometric parameters explored as input: one, two (vertical and a horizontal parameter) and four parameters.
TABLE 1. Weight Prediction Performance (RMSE in Kilograms) of Linear, Support Vector, Gaussian Process, and Neural Network Regressions; for 14783 Adult Subjects (NHANES III). The Anthropometric Parameters Input are Height, Gender, Ethnicity (Ethn.), as Well as, Buttock (Butt.), Thigh (Thigh), Waist, (Waist) and Arm Circumferences (Arm).
| Linear Regression | |||||||||||||
|---|---|---|---|---|---|---|---|---|---|---|---|---|---|
| Two Param. | Four Param. + Gender + Ethn. | ||||||||||||
| One Param. | +Height | +Butt. | +Thigh | +Waist | +Arm | +Gender | +Ethn. | +Height +Arm +Butt |
+Height +Arm +Thigh |
+Height +Arm +Waist |
|||
| Anthropom. | Parameter | Height | 14.30 | – | 6.69 | 8.33 | 6.81 | 6.48 | 14.30 | 14.30 | |||
| Butt. | 9.95 | 6.69 | – | 9.04 | 8.10 | 7.33 | 6.38 | 9.94 | – | 4.32 | 3.70 | ||
| Thigh | 10.00 | 8.33 | 9.04 | – | 6.59 | 7.54 | 8.43 | 10.00 | 4.32 | – | 3.60 | ||
| Waist | 9.06 | 6.48 | 8.10 | 6.59 | – | 6.90 | 8.54 | 9.04 | 3.70 | 3.60 | – | ||
| Arm | 8.11 | 6.48 | 7.33 | 7.54 | 6.90 | – | 7.66 | 8.00 | |||||
| Support Vector Regression/Gaussian Process Regression | |||||||||||||
| Two Param. | Four Param. + Gender + Ethn. | ||||||||||||
| One Param. | +Height | +Butt. | +Thigh | +Waist | +Arm | +Gender | +Ethn. | +Height +Arm +Butt. |
+Height +Arm +Thigh |
+Height +Arm +Waist |
|||
| Anthropom. | Parameter | Height | 7.07 | – | 5.88 | 6.75 | 5.72 | 5.35 | 7.02 | 7.10 | |||
| Butt. | 7.14 | 5.88 | – | 7.02 | 6.95 | 6.52 | 5.63 | 7.00 | – | 3.60 | 3.00 | ||
| Thigh | 6.06 | 6.75 | 7.02 | – | 5.94 | 6.58 | 6.05 | 6.06 | 3.60 | – | 2.97 | ||
| Waist | 7.16 | 5.72 | 6.95 | 5.94 | – | 5.86 | 7.08 | 7.15 | 3.00 | 2.97 | – | ||
| Arm | 7.10 | 5.35 | 6.52 | 6.58 | 5.86 | – | 6.62 | 6.91 | |||||
| Neural Network Regression | |||||||||||||
| Two Param. | Four Param. + Gender + Ethn. | ||||||||||||
| One Param. | +Height | +Butt. | +Thigh | +Waist | +Arm | +Gender | +Ethn. | +Height +Arm +Butt. |
+Height +Arm +Thigh |
+Height +Arm +Waist |
|||
| Anthropom. | Parameter | Height | 7.11 | – | 5.81 | 6.68 | 5.77 | 5.37 | 7.11 | 7.08 | |||
| Butt. | 7.42 | 5.81 | – | 7.13 | 6.83 | 6.46 | 5.64 | 7.41 | – | 3.71 | 3.14 | ||
| Thigh | 5.99 | 6.68 | 7.13 | – | 5.93 | 6.62 | 5.98 | 5.99 | 3.71 | – | 3.00 | ||
| Waist | 7.50 | 5.77 | 6.83 | 5.93 | – | 5.83 | 7.18 | 7.31 | 3.14 | 3.04 | – | ||
| Arm | 7.03 | 5.37 | 6.46 | 6.62 | 5.83 | – | 6.65 | 6.94 | |||||
The ML regressions performance is better than conventional regression, for all possible combinations. RMSE values for the predicted weight obtained from SVR and GPR are similars (difference in the third decimal place); however, the accuracy in terms of CI is subtly better for GPR.
B. Predicted Height
The correlation between predicted and measured height is analyzed for individual or different combinations of anthropometric parameter inputs, parameters with more correlation with body’s height have been selected for the analysis.
Thus, the anthropometric parameters entries are Knee-height, Gender, Ethnicity, functional-Leg and Forearm-hand lengths, as well as, Wrist and Sitting heights. The Height prediction performance values (RMSE in centimeters) of the explored models are summarized in Table 2. Similarly to the weight prediction case, the performance of the ML regressions is better than conventional regression, for all possible combinations.
TABLE 2. Height Prediction Performance (RMSE in Centimeters) of Linear, Support Vector, Gaussian Process, and Neural Network Regressions; for 4261 Adult Subjects (NHANES III). The Anthropometric Parameters Input are Knee Height (Knee), Gender, Ethnicity (Ethn.), Functional Leg (Leg) and Forearm (Arm) Lengths, as Well as, Wrist (Wrist) and Sitting (Sit) Heights.
| Linear Regression | |||||||||||||
|---|---|---|---|---|---|---|---|---|---|---|---|---|---|
| Two Param. | Four Param. + Gender + Ethn. | ||||||||||||
| One Param. | +Knee | +Leg | +Arm | +Wrist | +Sit. | +Gender | +Ethn. | +Knee +Leg +Arm |
+Knee +Leg +Wrist |
+Knee +Leg +Wrist |
|||
| Anthropom. | Parameter | Knee | 4.85 | – | 4.57 | 4.61 | 4.60 | 2.43 | 4.61 | 4.08 | |||
| Leg | 7.10 | 4.57 | – | 5.48 | 5.77 | 3.58 | 4.75 | 7.06 | |||||
| Arm | 6.29 | 4.61 | 5.48 | – | 5.67 | 3.55 | 5.42 | 6.24 | – | 4.03 | 2.20 | ||
| Wrist | 7.01 | 4.60 | 5.77 | 5.67 | – | 4.00 | 6.43 | 6.89 | 3.93 | – | 2.20 | ||
| Sit. | 4.45 | 2.43 | 3.58 | 3.55 | 4.00 | – | 4.18 | 4.43 | 2.17 | 2.20 | – | ||
| Support Vector Regression/Gaussian Process Regression | |||||||||||||
| Two Param. | Four Param. + Gender + Ethn. | ||||||||||||
| One Param. | +Knee | +Leg | +Arm | +Wrist | +Sit. | +Gender | +Ethn. | +Knee +Leg +Arm |
+Knee +Leg +Wrist |
+Knee +Leg +Wrist |
|||
| Anthropom. | Parameter | Knee | 4.05 | – | 3.86 | 3.83 | 3.90 | 2.12 | 3.62 | 4.01 | |||
| Leg | 5.18 | 3.86 | – | 4.58 | 4.59 | 3.29 | 4.65 | 5.12 | |||||
| Arm | 4.94 | 3.83 | 4.58 | – | 4.53 | 3.26 | 4.48 | 4.80 | – | 3.34 | 1.89 | ||
| Wrist | 4.86 | 3.90 | 4.59 | 4.53 | – | 3.36 | 4.80 | 4.93 | 3.26 | – | 1.86 | ||
| Sit. | 3.98 | 2.12 | 3.29 | 3.26 | 3.36 | – | 3.77 | 3.64 | 1.86 | 1.86 | – | ||
| Neural Network Regression | |||||||||||||
| Two Param. | Four Param. + Gender + Ethn. | ||||||||||||
| One Param. | +Knee | +Leg | +Arm | +Wrist | +Sit. | +Gender | +Ethn. | +Knee +Leg +Arm |
+Knee +Leg +Wrist |
+Knee +Leg +Wrist |
|||
| Anthropom. | Parameter | Knee | 4.03 | – | 3.83 | 3.84 | 3.80 | 2.11 | 3.69 | 4.08 | |||
| Leg | 4.89 | 3.83 | – | 4.51 | 4.57 | 3.29 | 4.62 | 5.03 | |||||
| Arm | 4.80 | 3.83 | 4.51 | – | 4.56 | 3.29 | 4.40 | 4.62 | – | 3.44 | 1.96 | ||
| Wrist | 4.88 | 3.80 | 4.57 | 4.56 | – | 3.39 | 4.88 | 4.87 | 3.42 | – | 1.91 | ||
| Sit. | 3.93 | 2.11 | 3.29 | 3.29 | 3.39 | – | 3.76 | 3.65 | 1.91 | 1.94 | – | ||
A CI of 94% with limits of 11.2cm and 13.5cm is obtained with conventional regression models, whereas, a CI of 95% with limits of 6.7cm and 9.0cm, is achieved with GPR.
For comparison purposes, the Weight and Height prediction performance (RMSE and R-square values) obtained with the proposed model, as well as, the most representative values previously reported in the literature are summarized in Table 3. Our model reaches an RMSE value of 2.11 and an R-Squared of 0.84, for Weight and Height predictions, respectively. Therefore, for both predictions, the GPR method has a better performance than the linear methods.
TABLE 3. Height and Weight Predictions Performance From Anthropometric Measurements.
| Author, year | n | Age (years) | Gender | Regression | Predictor variable | RMSE | |
|---|---|---|---|---|---|---|---|
| Height | Chumlea et al, [7] | 4.750 | Over 60 | Men/Women* | Linear | Sitting height, Age | 3.25 |
| Cereda et al., [35] | 635 | 30–55 | Men/Women* | Linear | Knee height, Tibia length, body composition | 2.2 ** / 4.4*** | |
| Proposed Model | 4.261 | Over 21 | Men/Women | Gaussian Process | Sitting height | 2.11 | |
| Weight | Author, year | n | Age (years) | Gender | Regression | Predictor variable | R-Squared |
| Lin, et al. [36] | 235 | Over 18 | Men/Women* | Linear | Knee height, Mid Arm circumference | 0.69 | |
| Proposed Model | 4.261 | Over 21 | Men/Women | Gaussian Process | Knee height, Mid Arm circumference, Stature | 0.84 |
separated groups,
men,
women)
C. Gender and Ethnicity Parameters
It is well-known that anthropometric correlation values are different for male and female subjects, such that weight and height estimation equations have different coefficients for each gender. Furthermore, different equations have been reported for groups in various continents [5], [6]. In our analysis, all subjects are analyzed together, and Gender and Ethnicity are input parameters of the ML regressions.
1). Gender Analysis
As can be observed in Tables 1 and 2, weight and height estimations are more accurate if the Gender parameter (1 for male and 0 for female subjects) is considered. For example, in the case that Buttock circumference is the only one input, the weight prediction SVR model has an RMSE of 7.14kg. However, if the Gender parameter is a second input, the RMSE is reduced to 5.88kg.
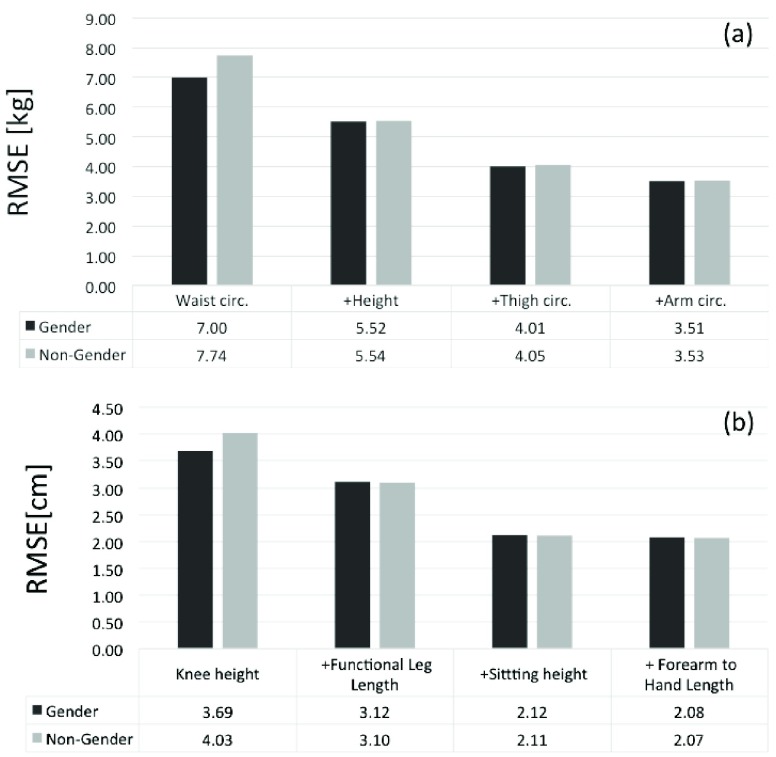
Moreover, if more than two parameters are analyzed (e.g. Buttock and Waist circumferences), the prediction is not more sensitive to Gender, as shown in Figure 6.
FIGURE 6.
RMSE values for weight (a) and height prediction (b) for Male and Female groups analyzed jointly using a GPR, where Gender and Non-Gender means using or not the Gender as input parameter, respectively. Group of 14783 adult subjects from NHANES III.
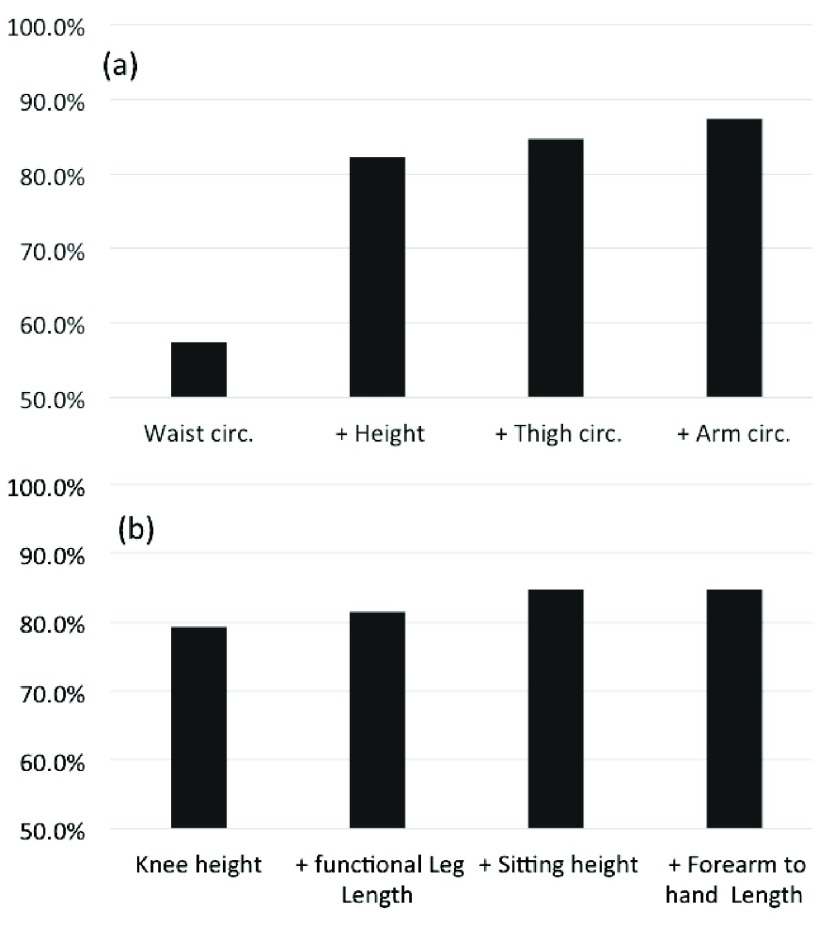
The effect can be explained by the property of the ML regression to identify the subject Gender. To test our hypothesis, a Support Vector Machine (SVM) is explored as a binary classifier to determine the subject Gender, using the same input parameters employed in the SVR. As can be seen in Figure 7, considering two input parameters, the SVM classifier has a true success rate (TSR) of 80% to classify the subjects Gender; exploring more than two parameters, the TRS reach values next to 90%.
FIGURE 7.
True success rate of a support vector machine to classify gender, parameters explored for weight (a) and height (b) estimations. Group of 14783 adult subjects from NHANES III.
Therefore, the Gender parameter plays an important role in the prediction if just one anthropometric parameter is explored as an input parameter, but it is redundant in the case that more than two parameters are analyzed by the ML regression.
2). Ethnicity Non-Sensitive
As aforementioned, the NHANES III database is composed of three ethnic groups [26]. Therefore in our analysis, the parameters are established as non-Hispanic white (1), non-Hispanic Black (2), and Mexican-American (3) parameters.
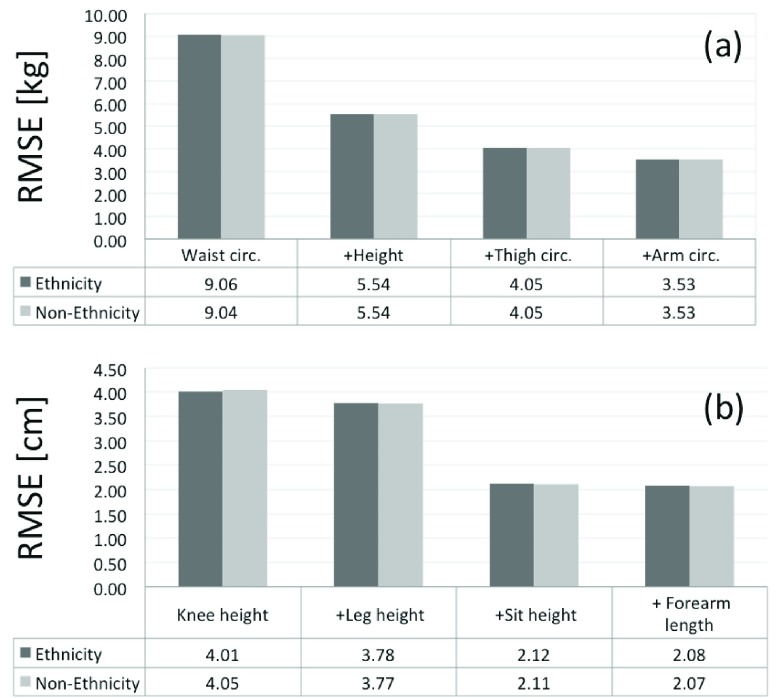
The prediction performance has not an important dependence with Ethnicity, which RMSE values are similar in the cases of the Ethnicity parameter is considered or not, as represented in Figure 8 and summarized in Table 1 and 2. The same non-Sensitivity to Ethnicity is found for the ANSUR database.
FIGURE 8.
RMSE values for weight (a) and height prediction (b), where Ethnicity and Non-Ethnicity means using or not the Ethnicity as input parameter, respectively. Group of 14783 adult subjects from NHANES III.
On the other hand, analogously to the Gender classification, an SVM was explored unsuccessfully to classify the Ethnicity of the subjects (TSR next to 50%).
3). Cross-Validation Databases
Cross-validation tests between the NHANES III and the ANSUR databases test have been implemented. As summarized in Table 4, RMSE values achieved with both Inter- and Intra- database analysis are quite similar, proving the generalization of the ML regression model.
TABLE 4. Cross-Validation Between the NHANESIII and ANSUR Databases.
| Training Database | Test Database | RMSE (kg) |
|---|---|---|
| NHANES III | NHANES III | 2.97 |
| NHANES III | ANSUR | 2.99 |
| ANSUR | ANSUR | 2.89 |
| ANSUR | NHANES III | 2.97 |
IV. Estimating Weight for a Subject Without Mobility
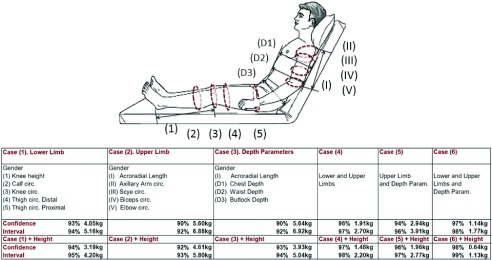
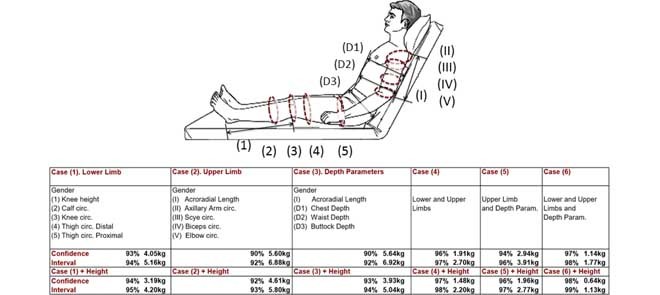
In this numeral, groups of anthropometric measurements are proposed to estimate weight based on anatomical regions exploring a Gaussian Process Regression. Therefore, the healthcare professional has different options to collect circumferences and member lengths; that can be measured comfortably for patients without or partial mobility. The group of measurements are organized as follow:
-
•
Case 1. Lower Limb: Knee-height, and Calf, Knee, Thigh Distal, Thigh Proximal circumferences;
-
•
Case 2. Upper Limb: Acroradial-Length, and Axillary arm, Scye, Biceps flexed, Elbow circumferences;
-
•
Case 3. Depth parameters: Acroradial-Length, and Chest, Waist and Buttock depths;
-
•
Case 4. Lower and Upper Limb;
-
•
Case 5. Limbs and Depth parameters.
Weight estimations are based on the ANSUR database, which contains anthropometric parameters such as Calf, Axillary Arm, and Biceps circumferences, as well as, Chest, Waist and Buttock depth. Male and Females groups are analyzed jointly, and Gender is an input parameter.
It is important to note that the ANSUR anthropometric measurements were obtained in a stand-up or sitting positions. Consequently, the values are subtly different of the obtained from a patient placed in a Recumbent or Fowler positions.
As represented in Figure 9, the weight prediction from the Lower limb has the best performance, with a CI of 94% and limits between 4.05 and 5.16kg. If the patients’ height is a known parameter, the CI reaches values close to 95% and limits between 3.19 and 4.20kg.
FIGURE 9.
Weight estimation from Lower and Upper limb, and Depth anthropometric parameters, that can be measured comfortably for patients without or partial mobility. Analysis based on the ANSUR database (3997 subjects).
In case that is possible to measure both limbs (lower and upper), the CI obtained is 97% with limits between 2.94 and 3.91kg. Furthermore, if Depth parameters can be measured as well, the prediction reach the best accuracy value with a CI of 98% and limits between 1.14 and 1.77kg, and 99% with limits between 0.64kg and 1.13kg if the Height subject is known.
V. Conclusion
Weight and Height prediction performance from anthropometric measurements obtained with Machine Learning regression models is better than the achieved with conventional statistical regressions.
In particular, the non-sparse kernel machine (Gaussian Process Regression) shows the best performance. Despite having a more expensive computational cost, the Gaussian Process Regression has the ability to choose the kernel hyper parameters directly from the training data what makes it a more flexible model with fewer setup requirements.
Besides, we believe that the non-sparsity of the Gaussian Process Regression enabled the usage of important information that might be discarded in the SVM through the assignment of zero weight for some inputs.
Weight and Height can be predicted for Female and Male subjects with the same ML regression, where Gender is one input parameter. On the other hand, the Weight and Height predictions obtained with ML regressions have not a dependence with ethnicity for both populations analyzed.
According to the Cross-validation database analysis, the ML models are robust and general for analysis of different populations. Trained models obtained with ML regressions can be embedded in applications software to run on mobile devices and smartphones, opening new opportunities for anthropometric applications in industry, textile technology, security, and health-care.
Funding Statement
This work was supported by the Brazilian agencies, the Conselho Nacional de Desenvolvimento Científico e Tecnológico and the Fundação de Amparo à Ciência e Tecnologia do Estado de Pernambuco.
References
- [1].World Health Organization and others, “Physical status: The use and interpretation of anthropometry. Geneva; 1995,” WHO Tech. Rep. Ser., vol. 854, pp. 2009–2006, 2011. [PubMed] [Google Scholar]
- [2].Bloomfield R., Steel E., MacLennan G., and Noble D. W., “Accuracy of weight and height estimation in an intensive care unit: Implications for clinical practice and research,” Critical Care Med., vol. 34, no. 8, pp. 2153–2157, 2006. [DOI] [PubMed] [Google Scholar]
- [3].Anglemyer B. L., Hernandez C., Brice J. H., and Zou B., “The accuracy of visual estimation of body weight in the ED,” Amer. J. Emergency Med., vol. 22, no. 7, pp. 526–529, Nov. 2004. [DOI] [PubMed] [Google Scholar]
- [4].Michels K. B., Greenland S., and Rosner B. A., “Does body mass index adequately capture the relation of body composition and body size to health outcomes?” Amer. J. Epidemiol., vol. 147, no. 2, pp. 167–172, 1998. [DOI] [PubMed] [Google Scholar]
- [5].Chumlea W. C., Guo S., Roche A. F., and Steinbaugh M. L., “Prediction of body weight for the nonambulatory elderly from anthropometry,” J. Amer. Dietetic Assoc., vol. 88, no. 5, pp. 564–568, 1988. [PubMed] [Google Scholar]
- [6].Chumlea W. C. and Guo S., “Equations for predicting stature in white and black elderly individuals,” J. Gerontol., vol. 47, no. 6, pp. M197–M203, 1992. [DOI] [PubMed] [Google Scholar]
- [7].Chumlea W. M. C., Guo S. S., and Steinbaugh M. L., “Prediction of stature from knee height for black and white adults and children with application to mobility-impaired or handicapped persons,” J. Amer. Dietetic Assoc., vol. 94, no. 12, pp. 1385–1391, 1994. [DOI] [PubMed] [Google Scholar]
- [8].Prothro J. W. and Rosenbloom C. A., “Physical measurements in an elderly black population: Knee height as the dominant indicator of stature,” J. Gerontol., vol. 48, no. 1, pp. M15–M18, 1993. [DOI] [PubMed] [Google Scholar]
- [9].Gauld L. M., Kappers J., Carlin J. B., and Robertson C. F., “Height prediction from ulna length,” Develop. Med. Child Neurol., vol. 46, no. 7, pp. 475–480, 2004. [DOI] [PubMed] [Google Scholar]
- [10].Mitchell C. O. and Lipschitz D. A., “Arm length measurement as an alternative to height in nutritional assessment of the elderly,” J. Parenteral Enteral Nutrition, vol. 6, no. 3, pp. 226–229, 1982. [DOI] [PubMed] [Google Scholar]
- [11].Kuiti B. and Bose K., “Predictive equations for height estimation using knee height of older Bengalees of Purba Medinipur, West Bengal, India,” Anthropol. Rev., vol. 79, no. 1, pp. 47–57, 2016. [Google Scholar]
- [12].Hogan S. E., “Knee height as a predictor of recumbent length for individuals with mobility-impaired cerebral palsy,” J. Amer. College Nutrition, vol. 18, no. 2, pp. 201–205, 1999. [DOI] [PubMed] [Google Scholar]
- [13].Freedman D. A., Statistical Models: Theory and Practice. Cambridge, U.K.: Cambridge Univ. Press, 2009. [Google Scholar]
- [14].Friedman J. H., “Data mining and statistics: What is the connection?” Comput. Sci. Statist., vol. 29, no. 1, pp. 3–9, 1998. [Google Scholar]
- [15].Grassi M. C., Caricati A. M., Intraligi M., Buscema M., and Nencini P., “Artificial neural network assessment of substitutive pharmacological treatments in hospitalised intravenous drug users,” Artif. Intell. Med., vol. 24, no. 1, pp. 37–49, Jan. 2002. [DOI] [PubMed] [Google Scholar]
- [16].Lisboa P. J. and Taktak A. F. G., “The use of artificial neural networks in decision support in cancer: A systematic review,” Neural Netw., vol. 19, no. 4, pp. 408–415, May 2006. [DOI] [PubMed] [Google Scholar]
- [17].Bishop C. M., Pattern Recognition and Machine Learning. New York, NY, USA: Springer-Verlag; 2016. [Google Scholar]
- [18].Vapnik V., The Nature of Statistical Learning Theory. New York, NY, USA: Springer, 2013. [Google Scholar]
- [19].Shepherd T. and Owenius R., “Gaussian process models of dynamic PET for functional volume definition in radiation oncology,” IEEE Trans. Med. Imag., vol. 31, no. 8, pp. 1542–1556, Aug. 2012. [DOI] [PubMed] [Google Scholar]
- [20].Yun Y., H.-Kim C., Shin S. Y., Lee J., Deshpande A. D., and Kim C., “Statistical method for prediction of gait kinematics with Gaussian process regression,” J. Biomech., vol. 47, no. 1, pp. 186–192, Jan. 2014. [DOI] [PubMed] [Google Scholar]
- [21].Javed F.et al. , “RBF kernel based support vector regression to estimate the blood volume and heart rate responses during hemodialysis,” in Proc. Annu. Int. Conf. IEEE Eng. Med. Biol. Soc. (EMBC), Sep. 2009, pp. 4352–4355. [DOI] [PubMed] [Google Scholar]
- [22].Schölkopf B., Burges C. J. C., and Smola A. J., Advances in Kernel Methods—Support Vector Learning. Cambridge, MA, USA: MIT Press, 1999. [Google Scholar]
- [23].Shawe-Taylor J. and Sun S., “Kernel methods and support vector machines,” in Academic Press Library in Signal Processing, vol. 1 New York, NY, USA: Elsevier, 2014. pp. 857–881. [Google Scholar]
- [24].Hofmann T., Schölkopf B., and Smola A. J., “Kernel methods in machine learning,” Ann. Statist., vol. 36, no. 3, pp. 1171–1220, 2008. [Google Scholar]
- [25].Shawe-Taylor J. and Cristianini N., Kernel Methods for Pattern Analysis. Cambridge, U.K.: Cambridge Univ. Press, 2004. [Google Scholar]
- [26].Third National Health and Nutrition Examination Survey, 1988–1994, NHANES III, Nat. Center Health Statist, Hyattsville, MD, USA, 1996. [Google Scholar]
- [27].Gordon C. C., Churchill T., Clauser C. E., Bradtmiller B., and McConville J. T., “Anthropometric survey of us army personnel: Methods and summary statistics 1988,” DTIC Document, U.S. Army Natick Soldier Res., Develop. Eng. Center Natick, Natick, MA, USA, Tech. Rep., 1989. [Google Scholar]
- [28].Kuhn M. and Johnson K., Applied Predictive Modeling. New York, NY, USA: Springer, 2013. [Google Scholar]
- [29].Yan F., Kittler J., Mikolajczyk K., and Tahir A., “Non-sparse multiple kernel Fisher discriminant analysis,” J. Mach. Learn. Res., vol. 13, no. 1, pp. 607–642, Mar. 2012. [Google Scholar]
- [30].Chapelle O., Vapnik V., Bousquet O., and Mukherjee S., “Choosing multiple parameters for support vector machines,” Mach. Learn., vol. 46, nos. 1–3, pp. 131–159, 2002. [Google Scholar]
- [31].Rasmussen C. E., Gaussian Processes for Machine Learning. Cambridge, MA, USA: MIT Press, 2006. [Google Scholar]
- [32].Seeger M., “Gaussian processes for machine learning,” Int. J. Neural Syst., vol. 14, no. 2, pp. 69–106, 2004. [DOI] [PubMed] [Google Scholar]
- [33].Ripley B. D., Pattern Recognition and Neural Networks. Cambridge, U.K.: Cambridge Univ. Press, 2007. [Google Scholar]
- [34].Chai T. and Draxler R. R., “Root mean square error (RMSE) or mean absolute error (MAE)?—Arguments against avoiding RMSE in the literature,” Geosci. Model Develop., vol. 7, no. 3, pp. 1247–1250, 2014. [Google Scholar]
- [35].Cereda E., Bertoli S., and Battezzati A., “Height prediction formula for middle-aged (30–55 y) Caucasians,” Nutrition, vol. 26, nos. 11–12, pp. 1075–1081, Nov-Dec 2010. [DOI] [PubMed] [Google Scholar]
- [36].Lin B. W., Yoshida D., Quinn J., and Strehlow M., “A better way to estimate adult patients’ weights,” Amer. J. Emergency Med., vol. 27, no. 9, pp. 1060–1064, 2009. [DOI] [PubMed] [Google Scholar]


