

Abstract
Organellar two-pore channels (TPCs) function as a homodimer with each subunit containing two homologous Shaker-like 6-TM repeats1. They belong to the voltage-gated ion channel superfamily2 and are ubiquitously expressed in animals and plants3,4. Mammalian TPC1 and TPC2 are localized to the endolysosomal membrane and play critical roles in regulating the physiological functions of these acidic organelles5–7. Here we present the cryo-EM structures of mouse TPC1 (MmTPC1), a voltage-dependent, phosphatidylinositol 3,5-bisphosphate (PtdIns(3,5)P2) activated Na+ selective channel, in both the apo closed and ligand-bound open states which, combined with functional analysis, provide comprehensive structural insights into the selectivity and gating mechanisms of mammalian TPC channels. The channel has a coin slot-shaped ion pathway in the filter that defines the selectivity of mammalian TPCs. Only the voltage sensing domain from the second 6-TM domain confers voltage dependence to MmTPC1. Endolysosome-specific PtdIns(3,5)P2 binds to the first 6-TM domain and activates the channel under depolarizing membrane potential. Structural comparison between the apo and PtdIns(3,5)P2-bound structures elucidates the interplay between voltage and ligand in channel activation. In light of the emerging importance of phosphoinositide regulation of ion channels, the MmTPC1 structures exemplify the lipid binding and regulation in a 6-TM voltage-gated channel.
TPC1 and TPC2 represent two major subfamilies of mammalian TPC channels and their functions are associated with various physiological processes, including hair pigmentation8-10, autophagy regulation11,12, blood vessel formation13, acrosome reaction in sperm14, mTOR-dependent nutrient sensing15, lipid metabolism16 and Ebola virus infection17, to name a few. Mammalian TPCs were initially suggested to mediate nicotinic acid adenine dinucleotide phosphate (NAADP)-dependent calcium release from endolysosome18–20. However, several recent studies demonstrated that mammalian TPCs are sodium-selective channels activated by endolysosome-specific PtdIns(3,5)P2 rather than NAADP15,21. Dual regulation of TPC2 by both PtdIns(3,5)P2 and NAADP were also reported22. Distinct from TPC2, mammalian TPC1 activation is voltage-dependent, conferring electrical excitability to endolysosome23,24. The atomic structure of a plant TPC1 from Arabidopsis thaliana (AtTPC1) was determined recently by X-ray crystallography, revealing the overall architecture of the TPC family25,26. However, mammalian TPCs share low sequence identity to their plant counterpart (Extended Data Fig. 1) and exhibit different gating and selectivity properties. Here we present the structural and functional analysis of mouse TPC1 (MmTPC1).
When over-expressed in HEK293 cells, some MmTPC1 channels are trafficked to the plasma membrane, allowing us to directly measure channel activity by patching the plasma membrane (Methods and Extended Data Fig. 2). In brief, MmTPC1 activation requires both membrane depolarization and the PtdIns(3,5)P2 ligand (Extended Data Fig. 2b–c). The voltage activation of MmTPC1 is modulated by endolysosome luminal pH23 and lower pH shifts voltage activation towards a more positive potential (Extended Data Fig. 2d–e). In our recordings, MmTPC1 exhibits higher Na+ selective as compared to K+ and Ca2+ (Extended Data Fig. 2f–g), different from non-selective plant TPC127,28.
MmTPC1 structures were determined in the presence and absence of PtdIns(3,5)P2 to a resolution of 3.2 and 3.4 Å, respectively, using single particle electron cryo-microscopy (cryo-EM) (Fig. 1, Extended Data Fig. 3–4 and Extended Data Table 1). The cryo-EM density maps of both structures are of sufficient quality for de novo model building of major parts of the protein (Extended Data Fig. 5). The higher resolution PtdIns(3,5)P2-bound structure will be used for the initial description of the overall structural features. Similar to AtTPC1, each MmTPC1 subunit contains two homologous six-transmembrane domains (6-TM I and 6-TM II) and two subunits assemble into a rectangle-shaped functional channel equivalent to a tetrameric Shaker-like channel (Fig. 1a–b, and Extended Data Fig. 6). Following the same nomenclature as other voltage-gated channels, we labeled the six transmembrane helices within each 6-TM domain as IS1-S6 and IIS1-S6, respectively (Fig. 1c). The transmembrane region of MmTPC1 is domain swapped with the S1-S4 voltage-sensing domain (VSD) from one 6-TM interacting with the S5-S6 pore domain from the neighboring 6-TM (Fig. 1b). The pore domain of the second 6-TM contains a luminal loop between IIS5 and pore helix 1 (IIP1) that forms an upright antenna-like β-hairpin; Asn600 and Asn612 on this luminal loop are glycosylated with visible density for the covalently linked N-acetylglucosamine moiety of the sugar29 (Fig. 1b and 1e, and Extended Data Fig. 5c).
Figure 1. Overall structure of MmTPC1.
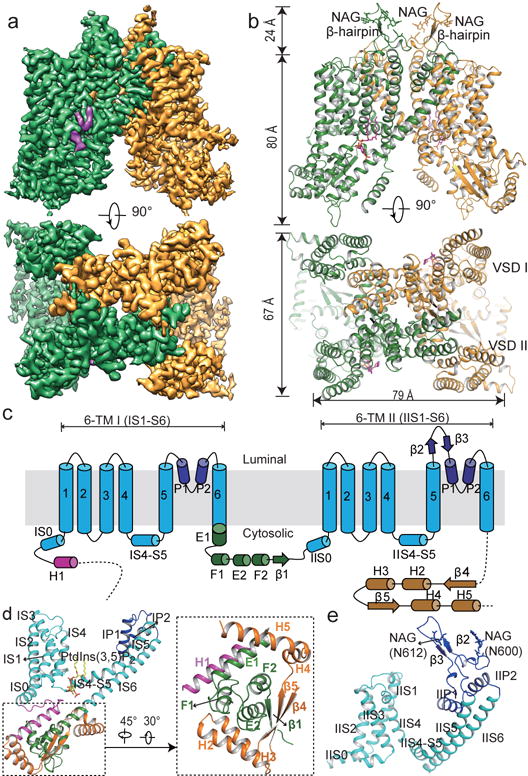
a, 3D reconstruction of PtdIns(3,5)P2-bound (purple density) MmTPC1 dimer with each subunit in individual color. b, Cartoon representation of MmTPC1 in the same orientations as the EM maps in a. N-acetylglucosamine (NAG) molecules and PtdIns(3,5)P2 are shown as sticks. c, Topology and domain arrangement of MmTPC1 subunit. d, Structure of the 6-TM I and the soluble domain with individual element colored as that in c. Inset: zoomed-in view of the cytosolic soluble domain. e, Structure of the 6-TM II.
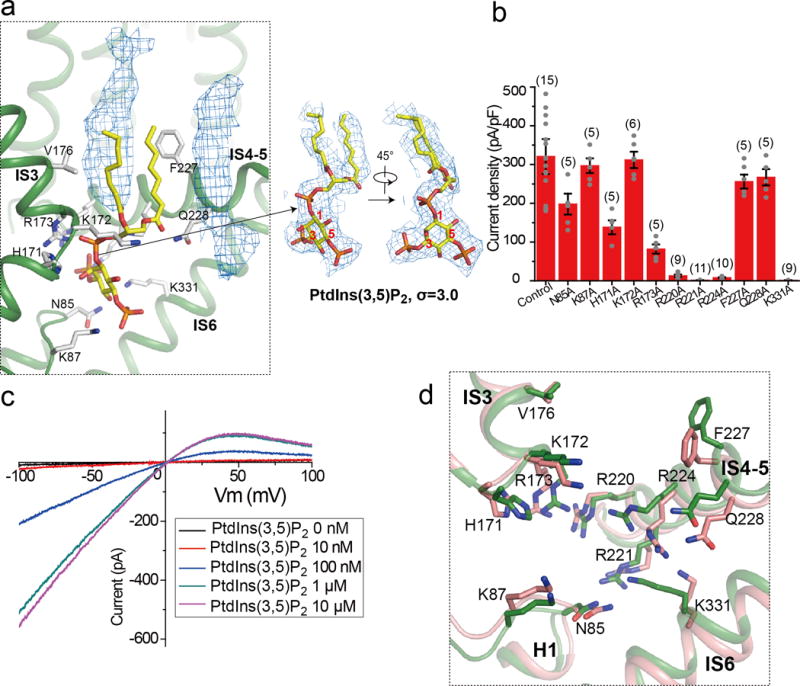
Figure 4. PtdIns(3,5)P2 binding in MmTPC1.
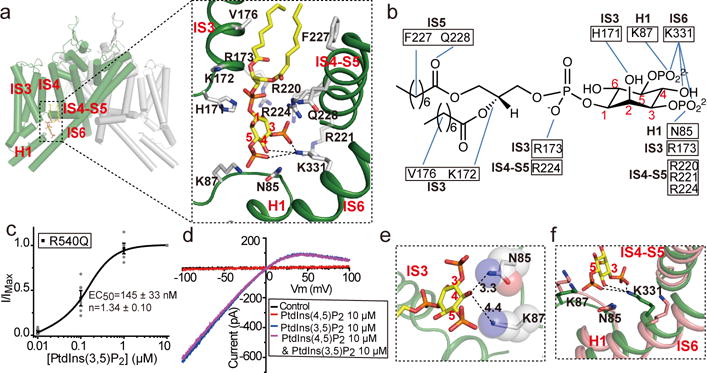
a, PtdIns(3,5)P2 binding in 6-TM I of MmTPC1. Inset: zoomed-in view of the PtdIns(3,5)P2 site. b, Schematic diagram of the protein-ligand interactions. c, Concentration dependent PtdIns(3,5)P2 activation of Arg540Gln mutant at −100 mV. Curve is least square fit to the Hill equation. Data points are mean ± SEM (n=5 independent experiments). Sample I–V curves are shown in Extended Data Fig. 9c. d, Ligand specificity of MmTPC1 measured using Arg540Gln mutant. Sample I–V curves were recorded on the same patch with different PtdInsP2 isoforms. The experiments were repeated five times independently with similar results. e, Close proximity between the C4 hydroxyl of PtdIns(3,5)P2 and the surrounding residues. f, Structural comparison at the region around Lys331 between the apo (green) and PtdIns(3,5)P2-bound MmTPC1 (salmon).
Multiple cytosolic components within each TPC1 subunit, including the N-terminal H1 helix, the linker between the two 6-TMs and the C-terminal post-IIS6 region, assemble into a tightly-packed cytosolic domain (Fig. 1d). Despite low sequence homology, the linker between the two 6-TMs adopts the EF-hand domain structure with two EF-hand motifs (EF-1 and EF-2) similar to plant TPC1 and the C-terminal portion of the exceptionally long IS6 serves as the E1 helix (Fig. 1d and Extended Data Fig. 6d). Ca2+ is unlikely to bind to the EF motifs of MmTPC1 as they lack the essential Ca2+-chelating acidic residues (Extended Data Fig. 1). The N-terminal H1 helix is tightly packed with the EF-1 motif and becomes an integral part of the EF-hand domain (Fig. 1d). Different from plant TPC1 as well as mammalian TPC2, MmTPC1 has a much longer C-terminal region, which adopts a horseshoe-shaped structure with four α-helices and two β-strands and tightly wraps around the EF-hand domain (Fig. 1d and Extended Data Fig. 1 and 6d).
The MmTPC1 ion conduction pore, consisting of S5, S6 and two pore helices, adopts a closed conformation in the apo structure and an open conformation in the PtdIns(3,5)P2-bound structure (Fig. 2a–d). In the apo structure, the four pore-lining S6 helices form a bundle-crossing at the cytosolic side with two layers of hydrophobic residues, L317s and F321s from the IS6 helices and Val684s and L688s from the IIS6 helices, forming the constriction points that prevent the passage of hydrated cations (Fig. 2b–c). In the PtdIns(3,5)P2-bound state, the S6 helices undergo outward movement along with rotational motion (Fig. 2d). Consequently, the constriction-forming residues dilate and rotate away from the central axis, resulting in a much wider opening at the intracellular gate (Fig. 2b–d). In addition, the side chains of four acidic residues (Asp322s from IS6s and Glu689s from IIS6s), that point tangentially to the pore in the closed structure, undergo inward rotation and face the ion conduction pathway in the open state (Fig. 2b–d), generating a ring of negative charges at the gate that could facilitate channel conductance. The molecular mechanism of PtdIns(3,5)P2 induced channel opening will be discussed later.
Figure 2. Ion conduction pore of MmTPC1.
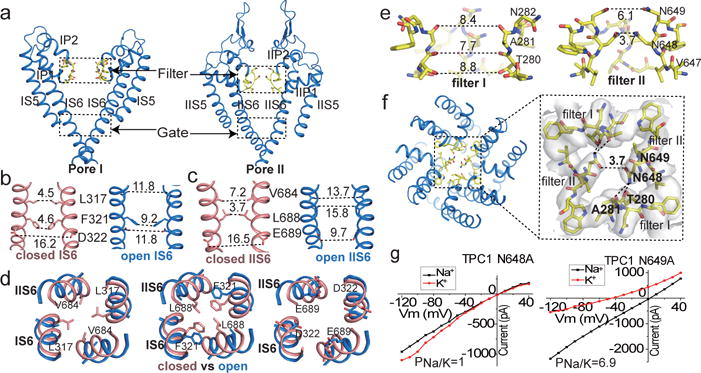
a, Ion conduction pore comprising IS5-S6 (pore 1) and IIS5-S6 (pore 2). b and c, Side view of the bundle crossing formed by IS6 (b) and IIS6 (c) in the apo closed (salmon) and PtdIns(3,5)P2-bound open (blue) states. Numbers are cross distances (in Å) at the constriction points. d, Structural comparison of the cytosolic gate between the closed and open states viewed from the cytosolic side in three sections: L317/V684 (left), F321/L688 (middle) and D322/E689 (right). e, Side view of the selectivity filter formed by filter I and filter II with the front subunit removed for clarity. f, Top view of the selectivity filter. Inset: zoomed-in view of the filter with the stabilization H-bonds for N648 (dotted line) and EM-density (grey) shown. g, Sample I–V curves of the filter mutations recorded with high Na+ or K+ in the bath solution. Original traces are shown in Extended Data Fig. 7. The experiments were repeated five times independently with similar results.
The selectivity filter region remains identical in both structures. Two sets of filter residues, 280Thr-Ala-Asn (filter I) in 6-TM I and 647Val-Asn-Asn (filter II) in 6-TM II, enclose the central ion pathway with different dimensions (Fig. 2e–f). Filter I residues line the pathway with predominantly main-chain backbone carbonyls and have atom-to-atom cross distances of about 8 Å (Fig. 2e). Filter II residues utilize side chains to generate a much narrower pathway with two constriction points formed by Asn648s and Asn649s (Fig. 2e). Positioned at the center of the filter and stabilized by hydrogen bonding interactions with the filter I backbone carbonyls of Thr280 and Ala281, the Asn648 side chain forms the narrowest point along the filter pathway with a cross distance of about 3.7 Å and plays the central role in defining Na+ selectivity of MmTPC1 (Fig. 2e-f). Asn648Ala mutation results in a complete loss of Na+ selectivity (Fig. 2g and Extended Data Fig. 7). Asn649s are positioned at the luminal entrance of the channel with wider distance and Asn649Ala mutation reduces but does not abolish Na+ selectivity (Fig. 2g and Extended Data Fig. 7). With an elongated coin slot-like ion pathway at the filter Na+ ions likely pass through the MmTPC1 filter in a partially hydrated form. The two Asn648 side chains are positioned to provide optimal coordination to stabilize the permeating Na+ ion, but too close for K+. Thus Asn648 forms a simple size sieve to exclude K+ or larger ions.
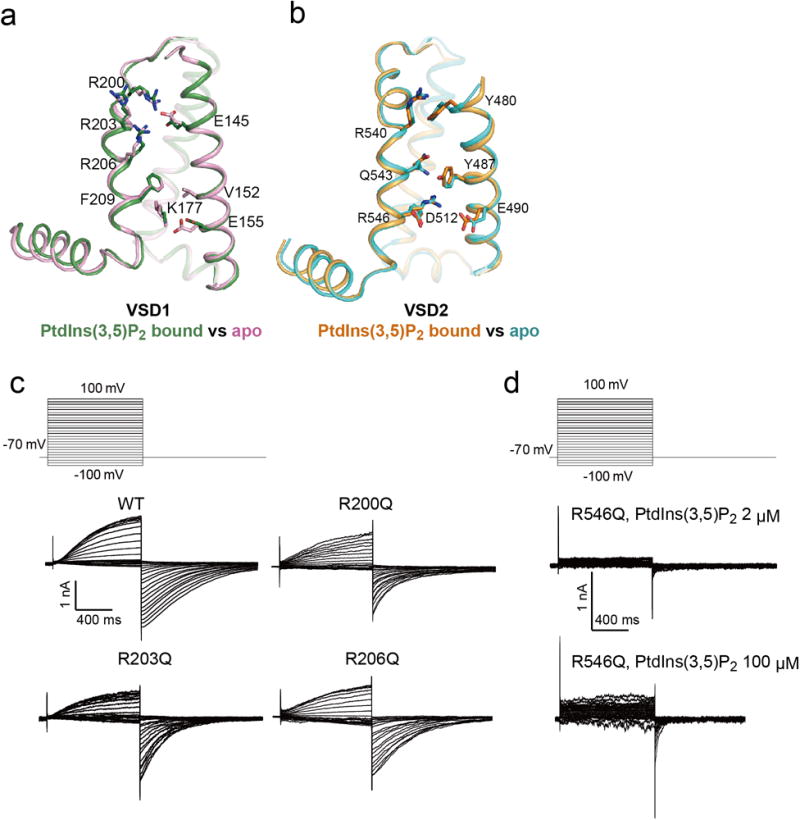
The two voltage sensing domains (VSD1 and VSD2) have virtually the same structures as their respective counterparts between the apo and ligand-bound states and, therefore, the higher resolution PtdIns(3,5)P2-bound structure will be used in the discussion (Extended Data Fig. 8a–b). Fig. 3a provides the numbering of the S4 gating charge residues from TPCs and other canonical voltage-gated channels for comparison. Although the VSD1 contains three arginine residues (Arg200, Arg203 and Arg206) in IS4 at positions R2-R4 (Fig. 3b), it lacks some key features of canonical voltage sensors (see legends of Extended Data Fig. 8a) and does not contribute to the voltage-dependent gating similar to that of plant TPC125, as replacing these arginines individually with a neutral residue does not affect the voltage activation of MmTPC1 (Fig. 3c and Extended Data Fig. 8c).
Figure 3. The voltage-sensing domains.
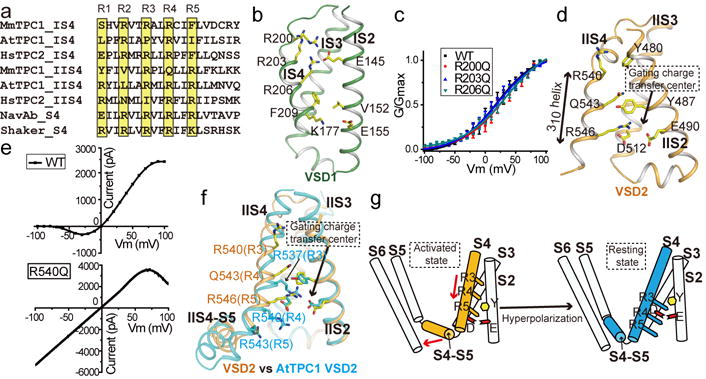
a, Partial S4 sequence alignment and arginine registry. b, Side view of VSD1 with IS1 omitted for clarity. c, G/Gmax-V curves of wild-type MmTPC1 and IS4 arginine mutations. Sample traces are shown in Extended Data Fig. 8. All data points are mean ± SEM (n=5 independent experiments). d, Side view of VSD2 with IIS1 omitted for clarity. e, Sample I–V curves of wild-type MmTPC1 (obtained from the peak currents at various activation potentials) and Arg540Gln mutant (obtained by applying voltage pulses ramp from −100 to +100 mV). Currents were recorded with 2 μM PtdIns(3,5)P2 in the pipette and repeated five times independently with similar results. f, Structural comparison of VSD2 between the PtdIns(3,5)P2-bound MmTPC1 (orange) and AtTPC1 (cyan) with S1 helices omitted for clarity. g, Cartoon representation of VSD2 conformational change from the activated to resting state. Red arrows indicate the concurrent movements of S4 and S4–S5 linker.
Containing only two S4 arginines at positions R3 (Arg540) and R5 (Arg546), VSD2 preserves the key features of a canonical voltage sensor, including the 310 helix in IIS4 and the conserved gating charge transfer center (Fig. 3d), and is responsible for the voltage gating of MmTPC1. Mutations of Arg540 and Arg546 have profound but opposite effect on the voltage dependence of the channel. The Arg540Gln mutation stabilizes VSD2 in an activated state and yields a voltage-independent channel that has a linear current-voltage relationship between −100 and 50 mV and can be activated by PtdIns(3,5)P2 even at hyperpolarization (Fig. 3e). The Arg546Gln mutant, on the other hand, can barely be activated by voltage even with high PtdIns(3,5)P2, as if the voltage sensor is trapped in the resting state (Extended Data Fig. 8d).
The MmTPC1 VSD2 adopts an activated conformation with its last voltage-sensing arginine (Arg546) positioned in the gating charge transfer center formed by Tyr487 and Glu490 from IIS2 and Asp512 from IIS3, and the rest of voltage-sensing residues (Arg540 and Gln543) facing the external (luminal) side (Fig. 3d). The VSD2 of AtTPC1 is also responsible for the voltage gating of the channel with its S4 arginines residing at positions R3-R5 and its structure is in the resting state25. We, therefore, can extrapolate the conformational change of MmTPC1 VSD2 from the activated to resting state by comparing its structure with that of AtTPC1 (Fig. 3f–g). The two structures superimpose well in most part except the S4 helix, suggesting that, upon hyperpolarization, the IIS4 of MmTPC1 would slide down by about 2 helical turns without undergoing structural change in the rest of VSD2 and position its R3 arginine (Arg540) at the gating charge transfer center (Fig. 3g). Concurrent with the IIS4 sliding, the IIS4-S5 linker would swing downward and move closer to IIS6. Notably, VSD2 is in the activated state in both the apo and PtdIns(3,5)P2-bound structures, indicating that the voltage sensor can be activated without opening the channel in MmTPC1.
The bound PtdIns(3,5)P2 can be unambiguously identified from the EM density map of the ligand-bound structure (Extended Data Fig. 5d and 9a). PtdIns(3,5)P2 is situated at the junction formed by IS3, IS4, and the IS4-S5 linker of 6-TM I with its inositol 1,3,5-trisphosphate head group positioned on the cytosolic side and its acyl chains inserting upright into the membrane (Fig. 4a and Extended Data Fig. 9a). Fig. 4b summarized the protein-ligand interactions involving predominantly basic residues from the C-terminus of H1, the N-terminus of IS3, IS4-S5 linker and C-terminal part of IS6. Buried deep in the protein, the two phosphate groups on the C1 and C3 positions of the inositol muster the majority of protein-ligand interactions and likely define the ligand specificity. The C5-phosphate protrudes outwardly, away from the ligand binding pocket, and forms salt bridges with Lys87 and Lys331, respectively; the interaction with Lys331 participates in the coupling between the ligand and IIS6, and plays an important role in ligand activation of the channel. Among all the ligand-interacting residues at the PtdIns(3,5)P2 binding site, mutations of those that predominantly interact with the C3-phosphate, including the three arginines (Arg220, Arg221 and Arg224) on the IS4-S5 linker and Lys331 on IS6, appear to have the most profound effect on PtdIns(3,5)P2 activation, illustrating the central role of the C3-phosphate (Extended Data Fig. 9b). In a recent study, the three linker arginines were also reported to be important for NAADP-mediated Ca2+ release30.
To investigate the affinity and specificity of the ligand, we measured the ligand dependent channel activity in excised patches using the voltage-independent Arg540Gln mutant, which simplifies the ligand-dependent gating by eliminating the voltage effect. The mutant also elicits much larger currents making it amenable for inside-out patches. The PtdIns(3,5)P2 dependent activation of the mutant yielded an EC50 of about 145 nM (Fig. 4c and Extended Data Fig. 9c), similar to that of human TPC1 measured in whole lysosome patch20. The PtdIns(4,5)P2 isoform can neither activate the channel nor inhibit PtdIns(3,5)P2 activation (Fig. 4d), indicating high lipid specificity of MmTPC1. The lack of PtdIns(4,5)P2 binding can be explained by the missing C3-phosphate and the close proximity of Asn85 and Lys87 to the C4 hydroxyl group, which sterically excludes the C4-phosphate and, thereby, prevents the binding of the lipid (Fig. 4e).
Compared to the apo structure, PtdIns(3,5)P2 binding does not introduce major structural changes around the ligand-binding pocket (Extended Data Fig. 9d), except one key conformational change on IS6 mediated by Lys331 (Fig. 4f). In the apo state, the Lys331 side chain points away from the ligand binding pocket. In the presence of PtdIns(3,5)P2, the Lys331 side chain adopts an extended configuration to form salt bridges with both the C3 and C5 phosphates as well as a hydrogen-bond with the C4 hydroxyl, pulling IS6 toward the ligand binding pocket (Fig. 4f). This movement propagates to the other part of IS6 as well as IIS6 and opens the gate as will be discussed further in the following section. Lys331 appears to be the only residue that couples IS6 to the bound PtdIns(3,5)P2 and its mutation to Ala completely abolishes PtdIns(3,5)P2 activation (Extended Data Fig. 9b).
Thus, our structures demonstrate that PtdIns(3,5)P2 only binds to the first 6-TM domain and directly introduces conformational changes in IS6 helix, whereas voltage only influences VSD2 in the second 6-TM domain, whose conformational change likely affects the movement of IIS6 helix (Fig. 3 and 4). A global structural comparison between the apo and PtdIns(3,5)P2-bound structures explains the interplay between the two stimuli (Fig. 5). Despite having an activated voltage sensor, the MmTPC1 pore remains closed in the apo structure, implying that PtdIns(3,5)P2 binding is required to trigger the opening of the gate. Upon PtdIns(3,5)P2 binding, the ensuing tethering interaction between Lys331 and PtdIns(3,5)P2 straightens the IS6 helices that are initially bent at the π-helix just below the filter region in the closed state, resulting in the outward dilation and rotation at the bundle crossing (Fig. 2d and 5a). The five-residue π-helix is only present in IS6 and may facilitate the helix bending. To open the pore, the IIS6 helices also have to undergo concurrent outward and rotation movements in order to accommodate the PtdIns(3,5)P2-induced conformational change in IS6 helices, particularly the rotation of the two IS6 gating residues with large hydrophobic side chains (Leu317 and Phe321). Consequently, the two IIS6 gating residues (Val684 and L688) also rotate away from the central axis and open the gate (Fig. 2d and 5b). The IIS6 motion is hinged around the residue right below filter region and propagated to a much larger movement at the C-terminal end of IIS6, which swings upward and make direct contact with the IIS4-S5 linker. Such motion is permissive only when IIS4 of VSD2 is in the activated, up state. Under hyperpolarized membrane potential, IIS4 is expected to slide downward, and push the IIS4-S5 linker along with it, occluding the space necessary for upward IIS6 movement upon PtdIns(3,5)P2 activation (Fig. 3f–g). PtdIns(3,5)P2 probably can still bind MmTPC1 under hyperpolarization but the resting VSD2 prevents channel opening by blocking the movement of IIS6. Thus, membrane potential modulates the TPC1 channel activity by imposing a voltage dependent constraint on PtdIns(3,5)P2 activation and the upward movement of VSD2 under depolarization is prerequisite for the PtdIns(3,5)P2-induced gate opening (Fig. 5c).
Figure 5. Gating mechanism of MmTPC1.
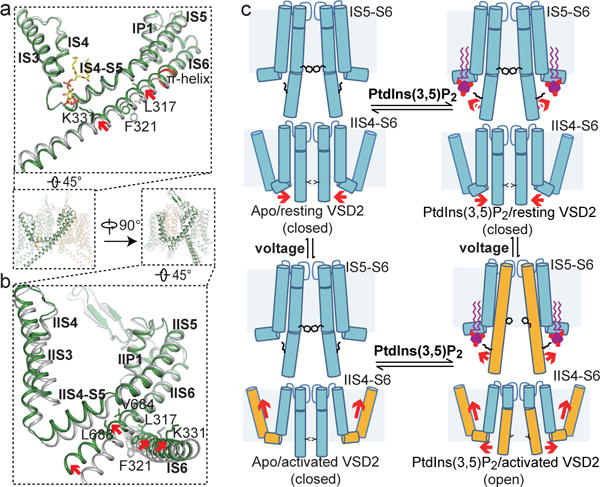
a and b, Structural comparison between the apo closed (grey) and PtdIns(3,5)P2-bound open (green) MmTPC1 with zoomed-in views of the IS3-S6 (a) and IIS3-S6 (b) regions. Arrows indicate the S6 movements. Key gating residues are shown as sticks. IS6 contains a 5-residue π-helix (colored in red). c, Working model for voltage-dependent PtdIns(3,5)P2 activation of MmTPC1. Red arrows mark the direction of the driving force.
Methods
Protein expression and purification
Mouse TPC1 (MmTPC1, NCBI accession: NM_145853.2) containing a C-terminal thrombin cleavage site followed by a GFP tag and a 10× His tag was cloned into a pEZT-BM vector31 and heterologously expressed in HEK293F cells (Life Technologies) using the BacMam system (Thermo Fisher Scientific). The baculovirus was generated in Sf9 cells (Life Technologies) following the standard protocol and used to infect HEK293F cells at a ratio of 1:40 (virus:HEK293F, v:v) and supplemented with 10 mM sodium butyrate to boost protein expression. Cells were cultured in suspension at 37°C for 48 hours and harvested by centrifugation at 3,000 × g. All purification procedures were carried out at 4°C. The cell pellet was re-suspended in buffer A (20 mM Tris, pH 8.0, 150 mM NaCl) supplemented with a protease inhibitor cocktail (containing 2 μg/ml DNAse, 0.5 μg/ml pepstatin, 2 μg/ml leupeptin, and 1 μg/ml aprotinin and 0.1 mM PMSF) and homogenized by sonication on ice. MmTPC1 was extracted with 1% (w:v) n-Dodecyl-β-D-Maltopyranoside (DDM) (Anatrace) supplemented with 0.2% (w:v) cholesteryl hemisuccinate (CHS, Sigma Aldrich) by gentle agitation for 2 hours. After extraction, the supernatant was collected after a 60-minute centrifugation at 20,000 g and incubated with Ni-NTA resin (Qiagen) using gentle agitation. After 2 hours, the resin was collected on a disposable gravity column (Bio-Rad). The resin was washed with buffer B (20mM Tris, pH 8.0, 150 mM NaCl and 0.06% glycol-diosgenin (GDN, Anatrace) supplemented with 20 mM imidazole. The washed resin was left on column in buffer B and digested with thrombin (Roche) overnight. After thrombin digestion, the flow-through containing untagged MmTPC1 was collected, concentrated, and purified by size exclusion chromatography on a Superdex 200 column (GE Heathcare) pre-equilibrated with buffer B. The peak fraction was pooled and concentrated to 4.7 mg/ml for cryo-electron microscopy analysis. To obtain phosphatidylinositol 3,5-bisphosphate (PtdIns(3,5)P2) bound structure, the protein sample was supplemented with 0.5 mM PtdIns(3,5)P2 diC8 (echelon) for 30 minutes on ice before EM grids preparation.
EM data acquisition
The cryo-EM grids were prepared by applying MmTPC1 (4.7 mg/ml, with or without 0.5 mM PtdIns(3,5)P2) to a glow-discharged Quantifoil R1.2/1.3 300-mesh gold holey carbon grid. Grids were blotted for 4.0 seconds under 100% humidity at 4 °C before being plunged into liquid ethane using a Mark IV Vitrobot (FEI). Micrographs were acquired on a Titan Krios microscope (FEI) operated at 300 kV with a K2 Summit direct electron detector (Gatan), using a slit width of 20 eV on a GIF-Quantum energy filter. Images were recorded with EPU software (FEI) in super-resolution counting mode with a super resolution pixel size of 0.535 Å. The defocus range was set from −1.5 μm to −3 μm. Each micrograph was dose-fractionated to 30 frames under a dose rate of 4 e-/pixel/s, with a total exposure time of 15 s, resulting in a total dose of about 50 e-/Å2.
Image processing
Micrographs were motion corrected and binned 2 fold (yielding a pixel size of 1.07 Å/pixel) with MotionCor232. The CTF parameters of the micrographs were estimated using the GCTF program33. All other steps of image processing were performed using RELION2.034,35. Initially, ~ 1,000 particles were manually picked from a few micrographs. Class averages representing projections of MmTPC1 in different orientations were selected from the 2D classification of the manually picked particles, and used as templates for automatic particle picking from the full dataset. For the Apo MmTPC1 dataset, 1,411,763 particles were picked from 2,937 micrographs. The particles were extracted and binned 3 times (3.21 Å/pixel). After 2D classification, a total of 1,117,348 particles were finally selected for 3D classification using AtTPC1 structure as the initial mode. Three of the 3D classes showed good secondary structure features and were selected and re-extracted into the original pixel size of 1.07 Å. After 3D refinement with C2 symmetry imposed and particle polishing, the resulting 3D reconstructions from ~536K particles showed a clear 2-fold symmetry with a resolution of 3.5 Å. We then performed a focused 3D classification with density subtraction in order to improve the density of transmembrane domain36. In this approach, only the density corresponding to the transmembrane domain was kept in each particle image by subtracting the density for all other parts including the belt-like detergent density from the original particles. The subsequent 3D classification on the modified particles was carried out by applying a mask around the transmembrane domain with all the particle orientations fixed at the value determined in the initial 3D refinement. After this round of classification, one class (~43K particles) showed better density in the transmembrane domain. The corresponding particles before density subtraction from this class were selected and 3D refined, yielding an EM map of 3.4 Å for the entire channel.
The data for MmTPC1 in the presence of PtdIns(3,5)P2 were processed similarly to that of apo MmTPC1. In brief, 941,754 particles were picked from a total of 2,348 micrographs. After 2D classification, 620,307 particles were selected for 3D classification. Three classes with a total of ~245K particles were selected and combined for 3D auto-refinement, which results in a map with an overall resolution of 3 Å. One round of 3D classification was then performed by focusing on the transmembrane domain. One class (~83K particles) showed better density in the transmembrane domain and was selected for final 3-D refinement, yielding an EM map of 3.2 Å. All resolutions were estimated by applying a soft mask around the protein density and the gold-standard Fourier shell correlation (FSC) = 0.143 criterion. ResMap was used to calculate the local resolution map37.
Model building, refinement, and validation
De novo atomic model buildings were conducted in Coot38. Amino acid assignment was achieved based mainly on the clearly defined densities for bulky residues (Phe, Trp, Tyr, and Arg). Real space model refinement was performed in Phenix39. Models were validated using previously described methods to avoid overfitting40,41. The final structure models for both Apo and PtdIns(3,5)P2-bound states include residues 66-701 and resiude709-795. Residues 1–65, 702–708 and 796–817 are disordered and not modeled. The statistic of the models’ geometries was generated using MolProbity42. All the figures were prepared in PyMol43 or Chimera44. Programs used for model building, refinement and validation are compiled by SBGrid45.
Electrophysiology
In human TPC2, the Leu11Ala and Leu12Ala mutations at the N-terminal targeting sequence have been shown to promote channel expression and trafficking to the plasma membrane of the HEK293 cell, allowing for channel activity measurement using patch clamp22,46. We therefore also introduced the equivalent mutations, Leu11Ala and Ile12Ala, in mouse TPC1 (MmTPC1). Indeed, HEK293 cells overexpressed with Leu11Ala/Ile12Ala mutant of MmTPC1 elicited much larger whole cell currents than those expressed with wild type MmTPC1 (Extended Data Fig.2a). Therefore the Leu11Ala/Ile12Ala mutant was used and considered as the wild type channel in all our recordings. All other mutations in our experiments were generated on the background of this plasma membrane-targeting MmTPC1. With the channels targeted to the plasma membrane, the extracellular side is equivalent to the luminal side of TPC1 in endo/lysosomes. MmTPC1 and its mutants were cloned into pCGFP-EU vector47. About 2 μg of the plasmid containing the C-terminal GFP-tagged mouse TPC1 or its mutant was transfected into HEK293 cells grown in a six-well tissue culture dish using Lipofectamine 2000 (Life Technology). 48 hours after transfection, cells were dissociated by trypsin treatment and kept in complete serum-containing medium and re-plate on 35 mm tissue culture dishes in tissue culture incubator until recording.
Patch clamp in whole cell configuration was employed to measure channel activity in most of the experiments except the measurements of ligand affinity and specificity, which were recorded in excised patches (inside-out patches) using voltage-independent Arg540Gln mutant. This mutant channel can be activated solely by PtdIns(3,5)P2 and also yields much larger plasma membrane currents making it more amenable for inside-out patches. The standard intracellular solution contained (in mM): 145 Sodium methanesulfonate (Na-MS), 5 NaCl, 4 MgCl2, 1 EGTA, 10 HEPES buffered with Tris, pH=7.4. The extracellular solution contained (in mM): 145 Na-MS, 5 NaCl, 1 MgCl2, 1 CaCl2, 10 HEPES buffered with Tris, pH=7.4. Various concentrations of PtdIns(3,5)P2 as specified in each experiment were added in the intracellular solutions to activate the channel. For patches in whole cell configuration, the intracellular solution is in the pipette and the extracellular solution is in the bath; the solution arrangement is reversed for the inside-out patches. The lipid ligands used in our studies are phosphatidylinositol-3,5-bisphosphate diC8 (PtdIns(3,5)P2 diC8, Echelon) and phosphatidylinositol-4,5-bisphosphate diC8 (PtdIns(4,5)P2 diC8, Echelon).
The Data were acquired using an AxoPatch 200B amplifier (Molecular Devices) and a low-pass analogue filter set to 1 kHz. The current signal was sampled at a rate of 20 kHz using a Digidata 1322A digitizer (Molecular Devices) and further analysed with pClamp 9 software (Molecular Devices). Patch pipettes were pulled from borosilicate glass (Harvard Apparatus) and heat polished to a resistance of 3–5 MΩ. After the patch pipette attached to the cell membrane, a giga seal (> 10GΩ) was formed by gentle suction. The whole-cell configuration was formed by short zap or suction to rupture the patch. The inside-out configuration was formed by pulling pipette away from the cell, and the pipette tip was exposed into the air for short time in some cases. The holding potential was set to −70 mV. To generate G/Gmax versus V curves (G=I/V), the membrane was stepped from the holding potential (−70mV) to various testing potentials (−100 mV to +100 mV) for 1s and then step to −70 mV (Fig. 1a). The peak tail currents were used to plot G–V curve. Gmax was obtained from the peak tail current at 100 mV testing potential. V1/2 and Z values were obtained from the fits of data with Boltzmann equation, where V1/2 is the voltage at which the channels have reached half of their maximum fraction open and Z is the apparent valence of voltage dependence. The same protocol was used to obtain current and voltage relationship (I–V curve) of the wild-type MmTPC1 (Fig. 3e top trace), except that the peak current at each testing potential was used to generate the I–V curve. For voltage-independent Arg540Gln mutant, the holding potential was set to 0 mV, and the current and voltage relationship (I–V curve, Fig. 3e bottom trace) was obtained directly by using voltage pulses ramp from −100 to +100 mV over 800 ms duration.
For measuring ion selectivity of MmTPC1 and its mutants in whole cell patches, 10 uM PtdIns(3,5)P2 was included in intracellular (pipette) solution to fully activate the channel. The membrane potential was stepped from the holding potential (−70 mV) to +100 mV for 1s to activate the channels and then step to various testing potentials (−120 mV to +40 mV) for 1 s (Extended Data Fig. 2f). The peak tail currents at various testing potentials were plotted to determine the reversal potential (Vrev). To measure the relative permeability between Na+ and K+, the extracellular (bath) solution (in mM) was changed to 145 KMS, 5 NaCl, 1 MgCl2, 1 CaCl2, 10 HEPES buffered with Tris, pH 7.4. To measure the relative permeability between Na+ and Ca2+, the extracellular solution (in mM) was changed to 95 Ca(MS)2, 5 CaCl2, 10 HEPES buffered with Tris, pH 7.4. The ion permeability ratios were calculated with the following equations:
where Vrev is the reverse potential, F is Faraday’s constant, R is the gas constant, T is the absolute temperature, o is extracelluar and i is intracelluar.
All electrophysiological recording were repeated at least five times using different patches. Most data points shown are mean ± SEM (n =5 independent experiments).
Data availability
The cryo-EM density maps of the mouse TPC1 have been deposited in the Electron Microscopy Data Bank under accession numbers EMD-7434 for the apo state and EMD-7435 for the PtdIns(3,5)P2-bound state. Atomic coordinates have been deposited in the Protein Data Bank under accession numbers 6C96 for the apo state and 6C9A for the PtdIns(3,5)P2-bound state. Source data for Fig. 3c, Extended Data Fig. 2c and Extended Data Fig. 2e are available in Supplementary Information.
Extended Data
Extended Data Figure 1. Sequence alignment of MmTPC1, HsTPC1, AtTPC1, MmTPC2 and HsTPC2.
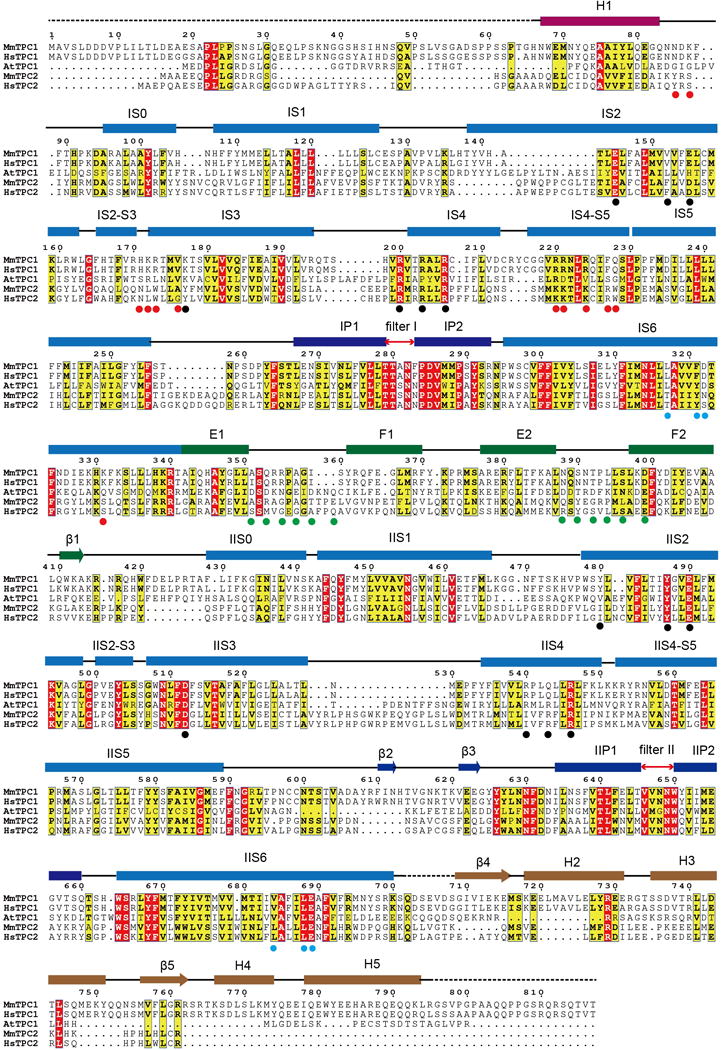
Secondary structure assignments are based on the structure of PtdIns(3,5)P2-bound MmTPC1. Red dots mark the ligand binding residues; black dots mark the S4 arginine residues and residues at the gating charge transfer center; cyan dots mark the key S6 gating residues; green dots mark the residues predicted to participate in calcium coordination in EF-hand domains of AtTPC1. MmTPC1 and AtTPC1shares about 25% sequence identity.
Extended Data Figure 2. Gating and selectivity of MmTPC1.
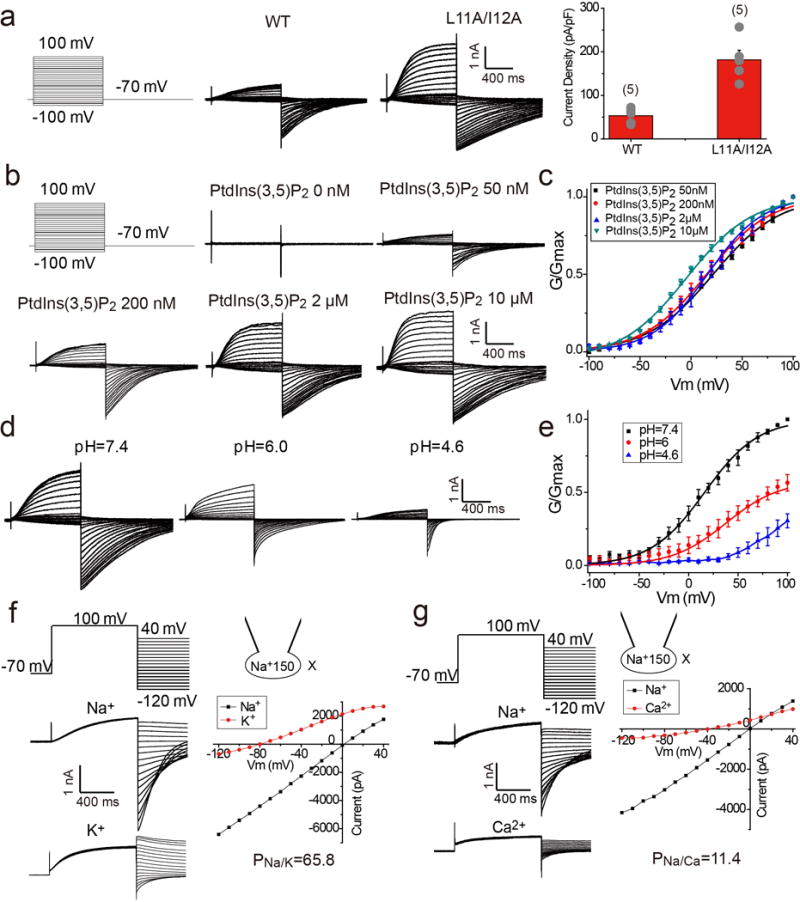
a, Sample traces and current density (current/capacitance) of the wild type and L11A/I12A mutant of MmTPC1 recorded in the whole cell configuration with 100 μM PtdIns(3,5)P2 in the pipette (cytosolic). The experiments were repeated five times independently with similar results. Data points for current density are mean ± SEM (n=5 independent experiments). L11A/I12A mutant elicited much larger whole cell currents and therefore was used as the wild type channel in all our recordings. The extracellular side of MmTPC1 in plasma membrane is equivalent to the luminal side of MmTPC1 in lysosomes. b, Sample traces of PtdIns(3,5)P2-dependent voltage activation of MmTPC1. Whole cell currents were recorded with varying PtdIns(3,5)P2 concentrations in the pipette (cytosolic) at pH 7.4. The experiments were repeated five times independently with similar results. c, G/Gmax-V curves of MmTPC1 at various PtdIns(3,5)P2 concentrations. Boltzmann fit yields V1/2(mV)= 21.6 ± 1.2, 15.2 ± 1.0, 16.1 ± 0.9, −2.0 ± 1.0 and Z=0.78 ± 0.04, 0.82 ± 0.03, 0.89 ± 0.02, 0.84 ± 0.05 for voltage activation in 0.05, 0.2, 2.0, 10 μM cytosolic PtdIns(3,5)P2, respectively, where V1/2 is the membrane potential for half maximum activation and Z is apparent valence. All data points are mean ± SEM (n=5 independent experiments). d, Luminal pH modulates the voltage activation of MmTPC1. Whole cell currents of MmTPC1 recorded in the presence of 2 μM cytosolic PtdIns(3,5)P2 with varying luminal (bath) pH of 7.4, 6.0 or 4.6. Sample traces were obtained from the same patch. The experiments were repeated five times independently with similar results. e, G/Gmax-V curves of MmTPC1 at various luminal pH. Boltzmann fit yields V1/2= 16.2 ± 0.8 mV, Z= 0.91 ± 0.02 at pH 7.4, V1/2= 38.2 ± 1.2 mV, Z=0.95 ± 0.02 at pH 6.0. All data points were normalized against Gmax obtained at 100 mV activation voltage and pH 7.4. All data points are mean ± SEM (n=5 independent experiments). f, Sample traces of whole cell currents with 150 mM Na+ in the pipette solution and 150 mM X (X=150 mM Na+ or 145 mM K+ and 5 mM Na+) in the bath solution, and the I–V curves generated from the tail currents of the sample traces. g, Sample traces of whole cell currents with 150 mM Na+ in the pipette solution and 150 mM Na+ or 100 mM Ca2+ in the bath solution, and the I–V curves generated from the tail currents of the sample traces. Data in (f) and (g) were recorded with 10 μM PtdIns(3,5)P2 in the pipette at pH 7.4 and both experiments were repeated five times independently with similar results.
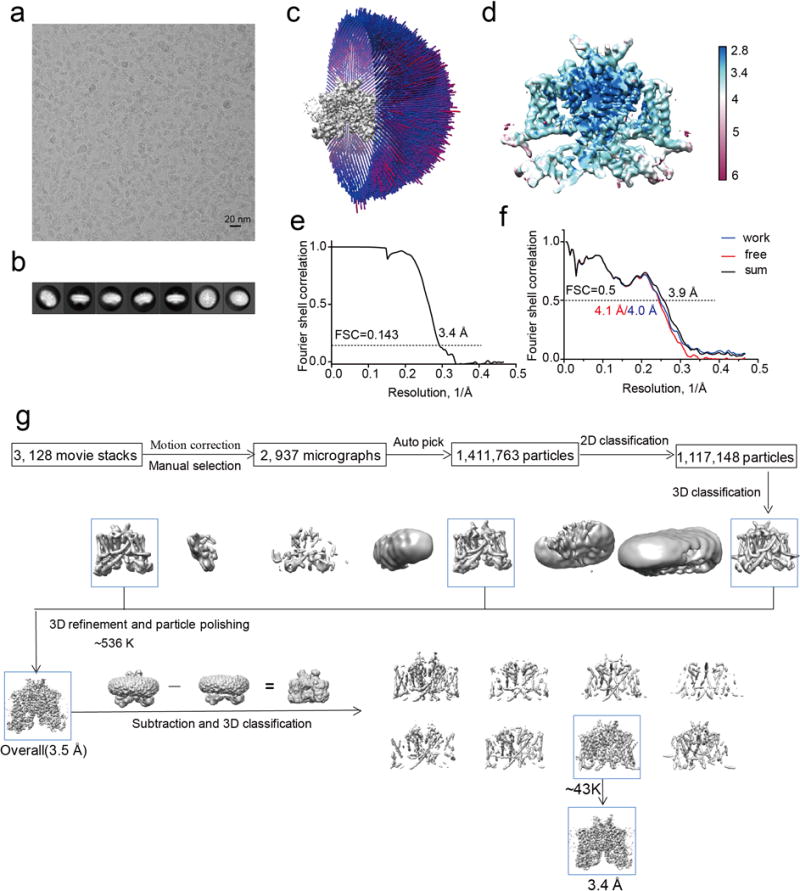
Extended Data Figure 3. Structure determination of PtdIns(3,5)P2-bound MmTPC1.
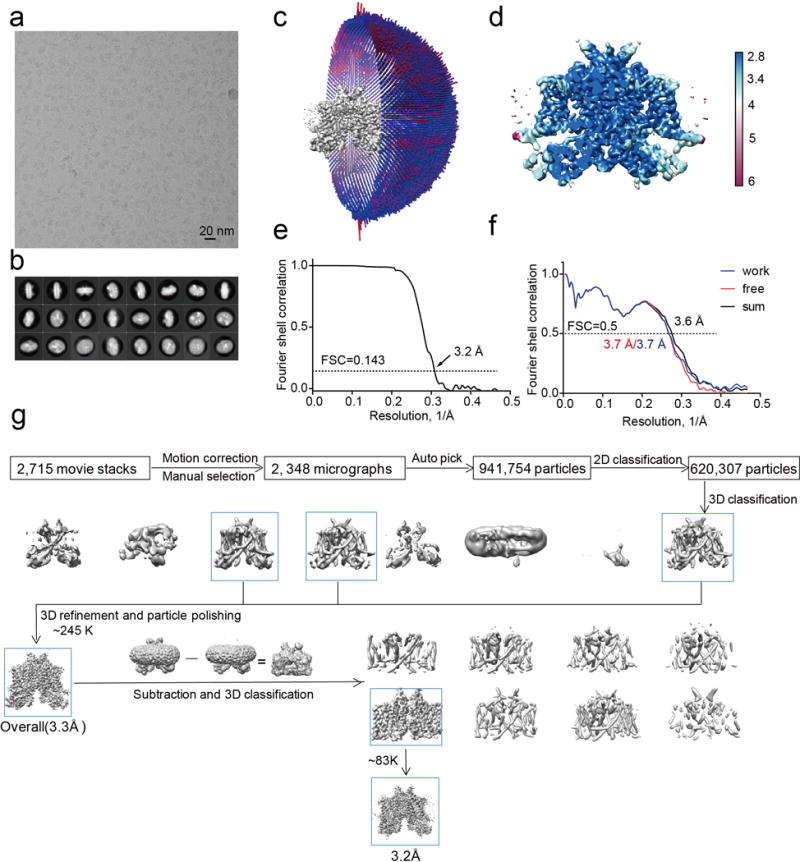
a, Representative electron micrograph of PtdIns(3,5)P2-bound MmTPC1 and 2348 micrographs were used for structure determination. b, Two-dimensional class averages. c, Euler angle distribution of particles used in the final three-dimensional reconstruction, with the heights of the cylinders corresponding to the number of particles. d, Final density maps colored by local resolution. e, Gold-standard FSC curves of the final 3D reconstructions. f, FSC curves for cross-validation between the models and the maps. Curves for model vs. summed map in black (sum), for model vs. half map in blue (work), and for model vs. half map not used for refinement in red (free). g, Flowchart of EM data processing for PtdIns(3,5)P2-bound MmTPC1 particles.
Extended Data Figure 4. Structure determination of apo MmTPC1.
a, Representative electron micrograph of apo MmTPC1 and 2937 micrographs were used for structure determination. b, Two-dimensional class averages. c, Euler angle distribution of particles used in the final three-dimensional reconstruction, with the heights of the cylinders corresponding to the number of particles. d, Final density maps colored by local resolution. e, Gold-standard FSC curves of the final 3D reconstructions. f, FSC curves for cross-validation between the models and the maps. Curves for model vs. summed map in black (sum), for model vs. half map in blue (work), and for model vs. half map not used for refinement in red (free). g, Flowchart of EM data processing for apo MmTPC1 particles.
Extended Data Figure 5. Sample EM density maps (blue mesh) for MmTPC1.
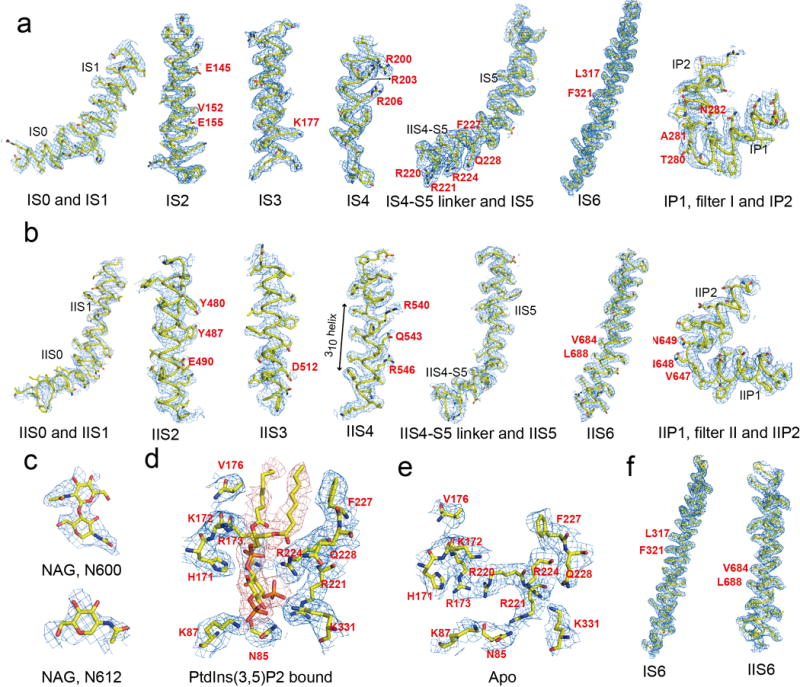
a–d, Sample EM density maps for various parts of PtdIns(3,5)P2-bound MmTPC1: IS1-S6 and filter I (a), IIS1-S6 and filter II (b), NAGs of Asn600 and Asn612 (c), PtdIns(3,5)P2 binding site (d). The maps are low-pass filtered to 3.2 Å and sharpened with a temperature factor of −105 Å2. e and f, Sample EM density maps for the key parts of Apo MmTPC1: ligand binding site (e) and S6 helices (f). The maps are low-pass filtered to 3.4 Å and sharpened with a temperature factor of −98.5 Å2. Residues discussed in main text are labeled in red.
Extended Data Figure 6. Structure comparison between MmTPC1 and AtTPC1.
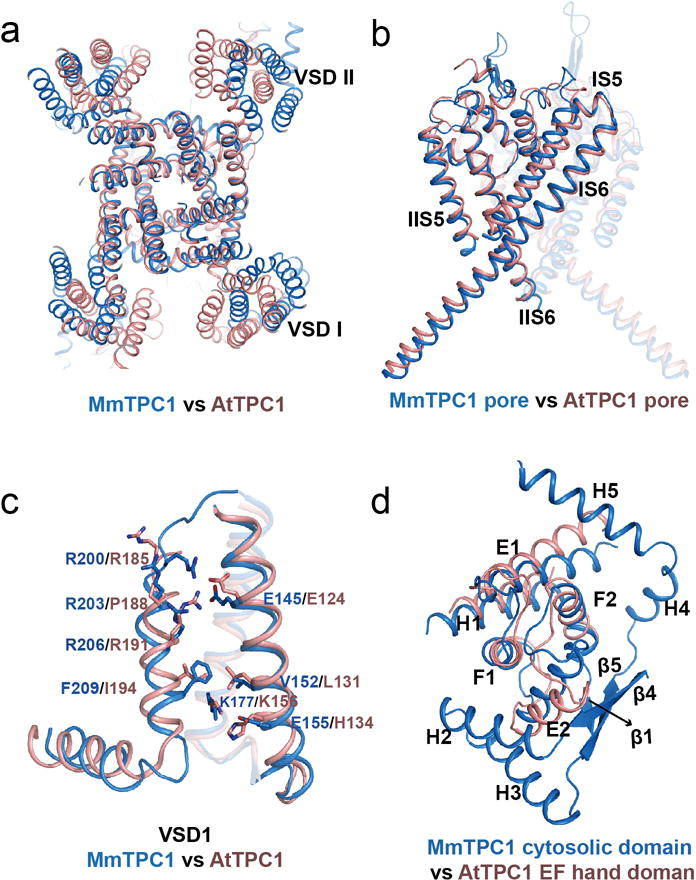
a, Superposition of the overall structures of MmTPC1 (marine) and AtTPC1(salmon). b, Superposition of the pore regions. c, Superposition of VSD1 domains. The comparison of the VSD2 domains is shown in figure 3f. d, superposition of cytosolic soluble domains.
Extended Data Figure 7. Sample traces of whole cell currents for N648A and N649A filter mutants.
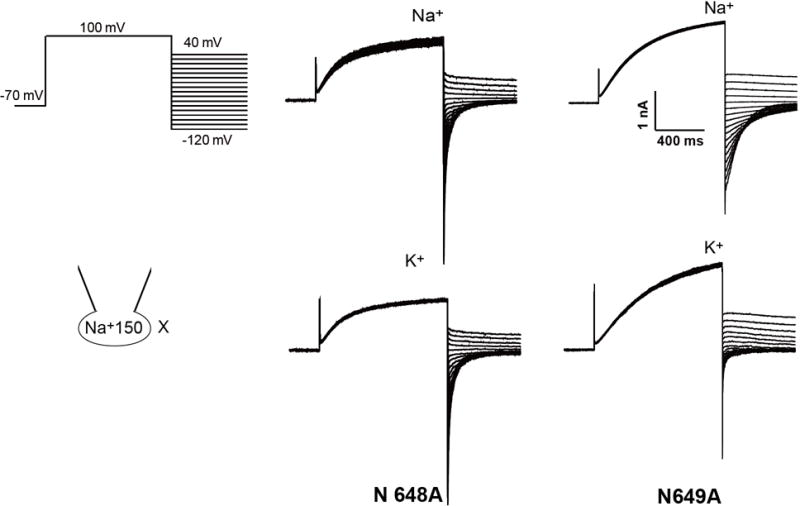
The pipette solution contained 150 mM Na+ and the bath solution contained 150 mM Na+ or 145 mM K+/5 mM Na+. The tail currents were used to generate the I–V curves shown in Figure 2g. The experiments were repeated five times independently with similar results.
Extended Data Figure 8. Voltage sensing domains.
a, Superimposition of MmTPC1 VSD1 structures in the PtdIns(3,5)P2-bound (green) and apo (pink) states with S1 helices removed for clarity. The MmTPC1 VSD1 lacks some key features of canonical voltage sensors: the conserved aromatic residue on S2 and acidic residue on S3 that form the gating charge transfer center become V152 and Lys177, respectively, in MmTPC1; the conserved basic residue at the R5 position becomes Phe209 in MmTPC1; no arginine from IS4 is positioned in the gating charge transfer center. b, Superimposition of MmTPC1 VSD2 structures in the PtdIns(3,5)P2-bound (orange) and apo (cyan) states. c, Sample traces of voltage activation of MmTPC1 and its IS4 arginine mutations recorded in the whole cell configuration with 2 μM PtdIns(3,5)P2 in the pipette. Peak tail currents were used to generate the G/Gmax-V curves shown in Figure 3c. The experiments were repeated five times independently with similar results. d, Sample traces of voltage activation of R546Q mutation recorded in the whole cell configuration with 2 μM and 100 μM PtdIns(3,5)P2 in the pipette. The experiments were repeated five times independently with similar results.
Extended Data Figure 9. PtdIns(3,5)P2 binding in MmTPC1.
a, Model of bound PtdIns(3,5)P2 (left panel) and its EM density (right panel). Density of two other membrane lipid molecules (blue mesh in the left panel) was also observed near PtdIns(3,5)P2 in the structure. b, Current density of mutations at the PtdIns(3,5)P2-binding site measured at −100 mV in whole cell recordings. All mutants were generated on the background of Arg540Gln mutant which is used as control. All data points are mean ± SEM with the number of independent experiments for each mutant shown in bracket. c, Sample I-V curves of Arg540Gln mutant recorded in excised patches with varying PtdIns(3,5)P2 concentrations in the bath (cytosolic). The experiments were repeated five times independently with similar results. Currents at −100mV were used to generate the concentration dependent PtdIns(3,5)P2 activation curve shown in Figure 4c. Imax is the current recorded at −100 mV with 10 μM PtdIns(3,5)P2 in the bath. d, Structural comparison at the ligand binding site between the PtdIns(3,5)P2-bound (green) and apo (salmon) states.
Extended Data Table 1.
Cryo-EM data collection and model statistics.
| PtdIns(3,5)P2 – bound MmTPC1 (EMD-7435) (PDB 6C9A) |
Apo MmTPC1 (EMD-7434) (PDB 6C96) |
|
|---|---|---|
| Data collection and processing | ||
| Magnification | 46730 | 46730 |
| Voltage (kV) | 300 | 300 |
| Electron exposure (e−/Å2) | ~50 | ~50 |
| Defocus range (μm) | −1.5 to −3.0 | −1.5 to −3.0 |
| Pixel size (Å) | 1.07 | 1.07 |
| Symmetry imposed | C2 | C2 |
| Initial particle images (no.) | 941,754 | 1,260,054 |
| Final particle images (no.) | 82,819 | 42,870 |
| Map resolution (Å) | 3.2 | 3.4 |
| FSC threshold | 0.143 | 0.143 |
| Refinement | ||
| Initial model used (PDB code) | 5E1J | 5E1J |
| Model resolution (Å) | 3.2 | 3.4 |
| FSC threshold | 0.143 | 0.143 |
| Map sharpening B factor (Å2) | −105.07 | −98.52 |
| Model composition | ||
| Non-hydrogen atoms | 12182 | 12090 |
| Protein residues | 12004 | 12004 |
| Ligands | 178 | 86 |
| B factors (Å2) | ||
| Protein | 80.93 | 98.57 |
| Ligand | 67.59 | 81.03 |
| R.m.s. deviations | ||
| Bond lengths (Å) | 0.009 | 0.010 |
| Bond angles (°) | 1.286 | 1.309 |
| Validation | ||
| MolProbity score | 1.41 | 1.5 |
| Clashscore | 2.79 | 3.5 |
| Poor rotamers (%) | 0 | 0.3 |
| Ramachandran plot | ||
| Favored (%) | 94.99% | 94.85% |
| Allowed (%) | 5.01% | 5.15% |
| Disallowed (%) | 0 | 0 |
Acknowledgments
We thank N. Nguyen for manuscript preparation, and Dr. M. X. Zhu at University of Texas Health Science Center at Houston for providing clones of animal TPC genes. Single particle cryo-EM data were collected at the UT Southwestern Medical Center (UTSW) Cryo-Electron Microscopy Facility. We thank D. Nicastro and Z. Chen for support in facility access and data acquisition. Negatively stained sample screening was performed at UTSW Electron Microscopy core. This work was supported in part by the Howard Hughes Medical Institute (Y.J.) and by grants from the National Institute of Health (GM079179 to Y. J.) and the Welch Foundation (Grant I-1578 to Y. J.). X.B. is supported by the Cancer Prevention and Research Initiative of Texas and Virginia Murchison Linthicum Scholar in Medical Research fund.
Footnotes
Author Contributions
J.S., J.G. and Q.C. prepared the samples; J.S., J.G., Q.C. and X.B. performed data acquisition, image processing and structure determination; W.Z. performed electrophysiology; all authors participated in research design, data analysis, and manuscript preparation.
Author Information
The authors declare no competing financial interests.
References
- 1.Rahman T, et al. Two-pore channels provide insight into the evolution of voltage-gated Ca2+ and Na+ channels. Sci Signal. 2014;7:ra109. doi: 10.1126/scisignal.2005450. [DOI] [PMC free article] [PubMed] [Google Scholar]
- 2.Yu FH, Catterall WA. The VGL-chanome: a protein superfamily specialized for electrical signaling and ionic homeostasis. Sci STKE. 2004;2004:re15. doi: 10.1126/stke.2532004re15. [DOI] [PubMed] [Google Scholar]
- 3.Ishibashi K, Suzuki M, Imai M. Molecular cloning of a novel form (two-repeat) protein related to voltage-gated sodium and calcium channels. Biochem Biophys Res Commun. 2000;270:370–376. doi: 10.1006/bbrc.2000.2435. [DOI] [PubMed] [Google Scholar]
- 4.Furuichi T, Cunningham KW, Muto S. A putative two pore channel AtTPC1 mediates Ca(2+) flux in Arabidopsis leaf cells. Plant Cell Physiol. 2001;42:900–905. doi: 10.1093/pcp/pce145. [DOI] [PubMed] [Google Scholar]
- 5.Patel S. Function and dysfunction of two-pore channels. Sci Signal. 2015;8:re7. doi: 10.1126/scisignal.aab3314. [DOI] [PubMed] [Google Scholar]
- 6.Grimm C, Chen CC, Wahl-Schott C, Biel M. Two-Pore Channels: Catalyzers of Endolysosomal Transport and Function. Front Pharmacol. 2017;8:45. doi: 10.3389/fphar.2017.00045. [DOI] [PMC free article] [PubMed] [Google Scholar]
- 7.Xu H, Ren D. Lysosomal physiology. Annu Rev Physiol. 2015;77:57–80. doi: 10.1146/annurev-physiol-021014-071649. [DOI] [PMC free article] [PubMed] [Google Scholar]
- 8.Ambrosio AL, Boyle JA, Aradi AE, Christian KA, Di Pietro SM. TPC2 controls pigmentation by regulating melanosome pH and size. Proc Natl Acad Sci U S A. 2016;113:5622–5627. doi: 10.1073/pnas.1600108113. [DOI] [PMC free article] [PubMed] [Google Scholar]
- 9.Bellono NW, Escobar IE, Oancea E. A melanosomal two-pore sodium channel regulates pigmentation. Sci Rep. 2016;6:26570. doi: 10.1038/srep26570. [DOI] [PMC free article] [PubMed] [Google Scholar]
- 10.Sulem P, et al. Two newly identified genetic determinants of pigmentation in Europeans. Nat Genet. 2008;40:835–837. doi: 10.1038/ng.160. [DOI] [PubMed] [Google Scholar]
- 11.Fernandez B, et al. Iron overload causes endolysosomal deficits modulated by NAADP-regulated 2-pore channels and RAB7A. Autophagy. 2016;12:1487–1506. doi: 10.1080/15548627.2016.1190072. [DOI] [PMC free article] [PubMed] [Google Scholar]
- 12.Pereira GJ, et al. Nicotinic acid adenine dinucleotide phosphate (NAADP) regulates autophagy in cultured astrocytes. J Biol Chem. 2011;286:27875–27881. doi: 10.1074/jbc.C110.216580. [DOI] [PMC free article] [PubMed] [Google Scholar]
- 13.Favia A, et al. VEGF-induced neoangiogenesis is mediated by NAADP and two-pore channel-2-dependent Ca2+ signaling. Proc Natl Acad Sci U S A. 2014;111:E4706–4715. doi: 10.1073/pnas.1406029111. [DOI] [PMC free article] [PubMed] [Google Scholar]
- 14.Arndt L, et al. NAADP and the two-pore channel protein 1 participate in the acrosome reaction in mammalian spermatozoa. Mol Biol Cell. 2014;25:948–964. doi: 10.1091/mbc.E13-09-0523. [DOI] [PMC free article] [PubMed] [Google Scholar]
- 15.Cang C, et al. mTOR regulates lysosomal ATP-sensitive two-pore Na(+) channels to adapt to metabolic state. Cell. 2013;152:778–790. doi: 10.1016/j.cell.2013.01.023. [DOI] [PMC free article] [PubMed] [Google Scholar]
- 16.Grimm C, et al. High susceptibility to fatty liver disease in two-pore channel 2-deficient mice. Nat Commun. 2014;5:4699. doi: 10.1038/ncomms5699. [DOI] [PubMed] [Google Scholar]
- 17.Sakurai Y, et al. Ebola virus. Two-pore channels control Ebola virus host cell entry and are drug targets for disease treatment. Science. 2015;347:995–998. doi: 10.1126/science.1258758. [DOI] [PMC free article] [PubMed] [Google Scholar]
- 18.Brailoiu E, et al. Essential requirement for two-pore channel 1 in NAADP-mediated calcium signaling. J Cell Biol. 2009;186:201–209. doi: 10.1083/jcb.200904073. [DOI] [PMC free article] [PubMed] [Google Scholar]
- 19.Calcraft PJ, et al. NAADP mobilizes calcium from acidic organelles through two-pore channels. Nature. 2009;459:596–600. doi: 10.1038/nature08030. [DOI] [PMC free article] [PubMed] [Google Scholar]
- 20.Zong X, et al. The two-pore channel TPCN2 mediates NAADP-dependent Ca(2+)-release from lysosomal stores. Pflugers Arch. 2009;458:891–899. doi: 10.1007/s00424-009-0690-y. [DOI] [PMC free article] [PubMed] [Google Scholar]
- 21.Wang X, et al. TPC proteins are phosphoinositide- activated sodium-selective ion channels in endosomes and lysosomes. Cell. 2012;151:372–383. doi: 10.1016/j.cell.2012.08.036. [DOI] [PMC free article] [PubMed] [Google Scholar]
- 22.Jha A, Ahuja M, Patel S, Brailoiu E, Muallem S. Convergent regulation of the lysosomal two-pore channel-2 by Mg(2)(+), NAADP, PI(3,5)P(2) and multiple protein kinases. EMBO J. 2014;33:501–511. doi: 10.1002/embj.201387035. [DOI] [PMC free article] [PubMed] [Google Scholar]
- 23.Cang C, Bekele B, Ren D. The voltage-gated sodium channel TPC1 confers endolysosomal excitability. Nat Chem Biol. 2014;10:463–469. doi: 10.1038/nchembio.1522. [DOI] [PubMed] [Google Scholar]
- 24.Rybalchenko V, et al. Membrane potential regulates nicotinic acid adenine dinucleotide phosphate (NAADP) dependence of the pH− and Ca2+-sensitive organellar two-pore channel TPC1. J Biol Chem. 2012;287:20407–20416. doi: 10.1074/jbc.M112.359612. [DOI] [PMC free article] [PubMed] [Google Scholar]
- 25.Guo J, et al. Structure of the voltage-gated two-pore channel TPC1 from Arabidopsis thaliana. Nature. 2016;531:196–201. doi: 10.1038/nature16446. [DOI] [PMC free article] [PubMed] [Google Scholar]
- 26.Kintzer AF, Stroud RM. Structure, inhibition and regulation of two-pore channel TPC1 from Arabidopsis thaliana. Nature. 2016;531:258–262. doi: 10.1038/nature17194. [DOI] [PMC free article] [PubMed] [Google Scholar]
- 27.Hedrich R, Marten I. TPC1-SV channels gain shape. Mol Plant. 2011;4:428–441. doi: 10.1093/mp/ssr017. [DOI] [PubMed] [Google Scholar]
- 28.Guo J, Zeng W, Jiang Y. Tuning the ion selectivity of two-pore channels. Proc Natl Acad Sci U S A. 2017;114:1009–1014. doi: 10.1073/pnas.1616191114. [DOI] [PMC free article] [PubMed] [Google Scholar]
- 29.Hooper R, Churamani D, Brailoiu E, Taylor CW, Patel S. Membrane topology of NAADP-sensitive two-pore channels and their regulation by N-linked glycosylation. J Biol Chem. 2011;286:9141–9149. doi: 10.1074/jbc.M110.189985. [DOI] [PMC free article] [PubMed] [Google Scholar]
- 30.Patel S, Churamani D, Brailoiu E. NAADP-evoked Ca(2+) signals through two-pore channel-1 require arginine residues in the first S4-S5 linker. Cell Calcium. 2017;68:1–4. doi: 10.1016/j.ceca.2017.09.003. [DOI] [PMC free article] [PubMed] [Google Scholar]
- 31.Morales-Perez CL, Noviello CM, Hibbs RE. Manipulation of Subunit Stoichiometry in Heteromeric Membrane Proteins. Structure. 2016;24:797–805. doi: 10.1016/j.str.2016.03.004. [DOI] [PMC free article] [PubMed] [Google Scholar]
- 32.Zheng SQ, et al. MotionCor2: anisotropic correction of beam-induced motion for improved cryo-electron microscopy. Nat Methods. 2017;14:331–332. doi: 10.1038/nmeth.4193. [DOI] [PMC free article] [PubMed] [Google Scholar]
- 33.Zhang K. Gctf: Real-time CTF determination and correction. J Struct Biol. 2016;193:1–12. doi: 10.1016/j.jsb.2015.11.003. [DOI] [PMC free article] [PubMed] [Google Scholar]
- 34.Kimanius D, Forsberg BO, Scheres SH, Lindahl E. Accelerated cryo-EM structure determination with parallelisation using GPUs in RELION-2. Elife. 2016;5 doi: 10.7554/eLife.18722. [DOI] [PMC free article] [PubMed] [Google Scholar]
- 35.Scheres SH. RELION: implementation of a Bayesian approach to cryo-EM structure determination. J Struct Biol. 2012;180:519–530. doi: 10.1016/j.jsb.2012.09.006. [DOI] [PMC free article] [PubMed] [Google Scholar]
- 36.Bai XC, Rajendra E, Yang G, Shi Y, Scheres SH. Sampling the conformational space of the catalytic subunit of human gamma-secretase. Elife. 2015;4 doi: 10.7554/eLife.11182. [DOI] [PMC free article] [PubMed] [Google Scholar]
- 37.Kucukelbir A, Sigworth FJ, Tagare HD. Quantifying the local resolution of cryo-EM density maps. Nat Methods. 2014;11:63–65. doi: 10.1038/nmeth.2727. [DOI] [PMC free article] [PubMed] [Google Scholar]
- 38.Emsley P, Lohkamp B, Scott WG, Cowtan K. Features and development of Coot. Acta Crystallogr D Biol Crystallogr. 2010;66:486–501. doi: 10.1107/S0907444910007493. [DOI] [PMC free article] [PubMed] [Google Scholar]
- 39.Adams PD, et al. PHENIX: a comprehensive Python-based system for macromolecular structure solution. Acta Crystallogr D Biol Crystallogr. 2010;66:213–221. doi: 10.1107/S0907444909052925. [DOI] [PMC free article] [PubMed] [Google Scholar]
- 40.Amunts A, et al. Structure of the yeast mitochondrial large ribosomal subunit. Science. 2014;343:1485–1489. doi: 10.1126/science.1249410. [DOI] [PMC free article] [PubMed] [Google Scholar]
- 41.DiMaio F, Zhang J, Chiu W, Baker D. Cryo-EM model validation using independent map reconstructions. Protein Sci. 2013;22:865–868. doi: 10.1002/pro.2267. [DOI] [PMC free article] [PubMed] [Google Scholar]
- 42.Chen VB, et al. MolProbity: all-atom structure validation for macromolecular crystallography. Acta Crystallogr D Biol Crystallogr. 2010;66:12–21. doi: 10.1107/S0907444909042073. [DOI] [PMC free article] [PubMed] [Google Scholar]
- 43.Schrödinger L. The PyMOL Molecular Graphics System, Version 1.8. 2015 [Google Scholar]
- 44.Pettersen EF, et al. UCSF Chimera–a visualization system for exploratory research and analysis. J Comput Chem. 2004;25:1605–1612. doi: 10.1002/jcc.20084. [DOI] [PubMed] [Google Scholar]
- 45.Morin A, et al. Collaboration gets the most out of software. Elife. 2013;2:e01456. doi: 10.7554/eLife.01456. [DOI] [PMC free article] [PubMed] [Google Scholar]
- 46.Brailoiu E, et al. An NAADP-gated two-pore channel targeted to the plasma membrane uncouples triggering from amplifying Ca2+ signals. J Biol Chem. 2010;285:38511–38516. doi: 10.1074/jbc.M110.162073. [DOI] [PMC free article] [PubMed] [Google Scholar]
- 47.Kawate T, Gouaux E. Fluorescence-detection size-exclusion chromatography for precrystallization screening of integral membrane proteins. Structure. 2006;14:673–681. doi: 10.1016/j.str.2006.01.013. [DOI] [PubMed] [Google Scholar]
Associated Data
This section collects any data citations, data availability statements, or supplementary materials included in this article.
Data Availability Statement
The cryo-EM density maps of the mouse TPC1 have been deposited in the Electron Microscopy Data Bank under accession numbers EMD-7434 for the apo state and EMD-7435 for the PtdIns(3,5)P2-bound state. Atomic coordinates have been deposited in the Protein Data Bank under accession numbers 6C96 for the apo state and 6C9A for the PtdIns(3,5)P2-bound state. Source data for Fig. 3c, Extended Data Fig. 2c and Extended Data Fig. 2e are available in Supplementary Information.