Figure 4.
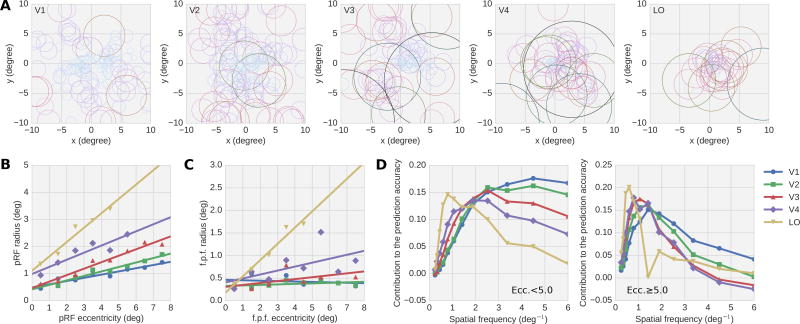
Feature pooling fields and spatial frequency tuning for the Gabor-fwRF model. (A) Panels show data from distinct ROIs (labeled in upper left corner). Each circle shows the feature pooling field of a single voxel (only voxels with ρ > 0.27 are included in these plots). The radius of each circle is the pRF radius (σpRF) estimated from the feature pooling field radius (σf) using the relation of Eq. 5. Circles are color-coded according to radius for ease of interpretation. In early visual areas, receptive fields estimated by the Gabor-fwRF tend to be relatively small and scattered across the visual field; in higher visual areas, they are relatively large and concentrated at the fovea. (B) The average estimated pRF radius (σpRF) is plotted against the pRF eccentricity (which is equivalent to the feature pooling field eccentricity). Color indicates brain ROI. Lines show the best linear fits. Radius increases linearly with eccentricity in all ROIs. (C) The feature pooling field radii also exhibit linear scaling with eccentricity, although they underestimate the pRF radii in all ROIs. (D) Spatial frequency tuning. Curves show the average contribution to the total prediction accuracy of each spatial frequency. As expected, the average preferred spatial frequency shifts downward from perifoveal (left) to peripheral eccentricities (right), and from lower to higher visual brain areas.

