Abstract
Background
Steroid-induced osteonecrosis of the femoral head (SONFH) is a common orthopedic disease associated with the application of glucocorticoid (GC). In this study, we detected the microRNAs (miRNAs) differentially expressed in bone marrow mesenchymal stem cells (BMSCs) from SONFH patients, and target gene predictions were performed, and the functions of the target genes was verified.
Material/Methods
BMSCs collected from patients with SONFH and femoral neck fracture (FNF) constituted the SONFH group (n=3) and FNF (control) group (n=3), respectively. MiRNA microarray analysis was utilized to detect the differentially expressed miRNAs, and quantitative real-time polymerase chain reaction (qRT-PCR) was used to verify the microarray results. The target genes and functions of the differentially expressed miRNAs were analyzed using a bioinformatics database.
Results
The microarray results revealed that compared with the control group, 22 miRNAs were identified differentially expressed in the SONFH group, with 17 upregulated and 5 downregulated. Further qRT-PCR validation of differentially expressed miRNAs confirmed that hsa-miR-601, hsa-miR-452-3p, hsa-miR-647, and hsa-miR-516b-5p were significantly increased, whereas hsa-miR-122-3p was significantly decreased. During osteogenic differentiation, hsa-miR-601, hsa-miR-452-3p, hsa-miR-647, hsa-miR-516b-5p, and hsa-miR-127-5p were significantly downregulated, whereas hsa-miR-122-3p was significantly upregulated, and miRNAs showed a converse tendency during adipogenic differentiation.
Conclusions
Six miRNAs associated with osteogenic and adipogenic differentiation were identified differentially expressed in the BMSCs of SONFH patients; these miRNAs may serve as novel biomarkers or therapeutic targets for SONFH.
MeSH Keywords: Bone Diseases, Femur Head Necrosis, Glucocorticoids, Mesenchymal Stromal Cells, MicroRNAs, Osteogenesis
Background
Steroid-induced osteonecrosis of the femoral head (SONFH) is a serious orthopedic disease associated with the application of glucocorticoid (GC), with progressive osteocyte and bone marrow necrosis resulting in structural changes and even collapse of the femoral head. If the patient fails to obtain effective treatment, osteonecrosis will occur within 2 years of the use of GC in most cases. The femoral head will collapse, and osteoarthritis can become so severe that approximately 70% of patients will need artificial joint replacement, which can lead to debilitation and have a serious impact on quality of life [1]. Up until now, the exact mechanism of SONFH has been largely unknown.
Bone marrow mesenchymal stem cells (BMSCs) are pluripotent stem cells that can differentiate into multiple tissues, including osteocyte, chondrocyte, adipocyte, and endotheliocyte, playing a crucial role in tissue regeneration [2–4]. BMSCs isolated from bone marrow are still considered ideal materials for cytotherapy against various orthopedic diseases [5–7]. The increased adipogenic and decreased osteogenic capability of BMSCs has been reported to be related to SONFH [8]. In addition, BMSCs isolated from SONFH have shown decreased proliferation ability; GC suppresses osteogenesis by inhibition of BMSCs [9]. Thus, investigations of the factors regulating osteogenesis and adipogenesis of BMSCs may provide novel targets for prevention and treatment of SONFH.
MicroRNAs (miRNAs) are small noncoding regulatory RNAs. They inhibit translation or promote mRNA degradation by binding to the 3′-untranslated region (3′-UTR) of their target mRNAs [10]. It has been reported that miRNAs regulate multiple physiological processes, including cell proliferation, differentiation, metabolism, and apoptosis [11]. Bioinformatic analysis has revealed that over one-third of human genes may be regulated by miRNAs, indicating their critical functions in regulating gene expression [12]. Recently, evidence has indicated that miRNAs directly participate in the pathogenesis of numerous orthopedic disorders such as osteosarcoma, osteonecrosis, osteoarthritis, and osteoporosis [13–15]. However, changes in miRNAs in BMSCs induced by GC remain to be fully demonstrated.
In our study, we isolated and cultured BMSCs from SONFH patients and femoral neck fracture (FNF) patients, and we screened differentially expressed miRNAs using miRNA microarrays. We identified 5 differentially expressed miRNAs in BMSCs from SONFH patients with 4 upregulated miRNAs (hsa-miR-601, hsa-miR-452-3p, hsa-miR-647, and hsa-miR-516b-5p) and 1 downregulated miRNA (hsa-miR-122-3p). Their target genes and related signaling pathways were predicted by bioinformatics analysis. Additionally, the expression variation trend of the differentially expressed miRNAs during osteogenic and adipogenic differentiation were detected to demonstrate the crucial regulation effect of miRNA during the SONFH pathogenetic process.
Material and Methods
Sample selection
This research was approved by Ethics Committee of Jilin University, The Second Hospital, and all the patients involved in this research signed the written informed consents. The BMSCs used in this research were obtained from 9 patients with non-traumatic osteonecrosis of the femoral head (ONFH) and 11 patients with FNF who received total hip arthroplasty from May 2016 to March 2017 in the Department of Orthopedics, The Second Hospital of Jilin University, China.
All the patients with non-traumatic ONFH involved in this research declare a history of hormone application for more than a year. Preoperative radiograph, computed tomography (CT), and magnetic resonance imaging (MRI) were conducted to make the diagnosis of non-traumatic ONFH. According to Ficat and Arlet staging system, all the patients with non-traumatic ONFH were classified as stage III or IV. The cases involved in this research declare no history of explicit trauma, tumors, other metabolic bone diseases, previous hip surgery, or infectious disease.
Because we were not able to obtain bone marrow from the upper femoral medullary cavity of healthy persons, the bone marrow from the FNF patients were used as the control group. The FNF patient bone marrow was obtained within 48 hours after trauma. The preoperative radiograph was conducted to confirm that the femoral head had no necrotic area. Patients older than 80 years of age, patients with a pathological fracture, and patients with a history of metabolic bone diseases or infectious disease were excluded.
Cell isolation, culture and identification
The bone marrow was obtained from upper femoral medullary cavity during surgery, and BMSCs were isolated from the bone marrow by density gradient separation as previously reported [7]. An equal volume of Percoll Solution (Sigma, USA) was used to separate mononuclear cells at centrifugation for 30 min at 2000 rpm. Then cells were suspended in regular growth medium and adhered on a 55 cm2 culture dish (Corning, USA). Growth medium contained 10% fetal bovine serum (Gibco, USA), 90% low glucose DMEM (HyClone, USA), 100 units/mL penicillin, and 100 mg/mL streptomycin. Cells were cultured in a humidified incubator with 5% CO2 at 37°C.
BMSCs were analyzed for the expression of CD29, CD90, and CD34 by flow cytometry. About 5×10⁴ cells were stained with 20 μL of mouse anti-human CD34-FITC, CD90-FITC, and CD29-PE antibodies for 30 min at room temperature. The cells were analyzed for fluorescence by flow cytometry.
RNA isolation and miRNA microarray analysis
Total RNA was extracted with TRIzol reagent (Invitrogen, USA) by standard protocols. RNase-free water was added to resuspended RNA. Then a spectrophotometer was used to detect the concentration, and agarose gel electrophoresis was used to confirm the purity and integrity of the total RNA.
We chose 6 samples, 3 samples for the SONFH group and 3 samples for the FNF group, to use for microarray analysis. Then, 1 μg total RNA was labeled with miRCURYTM Array Power Labeling kit (Cat #208032-A, Exiqon). After stopping the labeling procedure, the Hy3™-labeled samples were hybridized to the miRCURYTM LNA Array (v.19.0) (Exiqon) according to the procedure in the array manual. Axon GenePix 4000B microarray scanner was used to scan and acquire the images of the miRNA microarrays. Then these images were transformed into digital signals using GenePix Pro 6.0 (Axon) for normalization and data extraction. Finally, hierarchical clustering was performed to show distinguishable miRNA expression profiling among samples.
qRT-PCR analysis of miRNA expression
To confirm the differentially expressed miRNAs detected by miRNA microarray analysis, 2.0 μg of total RNA was reverse transcribed with the All-in-One miRNA first-strand cDNA synthesis kit (GeneCopoeia, Rockville, MD, USA). The obtained cDNA was diluted 1: 5 for further quantitative real-time polymerase chain reaction (qRT-PCR). Measurements were performed in triplicate on a LightCycler 480 (Roche Diagnostics, Basel, Switzerland); miRNA levels were measured using an All-in-One miRNA quantitative PCR detection kit with specific miRNA primers (GeneCopoeia). RNA U6 was used as a normalization control for miRNA expression. Quantification and the fold change of miRNA expression was calculated with the ΔΔCt method, in which the ratio of expression between the experimental group and the control group was determined.
Osteogenic and adipogenic differentiation of BMSCs in vitro
BMSCs were plated in 6-well plates in growth medium. Growth medium was respectively replaced with human mesenchymal stem cell osteogenic differentiation medium (catalog No. HUXMA-90021; Cyagen, China) and human mesenchymal stem cell adipogenic differentiation medium (catalog No. HUXMA-90031; Cyagen, China). The process of inducing differentiation lasted for 10–20 days, and induction medium was changed according to the instructions of the manufacturer. In the process of inducing differentiation, the total RNA of the osteogenic differentiation group was extracted at the 3rd, 6th, and 9th day, and total RNA of the adipogenic differentiation group was extracted at the 4th, 8th, 12th, and 16th day. The cDNA was transcribed, and the miRNA levels were measured with by qRT-PCR.
miRNA target prediction
The online miRNA target predicting software, miRDB V5 (http://www.mirdb.org/), TargetScan Human 7.1 (http://targetscan.org/) was utilized to determine target prediction of the differentially expressed miRNAs. The target genes listed in both miRDB V5 and TargetScan Human 7.1 were intersected to obtain the target genes with greater accuracy. Then, the listed targets were performed using Gene Ontology (GO) and Kyoto Encyclopedia of Genes and Genomes (KEGG) analysis for functional analysis of the differentially expressed miRNAs.
qRT-PCR analysis of mRNA expression
For mRNA analysis, 1 μg of total RNA was reverse transcribed using a TransScript All-in-One First-Strand cDNA Synthesis SuperMix for qPCR (Transgen biotech, Beijing, China) in a 20 μL reaction volume. And then qPCR was performed using a reaction mixture that contained 1 μL of the cDNA, 10 μmol/L gene-specific primers (GeneCopoeia), and 10 μL of 2× Fast SYBR Green Master Mix (GeneCopoeia). Measurements were performed in triplicate on a LightCycler 480 (Roche Diagnostics, Basel, Switzerland). Quantification and the fold change of mRNA expression was calculated with the ΔΔCt method, in which the ratio of expression between an experimental group and the control group was determined.
Statistical analysis
SPSS Statistics 17.0 software was used for statistical analysis. All data were presented as mean ± standard deviation. Data comparisons were analyzed using the Student’s t-test. A P value < 0.05 was considered significant.
Results
Clinical information of the cases
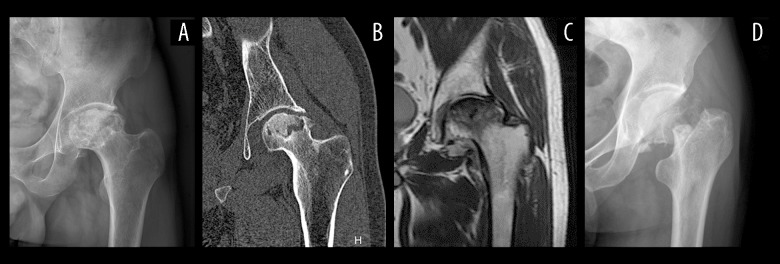
Eleven patients with FNF and 9 patients with SONFH were involved in our study; the essential information of these patients is listed in Table 1. The result of radiograph, CT, and MRI of SONFH patients showed severe osteoarthritis occurred on the load-bearing surface of the hip joint, and the osteoarthritis became so severe that the surface of the femoral head collapse and became flat (Figure 1A–1C). As for FNF patients, the articular surface of the hip joint was complete and smooth, and a fracture line was observed around the femoral neck area in radiograph (Figure 1D).
Table 1.
Clinical characteristics of the subjects.
| No. | Gender | Age | Diagnosis | Basic disease | Duration of GC application |
|---|---|---|---|---|---|
| A1 | M | 64 | Left FNF | – | – |
| A2 | M | 62 | Right FNF | – | – |
| A3 | F | 70 | Right FNF | – | – |
| A4 | M | 59 | Right FNF | – | – |
| A5 | F | 66 | Right FNF | – | – |
| A6 | F | 58 | Left FNF | – | – |
| A7 | F | 60 | Right FNF | – | – |
| A8 | F | 62 | Left FNF | – | – |
| A9 | M | 69 | Left FNF | – | – |
| A10 | F | 64 | Right FNF | – | – |
| A11 | M | 65 | Left FNF | – | – |
| B1 | F | 52 | Left ONFH | Asthma | 3 years |
| B2 | F | 64 | Bilateral ONFH | Asthma | 2 years |
| B3 | F | 60 | Right ONFH | SLE | 1.5 years |
| B4 | M | 69 | Right ONFH | Asthma | 1 year |
| B5 | M | 55 | Left ONFH | ILD | 1 year |
| B6 | F | 68 | Right ONFH | SLE | 1.5 years |
| B7 | F | 68 | Bilateral ONFH | Asthma | 4 year |
| B8 | F | 56 | Right ONFH | SLE | 2 years |
| B9 | M | 61 | Right ONFH | ILD | 2 years |
Figure 1.
Radiological characteristic SONFH and FNF. (A) Radiograph of SONFH. (B) CT of SONFH. (C) MRI of SONFH. (D) Radiograph of FNF. SONFH – steroid-induced osteonecrosis of the femoral head; FNF – femoral neck fracture; CT – computed tomography; MRI – magnetic resonance imaging.
Morphology and phenotype of BMSCs
With the initial change of the growth medium, the spindle morphology of BMSCs adherent on the plate was observed. The cells proliferated rapidly and after 14 days of culture, they reached almost 80% confluences (Figure 2).
Figure 2.
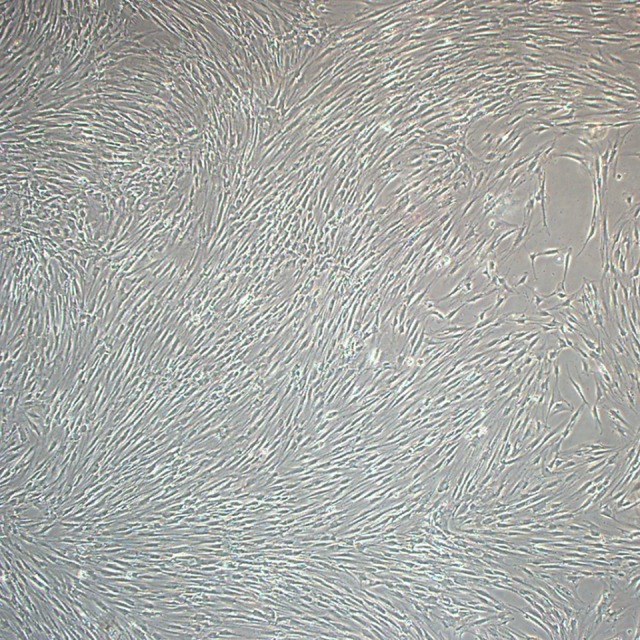
Bone marrow mesenchymal stem cells were observed by light microscopy (magnification, 40×) in primary culture on the 14th day.
For further confirmation that the isolated cells were BMSCs, 3 BMSC specific surface antigens were characterized by flow cytometry. The results of flow cytometry showed that the cells that we obtained showed high expression levels of CD29 and CD90, and negative expression levels of CD34 which is reported as one of the hematopoietic lineage markers (Figure 3). According to the present study, the cells were identified as human BMSCs.
Figure 3.
Flow cytometric analysis indicated that our cells were human bone marrow mesenchymal stem cells (BMSCs). The results showed that BMSCs were positive for CD29 (A) and CD90 (B) and negative for CD34 (C).
miRNA expression profiles
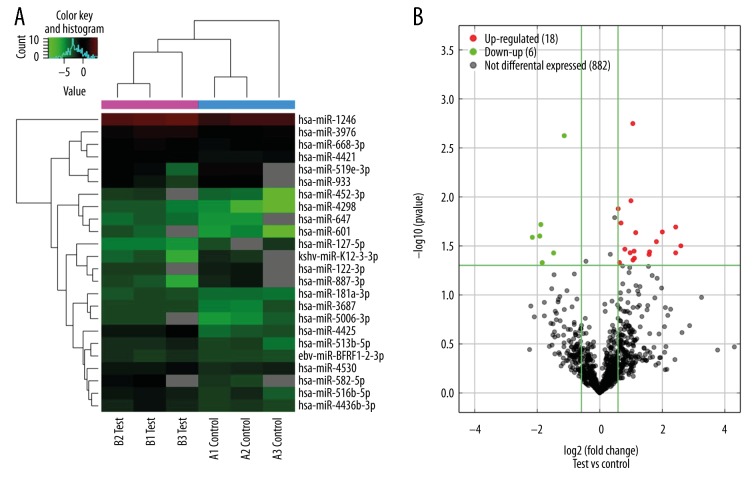
MiRNA microarray detected 22 significantly differentially expressed miRNAs in the BMSCs from the SONFH group compared with the FNF group: 17 miRNAs were upregulated, namely, hsa-miR-4298, hsa-miR-4425, hsa-miR-601, hsa-miR-452-3p, hsa-miR-582-5p, hsa-miR-647, hsa-miR-5006-3p, hsa-miR-516b-5p, hsa-miR-668-3p, hsa-miR-513b-5p, hsa-miR-3687, hsa-miR-181a-3p, hsa-miR-1246, hsa-miR-4436b-3p, hsa-miR-3976, hsa-miR-4530, and hsa-miR-4421, and 5 miRNAs were downregulated, namely, hsa-miR-127-5p, hsa-miR-887-3p, hsa-miR-519e-3p, hsa-miR-933, and hsa-miR-122-3p (Table 2). The hierarchical clustering depicted the differentially expressed miRNAs between the 3 groups (Figure 4A). The volcano plot reflects the differentially expressed miRNAs between the SONFH group and the FNF group (Figure 4B).
Table 2.
miRNA microarry result: miRNAs with significantly different expression in the BMSCs of SONFH patients.
| miRNA | Fold change | P-value | |
|---|---|---|---|
| Upregulation | hsa-miR-4298 | 6.05 | 0.03 |
| hsa-miR-4425 | 5.39 | 0.02 | |
| hsa-miR-601 | 5.39 | 0.04 | |
| hsa-miR-452-3p | 4.01 | 0.02 | |
| hsa-miR-582-5p | 3.52 | 0.03 | |
| hsa-miR-647 | 3.02 | 0.04 | |
| hsa-miR-5006-3p | 2.99 | 0.04 | |
| hsa-miR-516b-5p | 2.22 | 0.02 | |
| hsa-miR-668-3p | 2.16 | 0.04 | |
| hsa-miR-513b-5p | 2.14 | 0.04 | |
| hsa-miR-3687 | 2.09 | 0.04 | |
| hsa-miR-181a-3p | 2.08 | 0 | |
| hsa-miR-1246 | 2 | 0.01 | |
| hsa-miR-4436b-3p | 1.97 | 0.04 | |
| hsa-miR-3976 | 1.75 | 0.03 | |
| ebv-miR-BHRF1-2-3p | 1.6 | 0.02 | |
| hsa-miR-4530 | 1.55 | 0.05 | |
| hsa-miR-4421 | 1.51 | 0.01 | |
| Downregulation | hsa-miR-127-5p | 0.22 | 0.03 |
| hsa-miR-887-3p | 0.27 | 0.03 | |
| hsa-miR-519e-3p | 0.27 | 0.02 | |
| kshv-miR-K12-3-3p | 0.28 | 0.05 | |
| hsa-miR-933 | 0.36 | 0.04 | |
| hsa-miR-122-3p | 0.46 | 0 |
Figure 4.
Hierarchical clustering analysis (A) of the differentially expressed miRNAs. Red grid indicates relatively high expression, and green grid indicates relatively low expression. Volcano plot (B) of the differentially expressed miRNAs. The vertical lines correspond to 1.5-fold upregulation and downregulation, and the horizontal line represents a P value of 0.05. The red and green point in the plot represents the upregulated and downregulated miRNAs with statistical significance.
miRNA expression validation by qRT-PCR
We performed qRT-PCR analysis to detect the expression values of the miRNAs scanned out by microarray analysis. The result of qRT-PCR analysis revealed that between the SONFH group and the FNF group, 4 miRNAs were upregulated (hsa-miR-601, hsa-miR-452-3p, hsa-miR-647, and hsa-miR-516b-5p) and 1 was downregulated (hsa-miR-122-3p), which was consistent with the microarray result (Figure 5).
Figure 5.
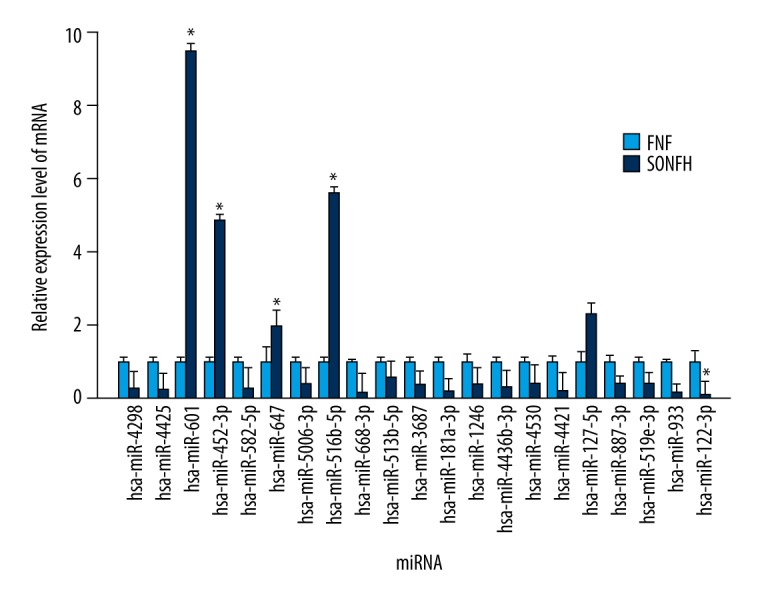
qRT-PCR verification of the expression of the differentially expressed miRNAs. The data are averages of 3 independent experiments (mean ±SD); * P<0.05 versus femoral neck fracture (control) group.
Expression variation trend of the confirmed miRNAs during osteogenic and adipogenic differentiation of BMSCs
To investigate the role of the differentially expressed miRNAs in osteogenic and adipogenic differentiation of BMSCs, BMSCs were harvested at exact time points during the differentiation process (0, 3, 6, and 9 days for osteogenic differentiation, and 0, 4, 8, 12, and 16 days for adipogenic differentiation), and expression of miRNAs was determined by qRT-PCR. Because it has been reported as an osteogenic regulator, the expression level of miR-127-5p was also detected during BMSC differentiation.
Compared with that of untreated control BMSCs (day 0), the expression of miR-601, miR-452-3p, miR-516b-5p, and miR-127-5p showed a significantly downward trend during osteogenic differentiation. The expression of miR-647 increased slightly at day 3, and then decreased during the osteogenic process. Whereas the expression level of miR-122-3p showed a significantly upward trend compared with the control (Figure 6).
Figure 6.
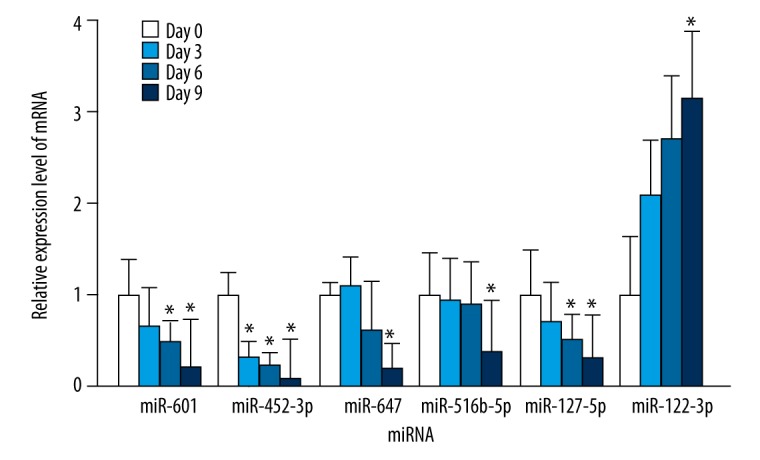
The endogenous expression levels of miR-601, miR-452-3p, miR-647, miR-516b-5p, miR-127-5p, and miR-122-3p were measured by qRT-PCR at exact time points during osteogenic differentiation (0, 3, 6, and 9 days) of bone marrow mesenchymal stem cells. The data are averages of 3 independent experiments (mean ±SD); * P<0.05 versus day 0.
As to adipogenic differentiation, the expression levels of miR-601, miR-452-3p, miR-647, miR-516b-5p, and miR-127-5p showed a significantly upward trend, and the amount of expression was the highest on the 8th or 12th day. Conversely, the expression decreased significantly on the 4th and 8th day compared with the control (Figure 7).
Figure 7.
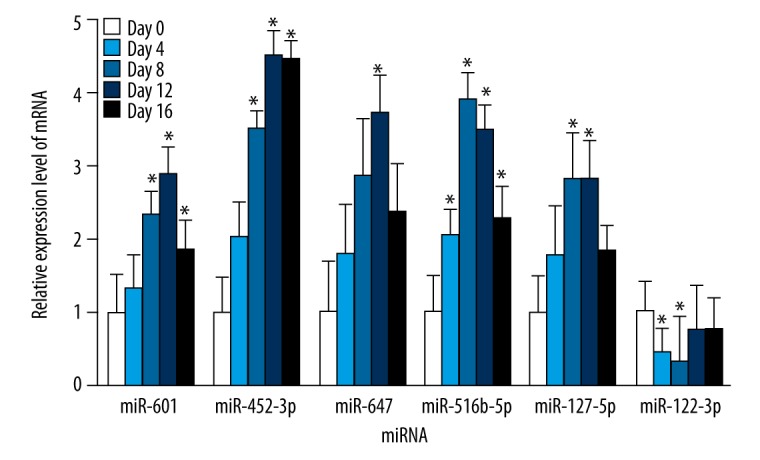
The endogenous expression levels of miR-601, miR-452-3p, miR-647, miR-516b-5p, miR-127-5p, and miR-122-3p were measured by qRT-PCR at exact time points during adipogenic differentiation (0, 4, 8, 12, and 16 days) of bone marrow mesenchymal stem cells. The data are averages of 3 independent experiments (mean ±SD); * P<0.05 versus day 0.
These results suggested that miR-601, miR-452-3p, miR-647, miR-516b-5p, and miR-127-5p might be negative regulators of osteogenic differentiation of BMSCs which can promote adipogenic differentiation, whereas miR-122-3p plays the opposite role.
Target prediction
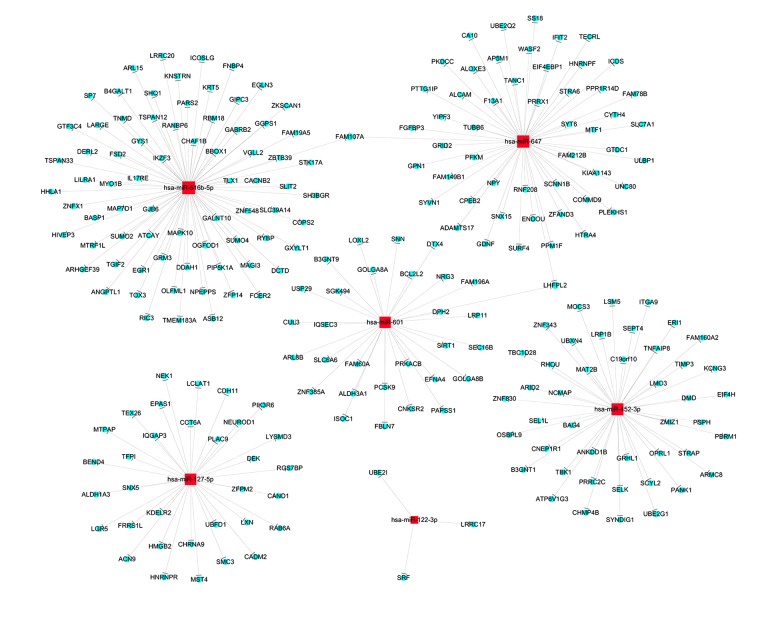
To investigate the possible targets of the 6 miRNAs confirmed by qRT-PCR, we used the online bioinformatics database miRDB V5 and TargetScan Human 7.1 to identify potential targets. The target genes both listed in miRDB V5 and TargetScan Human 7.1 were intersected to obtain the target genes with greater accuracy. A total of 238 genes were predicted as the target genes of the 6 differentially expressed miRNAs. Figure 8 shows the target prediction interactive network of the miRNAs and potential targets.
Figure 8.
Target prediction interactive network of the differentially expressed miRNAs. The red squares and blue round respectively represented the miRNA and target genes.
Go and KEGG analysis
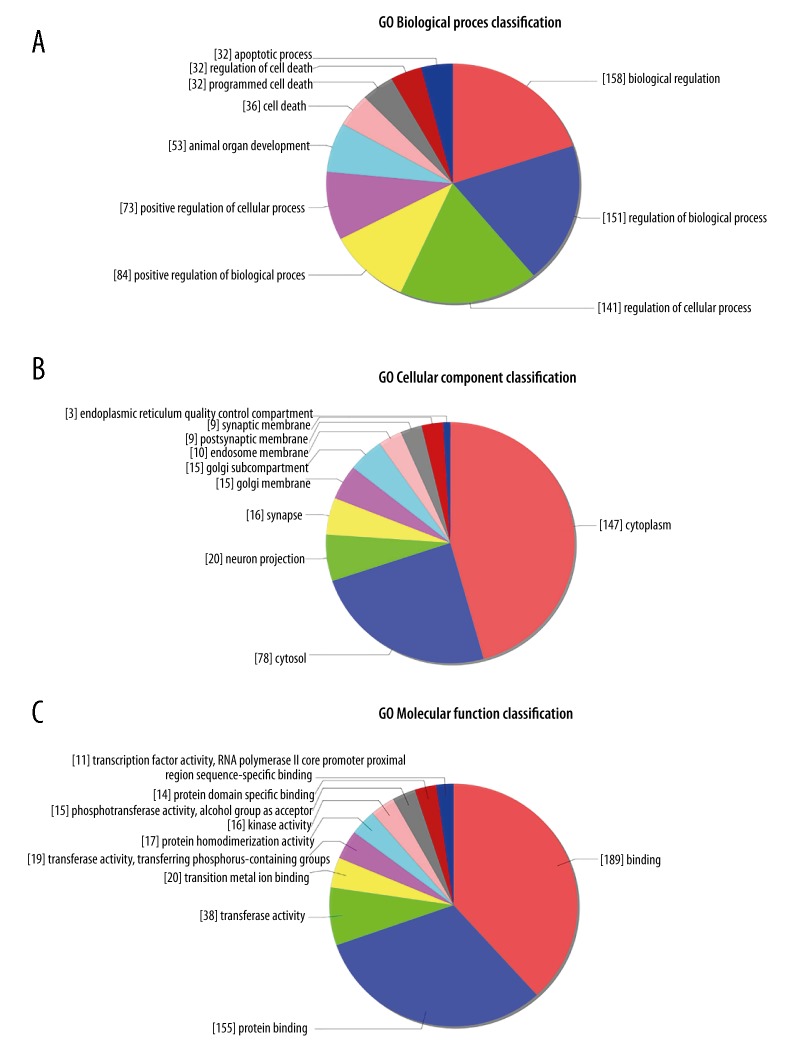
To investigate the function of the 6 differentially expressed miRNAs, we performed GO and KEGG analysis for further functional analysis. GO analysis predicts the biological functions of the target genes from 3 aspects: biological process (BP), cellular component (CC), and molecular function (MF). The results of BP analysis revealed that the targets mostly participate in biological regulation (158), biological process (151), and cellular process (141) (Figure 9A). The predicted target genes mostly function in the cytoplasm (147) and the cytosol (78) in the result of CC analysis (Figure 9B). The result of the MF analysis indicated that the molecular functions of the targets were mainly binding (189) (Figure 9C).
Figure 9.
GO (Gene Ontology) enrichment analysis of the predicted targets of the differentially expressed miRNAs. Distribution of the targets of the differentially expressed miRNAs from three aspects including biological process (A), cellular component (B), molecular function (C).
KEGG analysis focused on predicting the signaling pathway regulated by the 6 differentially expressed miRNAs. The predicted targets enriched mostly in the signaling pathways including phenylalanine metabolism, vibrio cholerae infection, dilated cardiomyopathy (DCM), ubiquitin mediated proteolysis, other types of O-glycan biosynthesis, mannose type O-glycan biosynthesis, choline metabolism in cancer, histidine metabolism, glycolysis/gluconeogenesis, protein processing in endoplasmic reticulum, which might play crucial regulatory roles in the development of SONFH (Figure 10).
Figure 10.
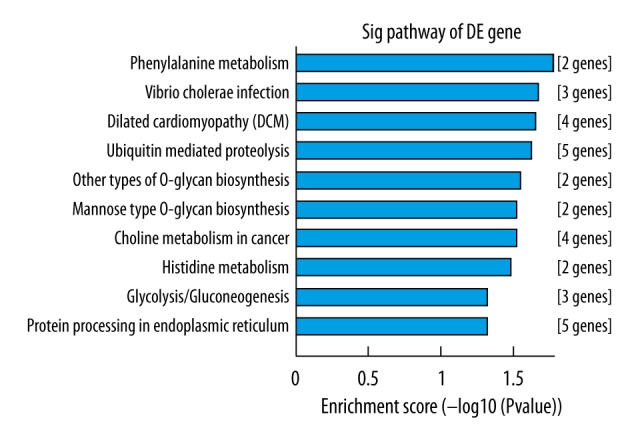
KEGG (Kyoto Encyclopedia of Genes and Genomes) enrichment analysis of the predicted targets of the differentially expressed miRNAs. The vertical axis is the enriched pathway category, and the horizontal axis is the –log10 P value of the enrichment of pathways.
Validation of mRNA expression by qRT-PCR
For further studies on miRNAs functions in BMSCs during the SONFH pathogenetic process, qRT-PCR was utilized to detect the expression values of crucial genes and predicted targets by bioinformatics analysis, including SIRT1, TP53, PPARγ, PPARγC1A, FOXO1, EFNA4, PAPSS1, LOXL2, MAPK10, SRF, CUL5, SEPT4, TBK1, and LRRC17. Compared with the control, SIRT1, EFNA4, PAPSS1, and LOXL2 predicted as target genes of miR-601 were significantly downregulated in the SONFH group; SEPT4 and TBK1 predicted as target genes of miR-452-3p decreased significantly; and MAPK10 predicted as target genes of miR-516b-5p was significantly downregulated, whereas LRRC17 predicted as target genes of miR-122-3p increased significantly (Figure 11). TP53, PPARγ, and FOXO1 which are the crucial genes in cancer pathogenesis and BMSCs differentiation, were downregulated in the SONFH group, whereas PPARγC1A increased significantly (Figure 11).
Figure 11.
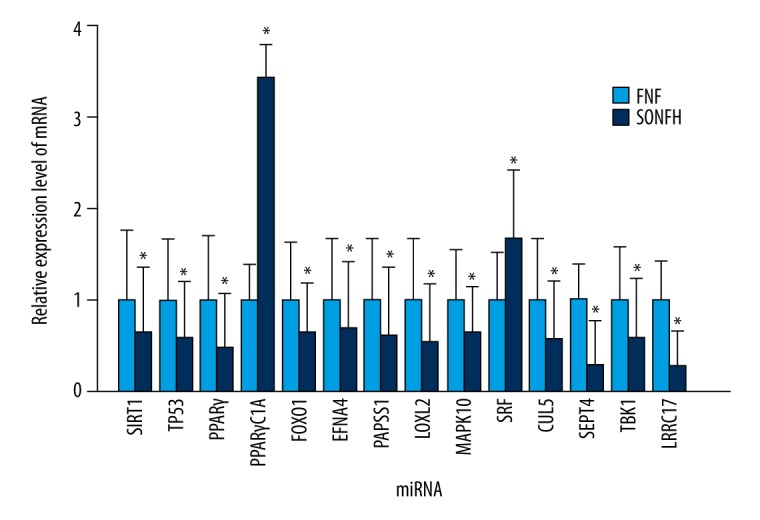
qRT-PCR verification of the expression of the crucial genes and predicted targets of the differentially expressed miRNAs predicted by bioinformatics analysis. The data are averages of 3 independent experiments (mean ±SD); * P<0.05 versus FNF (control) group. FNF, femoral neck fracture.
Discussion
The pathological process for the development of SONFH is complicated. Multiple factors can cause the death of osteocytes and bone marrow, leading to structural changes in the femoral head which may even be followed by femoral head collapse and joint dysfunction. The use of GC has been identified as the first factor in developing non-traumatic ONFH [16]. GC use can lead to intramedullary adipogenesis, vascular endothelial injury, microvascular thrombosis, and intramedullary hypertension, resulting in insufficient blood supply to the femoral head [17]. Eventually, femoral head ischemia and osteocyte death leads to structural changes, and ONFH occurs. In the last few years, the role of BMSCs in the pathogenesis of ONFH has received extensive attention. BMSCs are pluripotent stem cells that can differentiate into multiple bone matrix cells such as osteocyte, adipocyte, osteoblast, and osteoclast. In vivo, bone is continuously remodeled by a balance between osteogenesis and osteoclast throughout life; the decreased osteogenic potential and the increased adipogenic potential of BMSCs can break this balance, resulting in decreased osteogenesis and increased intramedullary adipogenesis and osteonecrosis [18]. It has been reported that BMSCs isolated from patients with SONFH show lower efficiency of colony formation compared with healthy controls, indicating reduced activity of BMSCs in patients with SONFH [19]. High concentration of dexamethasone can suppress the expression of Runx2/Cbfa1 in BMSCs and promote the expression of PPARγ and Dickkopf-1, leading to dysfunction of BMSCs and imbalances in osteogenesis and osteoclasts [20,21]. Based on these previous studies, BMSC has been considered to be closely related to the pathogenesis of SONFH. MiRNAs are small noncoding regulatory RNAs that inhibit translation or promote mRNA degradation by binding to the 3′untranslated region of their target mRNAs through complementary base pairing. In recent years, there have been continued reports of the regulatory effect of miRNAs on BMSCs. Many miRNAs have been confirmed as signaling pathway nodes participating in the osteogenesis processes. For example, miR-93-5p, miR-340, miR-708, and miR-1827 have been reported to regulate the osteogenic differentiation of BMSCs [22–25]. Furthermore, miR-27a and miR-188 have been shown to be key regulators for the shift between osteogenic and adipogenic differentiation of BMSCs [26,27].
In our study, microarray analysis was used to investigate the differentially expressed miRNAs in BMSCs from SONFH patients. We found 17 upregulated and 5 downregulated miRNAs that were detected using miRNA microarray analysis. To verify the result of the microarray analysis, the expression level of 21 differentially expressed miRNAs (except has-miR-3976) were detected by qRT-PCR. The expression level of miR-601, miR-452-3p, miR-647, and miR-516b-5p increased significantly and the level of miR-122-3p decreased significantly in BMSCs isolated from SONFH patients, which was in accordance with microarray results. In consideration of a previous investigation that demonstrated that miR-127-5p promotes chondrogenic differentiation of BMSCs by targeting osteopontin (OPN), miR-127-5p was also included in our study despite results of miRNA microarray and qRT-PCR being opposite [28,29]. The expression levels of the 6 miRNAs (miR-601, miR-452-3p, miR-647, miR-516b-5p, miR-127-5p, and miR-122-3p) were detected during osteogenic and adipogenic differentiation. In the process of osteogenic differentiation, we identified 5 miRNAs (miR-601, miR-452-3p, miR-647, miR-516b-5p, and miR-127-5p) that were on a declining curve, while miRNA-122-3p presented on a rising curve. As to adipogenic differentiation, the expression level tendency of the 6 miRNAs were contrary to osteogenic differentiation. These findings indicate that the 6 miRNAs had an intimate correlation to the osteogenic and adipogenic differentiation of BMSCs.
In previous studies, many target genes of miRNAs have been identified using luciferase reporter assay. Sirtuin 1 (SIRT1) has been confirmed as a direct target of miR-601 using luciferase reporter assay in research of pancreatic cancer [30]. SIRT1 is a NAD+-dependent lysine deacetylase mediating multiple signaling pathways, which has also been identified to suppress BMSCs adipogenesis by activating Wnt/β-catenin signaling in vivo and in vitro [31]. SIRT1 has also been reported to play key roles in p53 and NF-κB signaling pathway [32]. According to the result of qRT-PCR, SIRT1 was downregulated in the BMSCs isolated from SONFH patients, which was contrary to miR-601 results. Combining the previous investigation with our experiment, we speculate that miRNA-601 may promote SONFH and suppress osteogenic differentiation by targeting SIRT1. PTP4A1 has also been confirmed as a direct target of miR-601 using luciferase reporter assay in research of breast cancer [33]. These findings should be further explored in future research. miR-122 is a crucial regulatory factor which has been reported to directly participate in regulating the pathogenetic process of digestive system diseases, like pancreatitis, hepatocellular carcinoma, and hepatitis C virus (HCV). miR-122 can also act as a potential circulating biomarker of drug-induced liver injury [34]. miR-122 participates in lipid metabolism regulation and plays an important role in lipid (particularly TG) accumulation in the liver by reducing YY1 mRNA stability to upregulate FXR-SHP signaling [35]. However, the regulation mechanism of miR-122-3p in the pathogenesis of SONFH is not clear. With the regulation effect of miR-122-3p associated with the pathogenesis of digestive system diseases, research related to miR-122-3p regulation of BMSCs should continue to make progress.
There were several limitations of this study. Although this was the first time that these 6 miRNAs have been reported to be differentially expressed in BMSCs of SONFH, the exact targets of the miRNAs and the specific regulatory mechanism was not fully explored. The relationship between the differentially expressed miRNAs and abnormal biological states, such as BMSCs dysfunction, apoptosis, or lipid metabolism disorder, remains largely unclear. These should be discussed in further studies.
Conclusions
Six miRNAs associated with osteogenic and adipogenic differentiation were identified differentially expressed in the BMSCs of SONFH patients, and 14 mRNAs which are possible targets of the differentially expressed miRNAs were proven to be differentially expressed in the BMSCs of SONFH. To our knowledge, these 6 miRNAs are the first reported to be related to the pathogenetic process of SONFH. However, without the application of luciferase reporter assay, we were not able to confirm the exact targets of these miRNAs, or their exact regulatory effect on SONFH. The regulatory mechanism of these miRNAs in the pathogenetic process of SONFH will be further explored in future studies.
Footnotes
Source of support: This research was financially supported by the National Natural Science Foundation of China (No. 81171681), Scientific Development Program of Jilin Province (Nos. 20160101109JC, 20150414006GH, 20150312028ZG and 20130206060GX)
Conflicts of interest
None.
References
- 1.Koo KH, Kim R, Kim YS, et al. Risk period for developing osteonecrosis of the femoral head in patients on steroid treatment. Clin Rheumatol. 2002;21:299–303. doi: 10.1007/s100670200078. [DOI] [PubMed] [Google Scholar]
- 2.Seo BM, Miura M, Gronthos S, et al. Investigation of multipotent postnatal stem cells from human periodontal ligament. Lancet. 2004;364:149–55. doi: 10.1016/S0140-6736(04)16627-0. [DOI] [PubMed] [Google Scholar]
- 3.Brennan MA, Renaud A, Guilloton F, et al. Inferior in vivo osteogenesis and superior angiogeneis of human adipose tissue: A comparison with bone marrow-derived stromal stem cells cultured in xeno-free conditions. Stem Cells Transl Med. 2017;6:2160–72. doi: 10.1002/sctm.17-0133. [DOI] [PMC free article] [PubMed] [Google Scholar]
- 4.Davies OG, Cooper PR, Shelton RM, et al. A comparison of the in vitro mineralisation and dentinogenic potential of mesenchymal stem cells derived from adipose tissue, bone marrow and dental pulp. J Bone Miner Metab. 2015;33:371–82. doi: 10.1007/s00774-014-0601-y. [DOI] [PubMed] [Google Scholar]
- 5.Yim RL, Lee JT, Bow CH, et al. A systematic review of the safety and efficacy of mesenchymal stem cells for disc degeneration: insights and future directions for regenerative therapeutics. Stem Cells Dev. 2014;23:2553–67. doi: 10.1089/scd.2014.0203. [DOI] [PMC free article] [PubMed] [Google Scholar]
- 6.Ruiz M, Cosenza S, Maumus M, et al. Therapeutic application of mesenchymal stem cells in osteoarthritis. Expert Opin Biol Ther. 2016;16:33–42. doi: 10.1517/14712598.2016.1093108. [DOI] [PubMed] [Google Scholar]
- 7.Pittenger MF, Mackay AM, Beck SC, et al. Multilineage potential of adult human mesenchymal stem cells. Science. 1999;284:143–47. doi: 10.1126/science.284.5411.143. [DOI] [PubMed] [Google Scholar]
- 8.Sun Z, Yang S, Ye S, et al. Aberrant CpG islands’ hypermethylation of ABCB1 in mesenchymal stem cells of patients with steroid-associated osteonecrosis. J Rheumatol. 2013;40:1913–20. doi: 10.3899/jrheum.130191. [DOI] [PubMed] [Google Scholar]
- 9.Li H, Li T, Fan J, et al. miR-216a rescues dexamethasone suppression of osteogenesis, promotes osteoblast differentiation and enhances bone formation, by regulating c-Cbl-mediated PI3K/AKT pathway. Cell Death Differ. 2015;22:1935–45. doi: 10.1038/cdd.2015.99. [DOI] [PMC free article] [PubMed] [Google Scholar]
- 10.Thomson DW, Dinger ME. Endogenous microRNA sponges: Evidence and controversy. Nat Rev Genet. 2016;17:272–83. doi: 10.1038/nrg.2016.20. [DOI] [PubMed] [Google Scholar]
- 11.Shenoy A, Blelloch RH. Regulation of microRNA function in somatic stem cell proliferation and differentiation. Nat Rev Mol Cell Biol. 2014;15:565–76. doi: 10.1038/nrm3854. [DOI] [PMC free article] [PubMed] [Google Scholar]
- 12.Lewis BP, Burge CB, Bartel DP. Conserved seed pairing, often flanked by adenosines, indicates that thousands of human genes are microRNA targets. Cell. 2005;120:15–20. doi: 10.1016/j.cell.2004.12.035. [DOI] [PubMed] [Google Scholar]
- 13.Taipaleenmaki H. Regulation of bone metabolism by microRNAs. Curr Osteoporos Rep. 2018;16(1):1–12. doi: 10.1007/s11914-018-0417-0. [DOI] [PubMed] [Google Scholar]
- 14.Michou L. Epigenetics of bone diseases. Joint Bone Spine. 2017 doi: 10.1016/j.jbspin.2017.12.003. [Epub ahead of print] [DOI] [PubMed] [Google Scholar]
- 15.Krzeszinski JY, Wei W, Huynh H, et al. miR-34a blocks osteoporosis and bone metastasis by inhibiting osteoclastogenesis and Tgif2. Nature. 2014;512:431–35. doi: 10.1038/nature13375. [DOI] [PMC free article] [PubMed] [Google Scholar] [Retracted]
- 16.Fukushima W, Fujioka M, Kubo T, et al. Nationwide epidemiologic survey of idiopathic osteonecrosis of the femoral head. Clin Orthop Relat Res. 2010;468:2715–24. doi: 10.1007/s11999-010-1292-x. [DOI] [PMC free article] [PubMed] [Google Scholar]
- 17.Weinstein RS. Clinical practice. Glucocorticoid-induced bone disease. N Engl J Med. 2011;365:62–70. doi: 10.1056/NEJMcp1012926. [DOI] [PubMed] [Google Scholar]
- 18.Fakhry M, Hamade E, Badran B, et al. Molecular mechanisms of mesenchymal stem cell differentiation towards osteoblasts. World J Stem Cells. 2013;5:136–48. doi: 10.4252/wjsc.v5.i4.136. [DOI] [PMC free article] [PubMed] [Google Scholar]
- 19.Wang BL, Sun W, Shi ZC, et al. Decreased proliferation of mesenchymal stem cells in corticosteroid-induced osteonecrosis of femoral head. Orthopedics. 2008;31:444. doi: 10.3928/01477447-20080501-33. [DOI] [PubMed] [Google Scholar]
- 20.Hornstein E, Mansfield JH, Yekta S, et al. The microRNA miR-196 acts upstream of Hoxb8 and Shh in limb development. Nature. 2005;438:671–74. doi: 10.1038/nature04138. [DOI] [PubMed] [Google Scholar]
- 21.Choo SW, Russell S. Genomic approaches to understanding Hox gene function. Adv Genet. 2011;76:55–91. doi: 10.1016/B978-0-12-386481-9.00003-1. [DOI] [PubMed] [Google Scholar]
- 22.Zhang Y, Wei QS, Ding WB, et al. Increased microRNA-93-5p inhibits osteogenic differentiation by targeting bone morphogenetic protein-2. PLoS One. 2017;12:e0182678. doi: 10.1371/journal.pone.0182678. [DOI] [PMC free article] [PubMed] [Google Scholar]
- 23.Zhao H, Zhang J, Shao H, et al. miRNA-340 inhibits osteoclast differentiation via repression of MITF. Biosci Rep. 2017;37(4) doi: 10.1042/BSR20170302. pii: BSR20170302. [DOI] [PMC free article] [PubMed] [Google Scholar]
- 24.Hao C, Yang S, Xu W, et al. MiR-708 promotes steroid-induced osteonecrosis of femoral head, suppresses osteogenic differentiation by targeting SMAD3. Sci Rep. 2016;6:22599. doi: 10.1038/srep22599. [DOI] [PMC free article] [PubMed] [Google Scholar]
- 25.Zhu S, Peng W, Li X, et al. miR-1827 inhibits osteogenic differentiation by targeting IGF1 in MSMSCs. Sci Rep. 2017;7:46136. doi: 10.1038/srep46136. [DOI] [PMC free article] [PubMed] [Google Scholar]
- 26.Li CJ, Cheng P, Liang MK, et al. MicroRNA-188 regulates age-related switch between osteoblast and adipocyte differentiation. J Clin Invest. 2015;125:1509–22. doi: 10.1172/JCI77716. [DOI] [PMC free article] [PubMed] [Google Scholar]
- 27.You L, Pan L, Chen L, et al. miR-27a is essential for the shift from osteogenic differentiation to adipogenic differentiation of mesenchymal stem cells in postmenopausal osteoporosis. Cell Physiol Biochem. 2016;39:253–65. doi: 10.1159/000445621. [DOI] [PubMed] [Google Scholar]
- 28.Xue Z, Meng Y, Ge J. miR-127-5p promotes chondrogenic differentiation in rat bone marrow mesenchymal stem cells. Exp Ther Med. 2017;14:1481–86. doi: 10.3892/etm.2017.4711. [DOI] [PMC free article] [PubMed] [Google Scholar]
- 29.Tu M, Li Y, Zeng C, et al. MicroRNA-127-5p regulates osteopontin expression and osteopontin-mediated proliferation of human chondrocytes. Sci Rep. 2016;6:25032. doi: 10.1038/srep25032. [DOI] [PMC free article] [PubMed] [Google Scholar]
- 30.Cao W, Jin H, Zhang L, et al. Identification of miR-601 as a novel regulator in the development of pancreatic cancer. Biochem Biophys Res Commun. 2017;483:638–44. doi: 10.1016/j.bbrc.2016.12.090. [DOI] [PubMed] [Google Scholar]
- 31.Zhou Y, Song T, Peng J, et al. SIRT1 suppresses adipogenesis by activating Wnt/beta-catenin signaling in vivo and in vitro. Oncotarget. 2016;7:77707–20. doi: 10.18632/oncotarget.12774. [DOI] [PMC free article] [PubMed] [Google Scholar]
- 32.Liu B, Lei M, Hu T, et al. Inhibitory effects of SRT1720 on the apoptosis of rabbit chondrocytes by activating SIRT1 via p53/bax and NF-kappaB/PGC-1alpha pathways. J Huazhong Univ Sci Technolog Med Sci. 2016;36:350–55. doi: 10.1007/s11596-016-1590-y. [DOI] [PubMed] [Google Scholar]
- 33.Hu JY, Yi W, Wei X, et al. miR-601 is a prognostic marker and suppresses cell growth and invasion by targeting PTP4A1 in breast cancer. Biomed Pharmacother. 2016;79:247–53. doi: 10.1016/j.biopha.2016.02.014. [DOI] [PubMed] [Google Scholar]
- 34.Howell LS, Ireland L, Park BK, Goldring CE. miR-122 and other microRNAs as potential circulating biomarkers of drug-induced liver injury. Expert Rev Mol Diagn. 2018;18:47–54. doi: 10.1080/14737159.2018.1415145. [DOI] [PubMed] [Google Scholar]
- 35.Wu GY, Rui C, Chen JQ, et al. MicroRNA-122 inhibits lipid droplet formation and hepatic triglyceride accumulation via Yin Yang 1. Cell Physiol Biochem. 2017;44:1651–64. doi: 10.1159/000485765. [DOI] [PubMed] [Google Scholar]


