

Summary
There is consensus that plant species richness enhances plant productivity within natural grasslands, but the underlying drivers remain debated. Recently, differential accumulation of soil‐borne fungal pathogens across the plant diversity gradient has been proposed as a cause of this pattern. However, the below‐ground environment has generally been treated as a ‘black box’ in biodiversity experiments, leaving these fungi unidentified.
Using next generation sequencing and pathogenicity assays, we analysed the community composition of root‐associated fungi from a biodiversity experiment to examine if evidence exists for host specificity and negative density dependence in the interplay between soil‐borne fungi, plant diversity and productivity.
Plant species were colonised by distinct (pathogenic) fungal communities and isolated fungal species showed negative, species‐specific effects on plant growth. Moreover, 57% of the pathogenic fungal operational taxonomic units (OTUs) recorded in plant monocultures were not detected in eight plant species plots, suggesting a loss of pathogenic OTUs with plant diversity.
Our work provides strong evidence for host specificity and negative density‐dependent effects of root‐associated fungi on plant species in grasslands. Our work substantiates the hypothesis that fungal root pathogens are an important driver of biodiversity‐ecosystem functioning relationships.
Keywords: density dependence, fungal community composition, host specificity, neighbour identity, root distribution, root‐associated fungi
Introduction
The diversity of plant species within natural grasslands is known to enhance plant productivity (i.e. biomass), both above and below ground (Tilman et al., 2006; Cardinale et al., 2007; Mueller et al., 2013; Ravenek et al., 2014). The resultant positive relationship between biodiversity and productivity is often explained by resource partitioning; as individual plant species differ in resource use and acquisition, the more species grown together in a community, and the more resources the plant community can obtain (Parrish & Bazzaz, 1976; Berendse, 1982; Dimitrakopoulos & Schmid, 2004; Oram et al., 2018). More recently, an alternative hypothesis was suggested, where pathogenic soil biota play a key role in regulating the relationship between plant diversity and productivity (Maron et al., 2011; Schnitzer et al., 2011).
The pathogen hypothesis is built upon two assumptions about plant–pathogen interactions within plant communities. The first is that plant species accumulate species‐specific pathogens, referred to as host specificity. These species‐specific pathogens can reduce the performance of their host species, but have little impact on other plant species. The second assumption is negative density dependence, which suggests that the accumulation of plant species‐specific pathogens and the negative impact on host performance declines with decreasing relative abundances of their host plants. Hence, along a gradient of plant species richness, pathogen pressure, potentially limiting biomass production, is high at low species richness (i.e. in monocultures where the relative abundance of the host is 100%) and expected to decrease in plant species‐rich mixtures, where the relative abundance of host plants will be lower (Kulmatiski et al., 2012; Bever et al., 2015). This ‘pathogen hypothesis’ is analogous to crop yield reductions from pests in agriculture, which typically increase with repeated cultivation of the same crop on the same field, and can be reduced by rotations with different crops (Bullock, 1992).
So far, the effect of pathogenic soil biota on the plant diversity–productivity relationship has mainly been investigated using a ‘black box’ approach, in which the growth response of plants on soil with an intact (but unknown) soil microbial community is compared to that on soils with their associated soil microbial community eliminated via sterilisation or application of fungicide. For example, Maron et al. (2011) showed that the significant positive relationship between plant species richness and biomass observed on an intact soil was absent on fungicide‐treated soil. Similarly, Schnitzer et al. (2011) demonstrated that soil sterilisation enhanced plant biomass production at low species richness, leading to a reduction of the positive relationship between plant species richness and biomass on sterilised soil as compared to field soil. Importantly, Schnitzer et al. (2011) included an additional treatment, in which sterilised soil was re‐inoculated with a soil wash from field soil containing bacteria and saprotrophic and pathogenic fungi, but not mycorrhizal fungi. This re‐inoculation ‘restored’ the positive relationship between plant species richness and biomass to a level similar to that observed on nonsterilised field soil.
Together, these two studies suggest that pathogenic soil biota, and soil‐borne fungi in particular, play an important role in regulating the plant diversity–productivity relationship. However, treatments such as soil sterilisation or fungicide application do not resolve the identity of the soil biota involved and, as such, provide only indirect evidence for how they interact with plant species richness. Here, we determined the taxonomic and functional diversity of soil‐borne fungal communities in roots from a 10‐yr‐old biodiversity experiment (van Ruijven & Berendse, 2009) using next generation sequencing approaches. We used these data to assess host specificity and negative density dependence of the root‐associated fungal community. It is important to note that these two factors may have contrasting effects on the relationship between plant and fungal species richness. If host specificity is strong and different plant species accumulate different fungal species, mixtures of plant species can be expected to harbour a mix of the fungal communities associated with each of the component plant species, potentially leading to an increase in fungal species richness with increasing plant species richness (Rottstock et al., 2014; Dassen et al., 2017). On the other hand, if negative density dependence leads to a reduction in the accumulation of host‐specific fungal species with increasing plant species richness (i.e. decreasing host density), this may lead to a dilution of host‐specific pathogens in mixtures, resulting in a less positive, neutral or even negative relationship between plant species richness and fungal richness.
We focused on the soil‐borne fungal communities associated with the plant roots, as these were hypothesised to be the main pathogenic factors structuring natural plant communities (Gilbert, 2002; Alexander, 2010; Fisher et al., 2012), but are still a hitherto largely unexplored component of the root microbiome (but see Hannula et al., 2017). Using detailed analyses of the taxonomic and functional composition of the soil‐borne community in experimental grassland plots, our study aims to reveal the main players and their rules of play in promoting biodiversity effects in plant communities. We test the following hypotheses: (1) different plant species harbour different root‐associated fungal (both total and pathogenic) communities (i.e. host specificity); (2) the community composition of (pathogenic) root‐associated fungi from plants grown in species‐rich mixtures is determined by the relative abundance of the host plants (i.e. negative density dependence); and (3) the diversity of root‐associated fungal communities increases with plant species richness.
These three hypotheses were investigated by assessing the root‐associated fungal communities from roots of plant monocultures and two‐, four‐ and eight‐plant species mixtures from the Wageningen biodiversity experiment. We combined full characterisation of the fungal communities using next generation sequencing and related it to specific measurement of below‐ground plant abundance on the same samples using quantitative PCR (qPCR) to quantify species‐specific root biomasses on two soil depths. The spatial aspect was explicitly taken into account because plant abundance changes along this spatial gradient, potentially affecting the composition of the fungal community (Jumpponen et al., 2010). We also isolated and identified fungi from symptomatic sections of roots of two selected plant species and performed bioassays to assess species‐specific pathogenicity.
Materials and Methods
Experimental setup
Root samples were obtained from the Wageningen biodiversity experiment, which was started in 2000 (van Ruijven & Berendse, 2005). Briefly, this experiment is a randomised block design, with plant species richness (one, two, four and eight species) as the main factor. Plant communities comprised the following species: the grasses Agrostis capillaris L., Anthoxanthum odoratum L., Festuca rubra L. and Holcus lanatus L. and forbs Centaurea jacea L., Leucanthemum vulgare Lamk., Plantago lanceolata L. and Rumex acetosa L. In June 2010, two soil cores (30 mm diameter) were taken (30 cm apart) in 87 plots (eight monocultures replicated four times (32), two‐species mixtures (25), four‐species mixtures (24) and eight‐species mixtures (6)). The two soil cores per plot were pooled, but divided into two depth samples (0–5 and 20–35 cm).
Species‐specific root quantification
Roots were collected from each soil layer by rinsing with tap water. One hundred milligrams of fresh biomass was stored at −80°C for molecular analyses. The remaining roots were used to determine fresh and dry biomass.
DNA from plant roots (and thus also DNA of the root‐associated fungi) was extracted from the 0–5 and 20–35 cm core fractions using the DNeasy Plant mini kit (Qiagen). Below‐ground plant species‐specific abundance was quantified in each root sample that contained two or more species using quantitative real‐time PCR (qPCR), as described by Mommer et al. (2008). Additional primer sets were developed for A. capillaris, C. jacea, H. lanatus and R. acetosa (Supporting Information Table S1). qPCR analyses were performed on a Viia 7 System (Applied Biosystems, Carlsbad, CA, USA). Power Sybr Green Mix reagents (Applied Biosystems) were used with an addition of 1 mM MgCl2, a primer concentration of 120 nM for each of L. vulgare, F. rubra, P. lanceolata, H. lanatus, A. capillaris and R. acetosa, 60 nM for A. odoratum and C. jacea and 1.0 ng of genomic DNA from the roots in a reaction volume of 20 μl with ROX as an internal passive reference dye. Reaction conditions were as follows: 2 min at 50˚C; 10 min at 95˚C; 45 cycles of 20 s at 95˚C, 30 s at 62˚C and 15 s at 72˚C; one cycle of 15 s at 95˚C; and finally a melt curve from 65 to 95°C, with an increase in temperature of 0.05°C s−1. To reduce the number of qPCRs, we analysed root samples from eight‐ and four‐species plots with the primer sets from all species, whereas those from the two‐species plots were analysed using just the primers for the plant species planted in those plots. In all cases, PCRs for each set of primers used were run in triplicate.
To convert the qPCR results to abundances of roots, calibration curves were made from 30 hand‐made mixed root samples using monoculture roots (Fig. S1). Eight of these standards contained equal proportions of all plant species (12.5% each). In the other 22 samples, species abundance ranged from 0 to 60%. Four standards with equal proportion of all species were run together alongside the unknown samples on every 96‐well plate per species. Relative abundances for the mixed root samples were calculated as described by Mommer et al. (2008, 2010). The minimum detection limit of a species in a sample was set to 1 mg fresh weight.
Molecular analyses of root‐associated fungi
The two DNA extracts per depth were pooled per plot, taking into account the relative masses of roots in each core, to provide one representative DNA sample per plot. Root‐associated fungal communities were characterised using 454 GS FLX pyrosequencing of amplicon libraries of the internal transcribed spacer (ITS1) region. This region was amplified by PCR using GoTaq Flexi DNA Polymerase (Promega) and 454‐pyrosequencing‐specific fusion primers. Forward fusion primers contained (in 5′→3′ order) the GS FLX XLR70‐specific B adaptor, one of 99 10‐bp multiplex identifiers (MIDs) and the forward ITS primer ITS1F (Gardes & Bruns, 1993). The reverse fusion primer comprised (in 5′→3′ order) the GS FLX XLR70‐specific A adaptor and the reverse ITS primer ITS2 (White et al., 1990). Different samples were amplified with different separate MID tags in the forward fusion primer to enable multiplexing. PCR was carried out in a 50 μl reaction volume with 1 μl of DNA template (diluted 1 : 20 from the original extract), 0.2 mM dNTPs and 0.4 μM of each primer (PCR conditions: 95°C for 5 min; 35 cycles at 95°C for 1 min, 60°C for 1 min and 72°C for 1 min; and 72°C for 5 min). All PCR products were gel extracted and purified using QIAquick gel extraction kits (Qiagen). The purified products were then quantified using PicoGreen Florescence (Invitrogen) using a FluorX plate reader (Tecan, Männedorf, Switzerland). Equimolar concentrations of MID‐tagged samples were mixed in two pools and loaded on separate halves of a GS‐FLX XLR70 plate separated with a two‐lane gasket (454 Life Science⁄Roche Applied Biosystems, Nutley, NJ, USA) and sequenced at Plant Research International, Wageningen UR, Wageningen, the Netherlands.
Reads were analysed using the QIIME pipeline and its associated modules (Caporaso et al., 2010). Pyrosequencing data were fully denoised using the flowgram denoiser algorithm (Reeder & Knight, 2010). All pyrosequence reads were clustered into operational taxonomic units (OTUs) at the 97% similarity level using the Usearch algorithm (Edgar, 2010), and the associated de novo chimera checker (Edgar et al., 2011) was used to detect and remove all chimeras and any OTU represented by fewer than four sequences. Samples with < 1000 sequence reads were also removed (Dumbrell et al., 2017). Representative sequences of each OTU were assigned taxonomy by comparing each OTU's representative sequence against sequences from cultured, named organisms, in the National Center for Biotechnology Information (NCBI) database using the Basic Local Alignment Search Tool (Blast, Altschul et al., 1990). Fungal OTU accumulation curves where computed using rarefaction and visually inspected. In general, most samples had OTU accumulation curves that were beginning to asymptote and for those that did not, the rates of OTU accumulation were not significantly different from those in other samples, indicating statistical comparisons at lower sequencing intensity were unlikely to be qualitatively different to those conducted with greater sequencing depth. All sequences have been submitted to the European Nucleotide Archive (study accession number PRJEB18545).
Functional characterisation of fungi was based on the literature (Domsch et al., 2007; Arnolds & van den Berg, 2013; Farr & Rossman, 2014) and compared with Nguyen et al. (2016). For the scope of this research we focused on the functional groups of root pathogens, shoot pathogens and root endophytes. The last group was included because endophytes can vary from plant promoting to weakly pathogenic (see Table S2).
Isolation of fungi from plant roots
We selected A. odoratum and L. vulgare as plant species to test for pathogenic effects of soil‐borne fungi because these two plant species had shown significant effects in previous plant–soil feedback studies (Hendriks et al., 2013, 2015). Seeds were grown on sterilised sand with added inocula (10% from the monocultural plots) in a glasshouse for 3 wk. Their roots were surface‐sterilised by subsequently rinsing with 70% EtOH, NaOCl (5% solution + 0.05% Tween20), 70% EtOH and twice sterilised H2O for 2 min. Root fragments were placed on either H2O agar plates (12 g l−1 agar technical, no. 3; LP0013 of Oxoid, Basingstoke, UK) or PDA agar (39.59 g l−1 potato dextrose agar; CM0139 Oxoid), with kanamycin (100 mg l−1) to prevent bacterial growth, and placed at 25 and 15°C for a week. Resulting fungal colonies were purified by hyphal tip transfers and classified visually by morphology. DNA was extracted from fungal hyphae using the MoBio PowerSoil DNA extraction kit (MoBio Laboratories Inc., Carlsbad, CA, USA). Fungal ITS1–5.8S–ITS2 rRNA gene regions (c. 700–800 bp) were amplified and sequenced using universal fungal primers ITS1 and ITS4 (White et al., 1990) by Macrogen (Seoul, South Korea). All DNA sequences were compared against those from cultured, named organisms, in the NCBI database using BLAST.
From the 27 fungal species isolated (see Table S3), we selected two strains with known significant pathogenic effects: Gaeumannomyces incrustans, a known soil‐borne fungal pathogen of grasses (Bucher & Wilkinson, 2007; recently renamed as Magnaporthiopsis panicorum (Luo & Zhang, 2013)); and Paraphoma chrysantemicola, a known soil‐borne fungal pathogen of the genus Leucanthemum (Garibaldi & Gullino, 1981). To test whether these strains indeed demonstrated plant species‐specific variation in their pathogenicity, we performed bioassays with these fungi and the plant species A. odoratum and L. vulgare on sterilised sand in 5‐cm‐diameter pots. Fungal isolates were added by placing agar plugs with fungal mycelium (1/5‐strength PDA; 5 mm diameter) close to each plant, 1 cm below the soil surface, with the hyphae directed towards the roots. Control plants received sterile 1/5‐strength PDA plugs (i.e. without fungi). Plants were harvested after 23 d and total biomass was determined. From roots with lesions, tissue was collected and Koch's postulates were confirmed based on colour and microscopic structure.
Statistical analyses
Roots
The relationship between community root mass density in both soil layers and species richness was analysed using a linear mixed effects model (LME) with depth, nested within plot to account for the fact that the two depths are not independent, as a fixed factor, species richness as a covariate and block as a random factor. Similar models were used to analyse root mass density of each species separately. Root mass density was natural logarithm transformed before analyses. Root data were analysed using Spss 23.0.0.1 (IBM).
Fungi
All analyses of fungal communities were based on OTU abundance data, normalised to 1000 454‐reads per sample using rarefaction. The requirement for using ecological metrics, the highly uneven distribution of sequences across 454 amplicon libraries and the expected large variation in abundances of OTUs across the ecological gradients of interest make rarefaction the most statistically suitable normalisation procedure in the context of this current study (Weiss et al., 2017). Assignment of fungal functional groups was only done for OTUs with either a ≥ 95% Blast similarity match across > 80% of the sequence length to sequences present in the NCBI database or identified as Glomeromycota (Table S2). Fungal community composition was analysed with nonmetric multidimensional scaling (NMDS) ordination of distance matrices calculated from the OTU 454‐read data and comparison between treatments was made via permutation‐based multivariate analysis of variance (PERMANOVA). All beta diversity analyses are based on Jaccard's index.
Canonical redundancy analysis (RDA) was used to examine the relationship between (Hellinger‐transformed) fungal community (OTU) data and plant root abundance data (quantified via qPCR) in mixed root samples (two, four and eight plant species); the significance of each plant variable was assessed using a distribution‐free Monte Carlo randomisation test (based on 10 000 randomisations) after examination of variance inflation factors (Borcard et al., 2011).
Comparisons of fungal species richness across treatments were made using LME models, with block as a random factor. All analyses were conducted in the R statistical language (R Development Core Team, 2016), with one or more of the following libraries: ‘vegan’ (Oksanen et al., 2016), ‘lme4’ (Bates et al., 2015), ‘lmerTest’ (Kuznetsova et al., 2016), ‘ggplot2’ (Wickham, 2009), ‘reshape2’ (Wickham, 2007) and ‘VennDiagram’ (Chen, 2016).
Results
Species‐specific root biomass across levels of plant species richness
A positive relationship between plant diversity and above‐ground productivity has been documented for the Wageningen Biodiversity Experiment (van Ruijven & Berendse, 2009; Kroon et al., 2012). Importantly, for the scope of our study, this biodiversity effect was also apparent below ground. Total root biomass over 0–50 cm depth increased with species richness (Cong et al., 2014). In the two soil layers analysed here, root mass density also increased with species richness (Fig. 1a; F 1,87 = 4.7; P < 0.05). Root mass density was significantly higher in the top than in the deeper layer (F 1,77 = 66.8; P < 0.001), but this difference did not affect the relationship with species richness (SR × Depth: F 1,85 = 1.6; P = 0.21).
Figure 1.
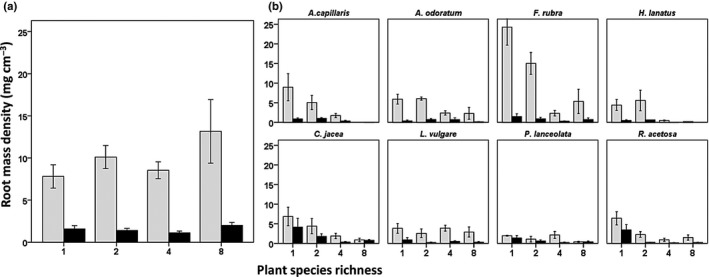
Below‐ground effects of species richness on root biomass. (a) Root mass density (mg cm−3) of the plant community increased significantly with plant species richness, both in the top soil layer (grey bars) and in deeper soil (black bars). Root biomass was significantly higher in the shallow than in the deeper layer. (b) Root mass density of the individual species also decreased with depth, except for the forbs Plantago lanceolata and Rumex acetosa. For most species, root mass density decreased significantly with species richness, suggesting/indicating decreased host abundance with plant species richness for host‐specific fungi. Two forbs (Leucanthemum vulgare and P. lanceolata) showed no decrease of root mass density with species richness. See Supporting Information Table S4 for statistics of the individual species. Bars show means ± SE.
For six out of eight plant species, root mass density decreased significantly with plant species richness. This means that host abundance indeed decreased with increasing species richness for these species (Fig. 1b). Two plant species, the forbs L. vulgare and P. lanceolata, showed no significant relationship between root mass density and species richness (Fig. 1b). Root mass density decreased with depth for five plant species, while three plant species (the forbs C. jacea, P. lanceolate and R. acetosa) showed no difference in root mass density between the two layers (Fig. 1b). Soil depth did not affect the relationships between root mass density and species richness, except for F. rubra, which showed a significant decline of root mass density with species richness in the top layer, but not in the deep layer (Fig. 1b).
Soil‐borne fungi in the biodiversity experiment
Before addressing our hypotheses, we first provide an overview of the soil‐borne fungal data. Our analysis of 162 root samples across the biodiversity experiment yielded 988 fungal OTUs from 605 766 fungal DNA sequences (mean length ± SD = 281 ± 43 bp). These OTUs covered the main fungal phyla (Table S2). The Ascomycota, Basidiomycota and Glomeromycota comprised 53, 21 and 11% of fungal OTUs from all samples, respectively, while the Chytridiomycota and Zygomycota each contributed < 1% of the total OTUs. Approximately 12% of OTUs were classified as fungi but did not allow reliable taxonomic assignment. In total, 261/988 OTUs were assigned to different fungal functional categories. For the scope of our study, we focus on the plant pathogens – root pathogens in particular – and endophytes. We found 59 plant pathogenic OTUs, from which 31 and 29 are known to infect roots and shoots, respectively (i.e. one OTU was classified as being both a root and a shoot pathogen; Table S2). In addition, we found 17 OTUs related to root endophytes and 112 OTUs were identified as Glomeromycota (Table S2). Other OTU classifications which are not relevant to the analysis presented here are provided in Table S2.
Hypothesis 1: host specificity in root‐associated fungal communities
In our study, the total root‐associated fungal communities (i.e. all fungal OTUs observed) in monocultures were significantly different between the plant species (Fig. 2; PERMANOVA; F 7,58 = 2.24, P < 0.001), between plant functional groups (i.e. grasses vs forbs; Fig. 2; F 1,58 = 4.38, P < 0.001) and among monoculture species within functional groups (grasses: F 3,28 = 1.42, P = 0.002; forbs: F 3,29 = 2.28, P < 0.001). The composition of the total fungal communities was significantly different between depths (PERMANOVA; F 1,58 = 2.15, P < 0.001), but there was no significant interaction between depth and host plant species (F 7,58 = 1.01, P = 0.42) or plant functional group (F 1,58 = 1.20, P = 0.13).
Figure 2.
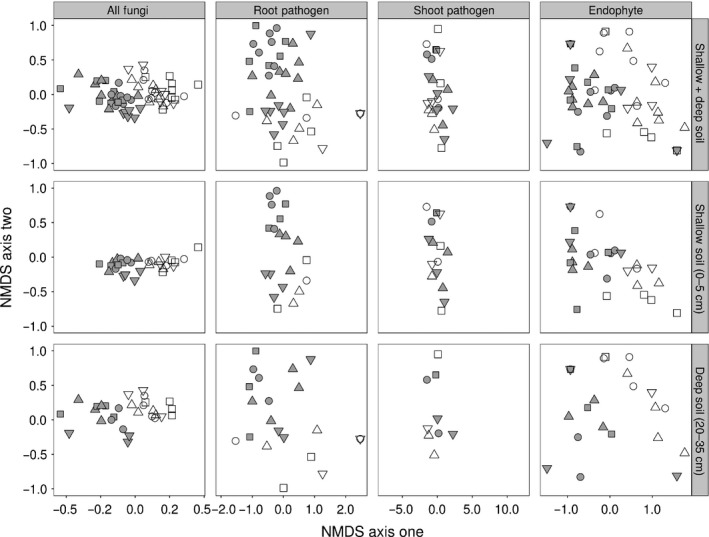
Species‐specific root‐associated fungal communities in monocultures. Nonmetric multidimensional scaling (NMDS) ordinations, based on Jaccard's distance of the total fungal community (all operational taxonomic units, OTUs), as well as root pathogens, shoot pathogens and endophytes, illustrating the association of the fungal assemblages with different plant species and plant functional groups. Results are displayed in combination and separately from different soil depths (0–5 cm; 20–35 cm). Open symbols represent fungal assemblages from grasses and closed symbols represent those from forbs. Fungal assemblages from host plants are represented by the following symbols: squares, Agrostis capillaris and Centaurea jacea; circles, Anthoxanthum odoratum and Leucanthemum vulgare; upwards triangles, Festuca rubra and Plantago lanceolata; downwards triangles, Holcus lanatus and Rumex acetosa.
Similar patterns of host specificity were found for assemblages of Ascomycota and Basidiomycota, but not for Glomeromycota (Fig. S2) (plant species effects: Ascomycota, F 7,58 = 2.54, P < 0.001; Basidiomycota, F 7,58 = 1.45, P < 0.001; Glomeromycota, F 7,58 = 1.08, P = 0.17; functional group effects: Ascomycota, F 1,58 = 5.23, P < 0.001; Basidiomycota, F 1,58 = 1.85, P < 0.001; Glomeromycota, F 1,58 = 0.95, P = 0.53). The community compositions of the Ascomycota and Glomeromycota were significantly different between depths (PERMANOVA; Ascomycota F 1,58 = 2.57, P < 0.001; Basidiomycota F 1,58 = 1.10, P = 0.26; Glomeromycota F 1,58 = 3.36, P < 0.001; Fig. S2).
Most importantly, host specificity was also observed for assemblages of root pathogens (Fig. 2; F 7,58 = 1.80, P < 0.001) and endophytes (Fig. 2; F 7,58 = 2.35, P < 0.001), but not for shoot pathogens (Fig. 2; F 7,58 = 1.06, P = 0.31). These results were consistent when pathogen assemblages across forb species were compared (root pathogens, F 3,28 = 1.33, P = 0.017; shoot pathogens, F 3,26 = 0.78, P = 0.89; endophytes, F 3,28 = 1.69, P = 0.04), but not within grass species (root pathogens, F 3,22 = 1.08, P = 0.30; shoot pathogens, F 3,23 = 0.95, P = 0.56; endophytes, F 3,27 = 1.28, P = 0.12).
Host specificity at the community level of the root pathogens and endophytes does not necessarily mean that these fungi act as pathogens to our plant species. To provide proof of principle for host specificity in pathogenicity, we performed bioassays with two fungi we isolated from symptomatic root segments of the forb species L. vulgare and the grass species A. odoratum (Table S3). These two fungi were classified as Paraphoma chrysanthemicola, a root pathogen of the genus Leucanthemum (Garibaldi & Gullino, 1981), and G. incrustans, a root pathogen of grasses (Bucher & Wilkinson, 2007). In separate bioassays, both fungi were used to colonise the roots of individual seedlings of these plant species. Indeed, the P. chrysanthemicola isolate caused an c. 80% reduction in L. vulgare biomass, but did not reduce growth of A. odoratum (Fig. 3). The G. incrustans isolate caused a c. 40% reduction in A. odoratum biomass, but not in L. vulgare (Fig. 3).
Figure 3.
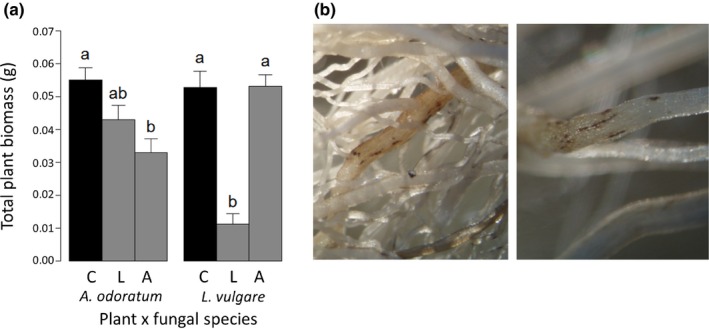
Pathogenic effects of fungal isolates on plant hosts. (a) Total biomass (shoot and root; g DW) of the grass Anthoxanthum odoratum and the forb Leucanthemum vulgare inoculated with two fungal species (and controls) in bioassays. (b) The pictures show necrotic lesions on the roots of different host plants used in this study (left, A. odoratum; right, L. vulgare. Photo courtesy of Laurens Deurhof). C, control; L, a fungus that is a specialist on the genus Leucanthemum (Paraphoma chrysanthemicola); A, a fungus that can be pathogenic on grass species (Gaeumannomyces incrustans). Bars represent means ± SE; n = 10. Within a plant species, different lower‐case letters indicate statistically significant differences (P < 0.05).
Together, analyses of the community composition of the root pathogens in plant monocultures and the bioassays provide support for host specificity in the root‐associated fungal communities.
Hypothesis 2: fungal community composition and host abundance
To investigate how fungal community composition in diverse plant communities is determined by the density of the host plants, we performed redundancy analyses (Fig. 4). Species‐specific root mass density ranged from 0.11 to 20.08 mg cm−3 in two‐species mixtures, from 0.04 to 12.01 mg cm−3 in four‐species mixtures, and from 0.03 to 14.0 mg cm−3 in eight‐species mixtures. Across the first two ordination axes, the RDA explained 58% of the variation within the relationship between plant species‐specific rooting densities and total fungal community composition, observed across soil depths in mixed plant communities (Fig. 4; axis 1, 38%, F 1,62 = 3.77, P < 0.001; axis 2, 20%, F 1,62 = 1.98, P = 0.03). Only the root biomass of one out of the eight species tested (A. odoratum) had a significant relationship with the composition of the fungal community (Fig. 4; F 1,62 = 1.86, P = 0.03). Similar RDA ordinations were observed for Ascomycota, Basidiomycota and Glomeromycota (Fig. S3), and root pathogens, shoot pathogens and endophytes when analysed separately (Fig. 4). For the root pathogens, we only observed a significant correlation between root biomass of A. odoratum and F. rubra and the fungal root pathogen community (A. odoratum, F 1,62 = 6.59, P = 0.02; F. rubra, F 1,62 = 4.81, P = 0.05).
Figure 4.
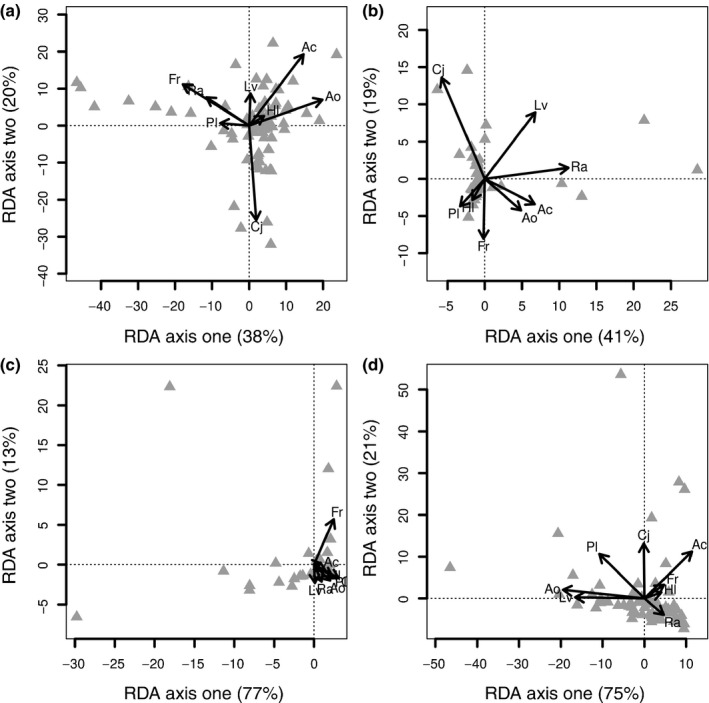
Correlations among functional fungal communities and root abundance in plant mixtures. Redundancy analysis (RDA) plots showing the variation in fungal community structure in mixed root samples (two, four and eight plant species; monocultures not included). Vectors show the species‐specific‐root biomasses and triangles represent fungal communities of (a) the total fungal community (all operational taxonomic units, OTUs), (b) root pathogens, (c) shoot pathogens and (d) endophytes. There were few direct links between fungal community composition and the root biomass of individual plant species. Only the root biomass of Anthoxanthum odoratum and Festuca rubra were related to root pathogen abundance (A. odoratum, F 1,62 = 6.59, P = 0.02; F. rubra, F 1,62 = 4.81, P = 0.05). Species abbreviations are Agrostis capillaris (Ac), A. odoratum (Ao), Centaurea jacea (Cj), F. rubra (Fr), Holcus lanatus (Hl), Leucanthemum vulgare (Lv), Plantago lanceolata (Pl) and Rumex acetosa (Ra).
We then focused on the OTUs corresponding to the isolated fungi from the bioassays (OTUs 345, 65 and 94 corresponding to P. chrysanthemicola; and OTU 592 corresponding to G. incrustans; Tables S2, S3). We observed a significant decrease in the relative abundance of the OTUs related to P. chrysanthemicola with decreasing root biomass of L. vulgare across all plant communities along the diversity gradient, although the variation in this relationship was large (F 1,128 = 16.4, P < 0.001, R 2 = 0.12). This suggests that at least for this specialist pathogen, pathogen pressure may indeed be diluted with increasing plant species richness. However, this pattern was not found for the grass specialist G. incrustans (i.e. OTU 592): it did not show a response to root biomass of the dominant grasses (A. odoratum and F. rubra) separately nor a response to total grass abundance.
Hypothesis 3: fungal diversity across levels of plant species richness
The diversity of the soil‐borne fungal community was significantly different across plant species in monoculture (Fig. S3a; F 7,41 = 2.49, P = 0.03). Within plant monocultures, the total diversity of root‐associated fungi was highest in grasses, but the diversity of root pathogenic and endophytic fungi was generally highest in forbs (Fig. S3b).
Despite significant differences in fungal richness and composition across plant monocultures, fungal diversity did not increase when plant species were mixed (Fig. 5; plant species richness effect: F 3,137 = 1.96, P = 0.12). This result was consistently observed across fungal functional groups, except for the endophytes, which did increase with increasing plant diversity (Fig. 5; root pathogens, F 3,137 = 0.68, P = 0.57; shoot pathogens, F 3,137 = 2.28, P = 0.08; endophytes, F 3,137 = 7.87, P < 0.001).
Figure 5.
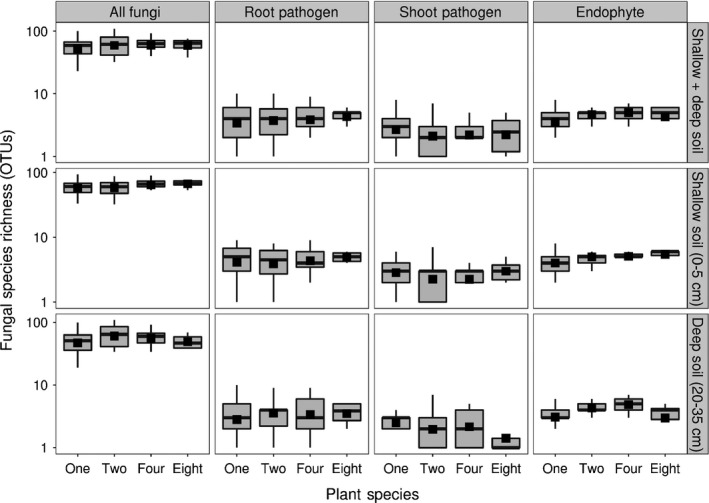
Fungal richness does not increase with plant species richness. Fungal diversity (number of operational taxonomic units, OTUs) of the total fungal community as well as the shoot pathogens, root pathogens and endophytes, respectively. Boxes represent median and 25th–75th percentiles, bars represent minima and maxima and filled squares the mean fungal diversity per plot from each plant species richness treatment.
We then investigated the overlap in fungal OTUs across the levels of plant species richness. The fungal OTUs found in plots containing mixtures of either two, four or eight plant species were only a subset of those found across plant monoculture plots (Fig. 6): 174 fungal OTUs were found in all diversity levels, 131 OTUs were unique for monocultures, 71 OTUs were only found in two‐species plots, 85 OTUs were found in four‐species plots and eight OTUs were found in eight‐species plots. Unfortunately, the power of our study is not sufficient to allow similar analyses for the assemblages of root pathogens, shoot pathogens and endophytes. Given that limitation, however, pathogenic OTUs appeared to become ‘lost’ in eight‐species mixtures, as 57% of the pathogenic fungal OTUs recorded in plant monocultures were not detected in the eight‐plant species plots.
Figure 6.
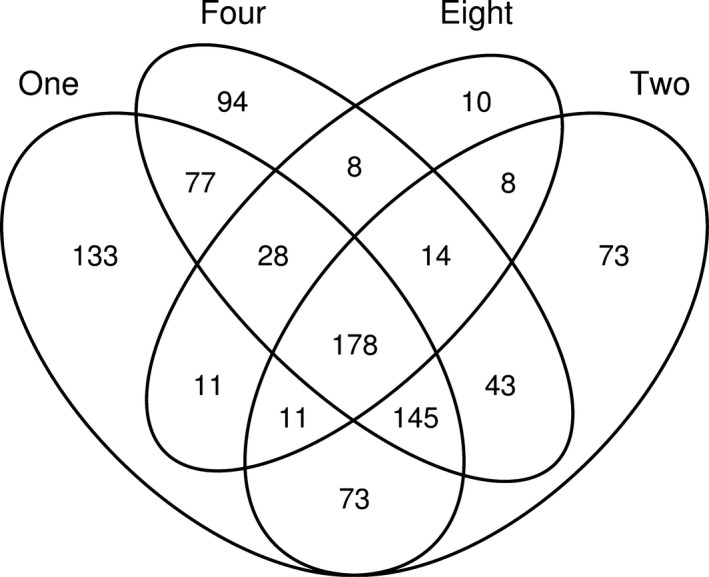
Venn diagram showing the overlap in operational taxonomic units (OTUs) among the plant species richness levels. Numbers represent OTU counts. In total, 178 fungal OTUs were found in all diversity levels and 133 OTUs were unique for monocultures. Results from combined soil depths are presented.
Discussion
Our findings constitute the first steps in opening the ‘black box’ of root‐associated fungal pathogens regulating the positive relationship between plant biodiversity and productivity. By quantifying fungal communities from roots across a gradient of plant species richness, we provide an empirical test of the two assumptions underlying the role of pathogens in biodiversity–productivity relationships. Our results provide strong support for host specificity, because plant species differed in pathogenic fungal community composition in monocultures. This result would predict that when multiple plant species are grown in mixtures their unique species‐specific root‐associated fungal communities would also exist together, and thus fungal species richness would be positively correlated with plant species richness. However, our results demonstrate that when plant species are grown together it does not lead to an increase in the diversity of root‐associated fungal communities. Indeed, 57% of the pathogenic fungal OTUs recorded in plant monocultures were not detected at high plant diversity, consistent with fungal pathogen dilution occurring with increased plant species richness.
Host specificity of soil‐borne fungi in monocultures
The roots of the plant species growing in monocultures harboured significantly different fungal communities, indicating host specificity. Host specificity was evident at the level of the total fungal community as well as within the main phyla, such as Ascomycota and Basidiomycota. Consistent with the wide host ranges of many arbuscular mycorrhizal fungal species, host specificity was not apparent for the Glomeromycota (Smith & Read, 2008; Dumbrell et al., 2010), although future work should confirm this finding with primers that are more specific for this phylum.
Within the context of our study it is more important to investigate host specificity at the functional level of fungal guilds (i.e. root pathogens and endophytes). Recently, fungi have begun to be classified and analysed within functional groups based on phylogeny and the literature, and although this field is in its infancy it can provide useful indications of the activities of fungal communities (Nguyen et al., 2016; Hannula et al., 2017). We performed this classification as thoroughly as possible by carefully checking the literature (Domsch et al., 2007; Farr & Rossman, 2014). Fortunately, for our functional groups of interest –pathogens and endophytes – there is a large amount of information available due to their economic importance in agriculture, making our classifications more robust. Our study demonstrates host specificity of pathogenic fungal communities in natural grassland species. Inoculation of two plant species with isolates of two of these fungi revealed host‐specific pathogenic effects. These bioassays provide proof of principle that these below‐ground organisms from biodiversity experiments can actually act as pathogens and have differential effects on different plant species. However, such single‐fungus single‐plant bioassays are still relatively simple (see also Sarmiento et al., 2017). The next step would be to determine the effects of multiple fungal interactions on plant growth (e.g. Klironomos, 2002; Hersh et al., 2012), as fungal co‐infection is the rule rather than the exception (Oyarzun et al., 1993; Peay et al., 2013). Combining complex culture‐based approaches and next generation sequencing will reveal the most influential fungal pathogenic actors and their modes of play in biodiversity–ecosystem functioning.
Work by Gilbert & Webb (2007) has shown that the chance of fungal infection is inversely related to phylogenetic distance between the host species. Consistent with this finding, we found a significant effect of the plant functional group (i.e. grass vs forbs) on the overall fungal community composition and also on the root pathogens and endophytes. The latter may explain findings from plant–soil feedback studies, showing that plants experience the strongest growth‐reducing effects on soil conditioned by species from the same plant functional group (Petermann et al., 2008; Hendriks et al., 2013).
Patterns of host specificity were apparent at both depths, but fungal communities differed between the two soil layers. This finding suggests that niche differentiation over depth occurs among fungi (Jumpponen et al., 2010; Unterseher et al., 2011; Mujic et al., 2016). Future work should reveal whether this depth differentiation is associated with decreased root biomass (Mueller et al., 2013; Ravenek et al., 2014), altered root exudation profiles (Kawasaki et al., 2016) or differences in abiotic conditions (e.g. organic matter content; Cong et al., 2014) across depths.
Host abundance effects on soil‐borne fungi in plant mixtures
In plant mixtures, 58% of the variation in fungal community composition was explained by the variation in root biomass across different plant species, suggesting the host specificity observed in monocultures may also be important in regulating fungal communities in more diverse plant communities. However, there were only a few direct links between fungal community composition and the density (species‐specific root biomass) of specific hosts. Only the density of the grass A. odoratum had a significant effect on the composition of the total fungal community, as well as on the root pathogenic community. If host density does have an overarching effect on fungal community composition, then additional significant relationships between host densities and fungal community composition would be expected. The lack of relationships may have three causes:
First, in experimental systems, like those used in this study, the soil physico‐chemical environment was initially similar across plots. Over time, however, abiotic differences may have emerged that are driven by plant identity and diversity effects (Cong et al., 2014; Lange et al., 2015; Chen et al., 2017). These abiotic differences may also be drivers of the fungal community (Tedersoo et al., 2014; Thomson et al., 2015), rather than the plant species alone.
Second, and perhaps more importantly, the fungal community may not only be determined by the density of the host at the plot level, but also by the identity of the closest neighbouring plants (i.e. individuals belonging to other species). Disease transmission is probably determined by the ‘contagiousness’ of neighbours (Otten et al., 2005). For example, some soil‐borne fungal pathogens can persist on a nonhost species without causing disease symptoms. A host plant with such ‘asymptomatic’ neighbours is more likely to become infected than a plant surrounded by a true nonhost, which is not colonised (Malcolm et al., 2013). Closely related neighbours are more ‘contagious’ than others (Gilbert & Webb, 2007). As a consequence, the chance of fungal infection increases with decreasing phylogenetic distance between plant species (Parker et al., 2015). However, the set‐up of most biodiversity experiments is such that host density and neighbour identity are simultaneously varied and do not allow the disentanglement of these two components.
Third, host density effects on pathogen abundance may only be straightforward when the pathogen has a narrow host range, and not in communities – which include generalist pathogens – as a whole. This is illustrated by the fact that we observed a significant negative relationship between the number of sequence reads of the specialist fungus P. chrysanthemicola and root biomass of its host L. vulgare in mixed root samples. However, we did not find a similar relationship for the grass specialist G. incrustans, a fungus known to have a broader host range than P. chrysanthemicola. The decline in sequence reads of the specialist pathogen (P. chrysanthemicola) with decreasing density of its host (L. vulgare) is in line with negative density dependence, although quantitative statements based on the number of DNA sequences from next generation sequencing approaches should be treated with caution. So far, negative density dependence has mainly been demonstrated for tree seedlings in tropical (Bell et al., 2006; Mangan et al., 2010; Liu et al., 2015) and temperate (Johnson et al., 2012) forests. In most cases, this is based on seedling survival as a function of either distance from, or density of, adult trees. Empirical data of the abundance of the pathogens involved are scarce, and our study constitutes the first step towards the functional characterisation of the soil‐borne community along a diversity gradient.
Fungal diversity along the plant species richness gradient
We found no evidence that fungal species richness increased with plant species richness in our study. This contradicts the findings from two other studies. First, Dassen et al. (2017) found a positive relationship between fungal diversity and plant species richness, but investigated bulk soil rather than roots. The authors attributed the positive relationship to increased diversity of litter in the soil and other abiotic soil conditions, rather than plant species richness. Second, Rottstock et al. (2014) showed that the number of leaf pathogenic fungal groups increased with plant species richness. However, they reported the cumulative number of pathogen groups found across all plant species, which suggests that the results may be partly due to increased sampling efforts with plant species richness. In our study, equal sequencing effort was employed per sample. For the vast majority of our samples, OTU–rarefaction curves were approaching asymptotes and thus it is unlikely we differentially missed fungal species due to an artefact. The combination of our finding that fungal diversity does not increase with plant species richness, and that each plant species harboured a distinct fungal community in monoculture, suggests that part of the fungal species present in plant monocultures disappear in plant mixtures. Many of these ‘lost’ fungi were found to be pathogens, with 57% of the pathogenic fungal taxa recorded in plant monocultures not detected in highly diverse plant communities. The reduction of pathogenic OTUs with plant species richness suggests that fungal root pathogens have trouble locating their hosts in diverse plant communities.
Future perspective
Our study is the first attempt to identify the fungi that play a role in plant biodiversity–productivity relationships. We show that soil‐borne fungal pathogens may be reduced at high plant species richness, which may explain at least in part why plant productivity increases with increasing plant species richness, as previously hypothesised (Maron et al., 2011; Schnitzer et al., 2011; Hendriks et al., 2013; Bever et al., 2015). Our work has enhanced the field of research into biodiversity–productivity relationships by providing further evidence of the importance of below‐ground pathogens by validating two underlying assumptions: host specificity and negative density dependence. Moreover, we postulate that the identity of neighbouring plants may be a factor that is particularly important in soil‐borne fungal community assembly.
The effect of neighbours on the loss of fungal diversity has been referred to as the root camouflage hypothesis (Gilbert et al., 1994), which poses that fungal root pathogens ‘get lost’ in the ‘jungle’ of roots in complex plant communities. Root systems in species‐rich grassland communities are indeed tightly intermingled (Kesanakurti et al., 2011; Ravenek et al., 2014; Frank et al., 2015). One potential mechanism behind root camouflage could be that increased root biomass of different plant species leads to higher concentrations of root‐secreted antifungal chemicals (Bednarek & Osbourn, 2009), which can reduce the build‐up of pathogen communities. Another potential explanation may be that the exudates and volatiles of other plant species and their root microbiomes may interfere with the signalling cues needed for spore germination and/or directional hyphal growth of fungi toward the host root. Future work will have to reveal which mechanism(s) operate below ground. To disentangle the role of host density from the role of neighbours it would be necessary to separately analyse roots (and fungal communities) of different plant species in plant mixtures.
Understanding the rules of the ‘hide‐and‐seek’ game played between plants and pathogens below ground is particularly important for biodiversity conservation and the maintenance of ecosystem functioning, but may also help to improve the design of mixed cropping systems (Li et al., 2014; Brooker et al., 2015). Our work suggests that increasing diversity of (phylogenetically different) plants may be an important prerequisite to reducing disease pressure in both natural and agricultural ecosystems.
Author contributions
L.M., T.E.A.C., J.M.R., J.v.R. and A.J.D. designed the study; L.M., J.v.R., M.H., J.E.v.d.M., J.W.v.d.P. and A.E.S‐T. collected the root samples; T.E.A.C., J.W.v.d.P., E.G.W.M.S. and A.E.S‐T. performed the molecular analyses, L.M., T.E.A.C., J.M.R., A.J.T., J.v.R. and A.J.D. analysed the data; L.M., T.E.A.C., J.v.R. and A.J.D. wrote the first version of the manuscript; L.M., T.E.A.C., J.M.R., A.J.T., J.v.R., M.H., S.Q.v.R., J.E.v.d.M., J.v.d.W.P., A.E.S‐T., F.B., H.d.K. and A.J.D. discussed the results, contributed substantially to the drafts and gave final approval for publication. L.M. and T.E.A.C. contributed equally to this work.
Supporting information
Please note: Wiley Blackwell are not responsible for the content or functionality of any Supporting Information supplied by the authors. Any queries (other than missing material) should be directed to the New Phytologist Central Office.
Fig. S1 Calibration curves for measuring species‐specific root abundance in root samples containing up to eight plant species.
Fig. S2 Community composition of root‐associated fungal phyla in monocultures.
Fig. S3 Diversity of the root‐associated fungal communities among plant species in monoculture.
Table S1 Primer pairs used for the quantification of the plant species abundance in mixed root samples using reverse transcriptase PCR
Table S3 Sources and sequences of isolated fungi, and the taxonomy of their closest BLAST hit to reference sequences in GenBank
Table S4 Statistical analysis of species‐specific root mass density along the diversity gradient
Table S2 Putative identities and functions of root‐associated fungal sequences characterised by 454‐pyrosequencing
Acknowledgements
We would like to thank our colleagues Hannie de Caluwe, Frans Möller, Jan van Walsem and students for their help with coring and washing the roots. L.M. is supported by NWO‐VIDI grant 864.14.006. T.E.A.C. received financial support from FEMS.
References
- Alexander HM. 2010. Disease in natural plant populations, communities, and ecosystems: insights into ecological and evolutionary processes. Plant Disease 94: 492–503. [DOI] [PubMed] [Google Scholar]
- Altschul SF, Gish W, Miller W, Myers EW, Lipman DJ. 1990. Basic local alignment search tool. Journal of Molecular Biology 215: 403–410. [DOI] [PubMed] [Google Scholar]
- Arnolds EJM, van den Berg AP. 2013. Beknopte Standaardlijst van Nederlandse Paddenstoelen [Concise checklist of Dutch macrofungi]. Nederlandse Mycologische Vereniging [Dutch Mycological Society] [WWW document] URL https://www.verspreidingsatlas.nl/soortenlijst.aspx?groep=P [15 August 2016].
- Bates D, Maechler M, Bolker B, Walker S. 2015. Fitting linear mixed‐effects models using lme4. Journal of Statistical Software 67: 1–48. [Google Scholar]
- Bednarek P, Osbourn A. 2009. Plant–microbe interactions: chemical diversity in plant defense. Science 324: 746–748. [DOI] [PubMed] [Google Scholar]
- Bell T, Freckleton RP, Lewis OT. 2006. Plant pathogens drive density‐dependent seedling mortality in a tropical tree. Ecology Letters 9: 569–574. [DOI] [PubMed] [Google Scholar]
- Berendse F. 1982. Competition between plant‐populations with different rooting depths. 3. Field experiments. Oecologia 53: 50–55. [DOI] [PubMed] [Google Scholar]
- Bever JD, Mangan SA, Alexander HM. 2015. Maintenance of plant species diversity by pathogens. Annual Review of Ecology, Evolution, and Systematics 46: 305–325. [Google Scholar]
- Borcard D, Gillet F, Legendre P. 2011. Numerical ecology with R. New York, NY, USA: Springer . [Google Scholar]
- Brooker RW, Bennett AE, Cong WF, Daniell TJ, George TS, Hallett PD, Hawes C, Iannetta PP, Jones HG, Karley AJ. 2015. Improving intercropping: a synthesis of research in agronomy, plant physiology and ecology. New Phytologist 206: 107–117. [DOI] [PubMed] [Google Scholar]
- Bucher ES, Wilkinson HT. 2007. The pathogenicity of Gaeumannomyces incrustans on turfgrass Zoysia japonia . Canadian Journal of Plant Pathology 29: 56–62. [Google Scholar]
- Bullock DG. 1992. Crop rotation. Critical Reviews in Plant Sciences 11: 309–326. [Google Scholar]
- Caporaso JG, Kuczynski J, Stombaugh J, Bittinger K, Bushman FD, Costello EK, Fierer N, Pena AG, Goodrich JK, Gordon JI et al 2010. QIIME allows analysis of high‐throughput community sequencing data. Nature Methods 7: 335–336. [DOI] [PMC free article] [PubMed] [Google Scholar]
- Cardinale BJ, Wrigh JP, Cadotte MW, Carroll IT, Hector A, Srivastava DS, Loreau M, Weis JJ. 2007. Impacts of plant diversity on biomass production increase through time because of species complementarity. Proceedings of the National Academy of Sciences, USA 104: 18123–18128. [DOI] [PMC free article] [PubMed] [Google Scholar]
- Chen HX. 2016. VennDiagram: generate high‐resolution Venn and Euler plots. R package version 1.6.17. [WWW document] URL https://CRAN.R-project.org/package=VennDiagram.
- Chen HM, Mommer L, van Ruijven J, de Kroon H, Fischer C, Gessler A, Hildebrandt A, Scherer‐Lorenzen M, Wirth C, Weigelt A. 2017. Plant species richness negatively affects root decomposition in grasslands. Journal of Ecology 105: 209–218. [Google Scholar]
- Cong WF, van Ruijven J, Mommer L, Deyn GBd, Berendse F, Hoffland E. 2014. Plant species richness promotes soil carbon and nitrogen stocks in grasslands without legumes. Journal of Ecology 102: 1163–1170. [Google Scholar]
- Dassen S, Cortois R, Martens H, de Hollander M, Kowalchuk GA, van der Putten WH, De Deyn GB. 2017. Differential responses of soil bacteria, fungi, archaea and protists to plant species richness and plant functional group identity. Molecular Ecology 26: 4085–4098. [DOI] [PubMed] [Google Scholar]
- Dimitrakopoulos PG, Schmid B. 2004. Biodiversity effects increase linearly with biotope space. Ecology Letters 7: 574–583. [Google Scholar]
- Domsch KH, Gams W, Anderson TH. 2007. Compendium of soil fungi, 2nd edn Eching, Germany: IHW‐Verlag. [Google Scholar]
- Dumbrell AJ, Ferguson RMW, Clark DR. 2017. Microbial community analysis by single‐amplicon high‐throughput next generation sequencing: data analysis – from raw output to ecology In: McGenity TJ, Timmis KN, Nogales B, eds. Hydrocarbon and lipid microbiology protocols: microbial quantitation, community profiling and array approaches. Berlin/Heidelberg, Germany: Springer‐Verlag, 155–206. [Google Scholar]
- Dumbrell AJ, Nelson M, Helgason T, Dytham C, Fitter AH. 2010. Relative roles of niche and neutral processes in structuring a soil microbial community. ISME Journal 4: 337–345. [DOI] [PubMed] [Google Scholar]
- Edgar RC. 2010. Search and clustering orders of magnitude faster than BLAST. Bioinformatics 26: 2460–2461. [DOI] [PubMed] [Google Scholar]
- Edgar RC, Haas BJ, Clemente JC, Quince C, Knight R. 2011. UCHIME improves sensitivity and speed of chimera detection. Bioinformatics 27: 2194–2200. [DOI] [PMC free article] [PubMed] [Google Scholar]
- Farr DF, Rossman AY. 2014. Fungal databases, systematic mycology and microbiology laboratory. ARS, USDA. [WWW document] URL http://nt.ars-grin.gov/fungaldatabases/.
- Fisher MC, Henk DA, Briggs CJ, Brownstein JS, Madoff LC, McCraw SL, Gurr SJ. 2012. Emerging fungal threats to animal, plant and ecosystem health. Nature 484: 186–194. [DOI] [PMC free article] [PubMed] [Google Scholar]
- Frank DA, Pontes AW, Maine EM, Fridley JD. 2015. Fine‐scale belowground species associations in temperate grassland. Molecular Ecology 24: 3206–3216. [DOI] [PubMed] [Google Scholar]
- Gardes M, Bruns TD. 1993. ITS primers with enhanced specificity for basidiomycetes – application to the identification of mycorrhizae and rusts. Molecular Ecology 2: 113–118. [DOI] [PubMed] [Google Scholar]
- Garibaldi A, Gullino ML. 1981. Gravi attacchi di Phoma chrysanthemicola f.sp. chrysanthemicoal su crisantemo in Italia. Informatore Fitopatologico 31: 27–30. [Google Scholar]
- Gilbert GS. 2002. Evolutionary ecology of plant diseases in natural ecosystems. Annual Review of Phytopathology 40: 13–43. [DOI] [PubMed] [Google Scholar]
- Gilbert GS, Handelsman J, Parke JL. 1994. Root camouflage and disease‐control. Phytopathology 84: 222–225. [Google Scholar]
- Gilbert GS, Webb CO. 2007. Phylogenetic signal in plant pathogen–host range. Proceedings of the National Academy of Sciences, USA 104: 4979–4983. [DOI] [PMC free article] [PubMed] [Google Scholar]
- Hannula SE, Morrien E, de Hollander M, van der Putten WH, van Veen JA, de Boer W. 2017. Shifts in rhizosphere fungal community during secondary succession following abandonment from agriculture. ISME Journal 11: 2294–2304. [DOI] [PMC free article] [PubMed] [Google Scholar]
- Hendriks M, Mommer L, Caluwe Hd, Smit‐Tiekstra AE, Putten WHvd, Kroon Hd. 2013. Independent variations of plant and soil mixtures reveal soil feedback effects on plant community overyielding. Journal of Ecology 101: 287–297. [Google Scholar]
- Hendriks M, Ravenek JM, Smit‐Tiekstra AE, van der Paauw JW, Caluwe Hd, Van der Putten WH, De Kroon H, Mommer L. 2015. Spatial heterogeneity of plant–soil feedback affects root interactions and interspecific competition. New Phytologist 207: 830–840. [DOI] [PubMed] [Google Scholar]
- Hersh MH, Vilgalys R, Clark JS. 2012. Evaluating the impacts of multiple generalist fungal pathogens on temperate tree seedling survival. Ecology 93: 511–520. [DOI] [PubMed] [Google Scholar]
- Johnson DJ, Beaulieu WT, Bever JD, Clay K. 2012. Conspecific negative density dependence and forest diversity. Science 336: 904–907. [DOI] [PubMed] [Google Scholar]
- Jumpponen A, Jones KL, Blair J. 2010. Vertical distribution of fungal communities in tallgrass prairie soil. Mycologia 102: 1027–1041. [DOI] [PubMed] [Google Scholar]
- Kawasaki A, Donn S, Ryan PR, Mathesius U, Devilla R, Jones A, Watt M. 2016. Microbiome and exudates of the root and rhizosphere of Brachypodium distachyon, a model for wheat. PLoS ONE 11: e0164533. [DOI] [PMC free article] [PubMed] [Google Scholar]
- Kesanakurti PR, Fazekas AJ, Burgess KS, Percy DM, Newmaster SG, Graham SW, Barrett SCH, Hajibabaei M, Husband BC. 2011. Spatial patterns of plant diversity below‐ground as revealed by DNA barcoding. Molecular Ecology 20: 1289–1302. [DOI] [PubMed] [Google Scholar]
- Klironomos JN. 2002. Feedback with soil biota contributes to plant rarity and invasiveness in communities. Nature 417: 67–70. [DOI] [PubMed] [Google Scholar]
- Kroon Hd, Hendriks M, Ruijven Jv, Ravenek J, Padilla FM, Jongejans E, Visser EJW, Mommer L. 2012. Root responses to nutrients and soil biota: drivers of species coexistence and ecosystem productivity. Journal of Ecology 100: 6–15. [Google Scholar]
- Kulmatiski A, Beard KH, Heavilin J. 2012. Plant‐soil feedbacks provide an additional explanation for diversity–productivity relationships. Proceedings of the Royal Society of London B: Biological Sciences 279: 3020–3026. [DOI] [PMC free article] [PubMed] [Google Scholar]
- Kuznetsova A, Brockhoff PB, Bojesen Christensen RH. 2016. lmerTest: tests in linear mixed effects models. R package version 2.0‐32. [WWW document] URL https://CRAN.R-project.org/package=lmerTest.
- Lange M, Eisenhauer N, Sierra CA, Bessler H, Engels C, Griffiths RI, Mellado‐Vazquez PG, Malik AA, Roy J, Scheu S et al 2015. Plant diversity increases soil microbial activity and soil carbon storage. Nature Communications 6: 6707. [DOI] [PubMed] [Google Scholar]
- Li L, Tilman D, Lambers H, Zhang FS. 2014. Plant diversity and overyielding: insights from belowground facilitation of intercropping in agriculture. New Phytologist 203: 63–69. [DOI] [PubMed] [Google Scholar]
- Liu Y, Fang S, Chesson P, He F. 2015. The effect of soil‐borne pathogens depends on the abundance of host tree species. Nature Communications 6: 10017. [DOI] [PMC free article] [PubMed] [Google Scholar]
- Luo J, Zhang N. 2013. Magnaporthiopsis, a new genus in Magnaporthaceae (Ascomycota). Mycologia 105: 1019–1029. [DOI] [PubMed] [Google Scholar]
- Malcolm GM, Kuldau GA, Gugino BK, Jiménez‐Gasco MdM. 2013. Hidden host plant associations of soilborne fungal pathogens: an ecological perspective. Phytopathology 103: 538–544. [DOI] [PubMed] [Google Scholar]
- Mangan SA, Schnitzer SA, Herre EA, Mack KM, Valencia MC, Sanchez EI, Bever JD. 2010. Negative plant‐soil feedback predicts tree‐species relative abundance in a tropical forest. Nature 466: 752–755. [DOI] [PubMed] [Google Scholar]
- Maron JL, Marler M, Klironomos JN, Cleveland CC. 2011. Soil fungal pathogens and the relationship between plant diversity and productivity. Ecology Letters 14: 36–41. [DOI] [PubMed] [Google Scholar]
- Mommer L, van Ruijven J, de Caluwe H, Smit‐Tiekstra AE, Wagemaker CAM, Ouborg NJ, Bogemann GM, van der Weerden GM, Berendse F, de Kroon H. 2010. Unveiling below‐ground species abundance in a biodiversity experiment: a test of vertical niche differentiation among grassland species. Journal of Ecology 98: 1117–1127. [Google Scholar]
- Mommer L, Wagemaker N, de Kroon H, Ouborg NJ. 2008. Unravelling belowground plant distributions: a real time PCR method for quantifying species proportions in mixed root samples. Molecular Ecology Notes 8: 947–953. [DOI] [PubMed] [Google Scholar]
- Mueller KE, Tilman D, Fornara DA, Hobbie SE. 2013. Root depth distribution and the diversity‐productivity relationship in a long‐term grassland experiment. Ecology 94: 787–793. [Google Scholar]
- Mujic AB, Durall DM, Spatafora JW, Kennedy PG. 2016. Competitive avoidance not edaphic specialization drives vertical niche partitioning among sister species of ectomycorrhizal fungi. New Phytologist 209: 1174–1183. [DOI] [PubMed] [Google Scholar]
- Nguyen NH, Song ZW, Bates ST, Branco S, Tedersoo L, Menke J, Schilling JS, Kennedy PG. 2016. FUNGuild: an open annotation tool for parsing fungal community datasets by ecological guild. Fungal Ecology 20: 241–248. [Google Scholar]
- Oksanen J, Blanchet FG, Friendly M, Kindt R, Legendre P, McGlinn D, Minchin PR, O'Hara RB, Simpson GL, Solymos P et al 2016. Vegan: community ecology package. R package version 2.4‐1. [WWW document] URL https://CRAN.R-project.org/package=vegan.
- Oram NJ, Ravenek JM, Barry KE, Weigelt A, Chen H, Gessler A, Gockele A, de Kroon H, van der Paauw JW, Scherer‐Lorenzen M et al 2018. Below‐ground complementarity effects in a grassland biodiversity experiment are related to deep‐rooting species. Journal of Ecology 106: 265–277. [Google Scholar]
- Otten W, Filipe J, Gilligan C. 2005. Damping‐off epidemics, contact structure, and disease transmission in mixed‐species populations. Ecology 86: 1948–1957. [Google Scholar]
- Oyarzun P, Gerlagh M, Hoogland A. 1993. Pathogenic fungi involved in root rot of peas in the Netherlands and their physiological specialization. Netherlands Journal of Plant Pathology 99: 23–33. [Google Scholar]
- Parker IM, Saunders M, Bontrager M, Weitz AP, Hendricks R, Magarey R, Suiter K, Gilbert GS. 2015. Phylogenetic structure and host abundance drive disease pressure in communities. Nature 520: 542–544. [DOI] [PubMed] [Google Scholar]
- Parrish JAD, Bazzaz FA. 1976. Underground niche separation in successional plants. Ecology 57: 1281–1288. [Google Scholar]
- Peay KG, Baraloto C, Fine PV. 2013. Strong coupling of plant and fungal community structure across western Amazonian rainforests. ISME Journal 7: 1852–1861. [DOI] [PMC free article] [PubMed] [Google Scholar]
- Petermann JS, Fergus AJF, Turnbull LA, Schmid B. 2008. Janzen‐Connell effects are widespread and strong enough to maintain diversity in grasslands. Ecology 89: 2399–2406. [DOI] [PubMed] [Google Scholar]
- R Developement Core Team . 2016. R: A language and environment for statistical computing. Vienna, Austria: R Foundation for Statistical Computing. [Google Scholar]
- Ravenek JM, Bessler H, Engels C, Scherer‐Lorenzen M, Gessler A, Gockele A, De Luca E, Temperton VM, Ebeling A, Roscher C et al 2014. Long‐term study of root biomass in a biodiversity experiment reveals shifts in diversity effects over time. Oikos 123: 1528–1536. [Google Scholar]
- Reeder J, Knight R. 2010. Rapidly denoising pyrosequencing amplicon reads by exploiting rank‐abundance distributions. Nature Methods 7: 668–669. [DOI] [PMC free article] [PubMed] [Google Scholar]
- Rottstock T, Joshi J, Kummer V, Fischer M. 2014. Higher plant diversity promotes higher diversity of fungal pathogens, while it decreases pathogen infection per plant. Ecology 95: 1907–1917. [DOI] [PubMed] [Google Scholar]
- van Ruijven J, Berendse F. 2005. Diversity‐productivity relationships: initial effects, long‐term patterns, and underlying mechanisms. Proceedings of the National Academy of Sciences, USA 102: 695–700. [DOI] [PMC free article] [PubMed] [Google Scholar]
- van Ruijven J, Berendse F. 2009. Long‐term persistence of a positive plant diversity–productivity relationship in the absence of legumes. Oikos 118: 101–106. [Google Scholar]
- Sarmiento C, Zalamea P‐C, Dalling JW, Davis AS, Stump SM, U'Ren JM, Arnold AE. 2017. Soilborne fungi have host affinity and host‐specific effects on seed germination and survival in a lowland tropical forest. Proceedings of the National Academy of Sciences, USA 114: 11458–11463. [DOI] [PMC free article] [PubMed] [Google Scholar]
- Schnitzer SA, Klironomos JN, HilleRisLambers J, Kinkel LL, Reich PB, Xiao K, Rillig MC, Sikes BA, Callaway RM, Mangan SA et al 2011. Soil microbes drive the classic plant diversity‐productivity pattern. Ecology 92: 296–303. [DOI] [PubMed] [Google Scholar]
- Smith SE, Read D. 2008. Mycorrhizal symbiosis, 3rd edn Cambridge, UK: Academic Press. [Google Scholar]
- Tedersoo L, Bahram M, Polme S, Koljalg U, Yorou NS, Wijesundera R, Ruiz LV, Vasco‐Palacios AM, Thu PQ, Suija A et al 2014. Global diversity and geography of soil fungi. Science 346: 1256688. [DOI] [PubMed] [Google Scholar]
- Thomson BC, Tisserant E, Plassart P, Uroz S, Griffiths RI, Hannula SE, Buee M, Mougel C, Ranjard L, Van Veen JA et al 2015. Soil conditions and land use intensification effects on soil microbial communities across a range of European field sites. Soil Biology & Biochemistry 88: 403–413. [Google Scholar]
- Tilman D, Reich PB, Knops JMH. 2006. Biodiversity and ecosystem stability in a decade‐long grassland experiment. Nature 441: 629–632. [DOI] [PubMed] [Google Scholar]
- Unterseher M, Jumpponen A, Opik M, Tedersoo L, Moora M, Dormann CF, Schnittler M. 2011. Species abundance distributions and richness estimations in fungal metagenomics – lessons learned from community ecology. Molecular Ecology 20: 275–285. [DOI] [PubMed] [Google Scholar]
- Weiss SJ, Xu ZZ, Peddada S, Amir A, Bittinger K, Gonzalez A, Lozupone C, Zaneveld JR, Vázquez‐Baeza Y, Birmingham A et al 2017. Normalization and microbial differential abundance strategies depend upon data characteristics. Microbiome 5: 27. [DOI] [PMC free article] [PubMed] [Google Scholar]
- White TJ, Bruns T, Lee S, Taylor JW. 1990. Amplification and direct sequencing of fungal ribosomal RNA genes for phylogenetics. New York, NY, USA: Academic Press Inc. [Google Scholar]
- Wickham H. 2007. Reshaping data with the reshape package. Journal of Statistical Software 21: 1–20. [Google Scholar]
- Wickham H. 2009. ggplot2: elegant graphics for data analysis. New York, NY, USA: Springer. [Google Scholar]
Associated Data
This section collects any data citations, data availability statements, or supplementary materials included in this article.
Supplementary Materials
Please note: Wiley Blackwell are not responsible for the content or functionality of any Supporting Information supplied by the authors. Any queries (other than missing material) should be directed to the New Phytologist Central Office.
Fig. S1 Calibration curves for measuring species‐specific root abundance in root samples containing up to eight plant species.
Fig. S2 Community composition of root‐associated fungal phyla in monocultures.
Fig. S3 Diversity of the root‐associated fungal communities among plant species in monoculture.
Table S1 Primer pairs used for the quantification of the plant species abundance in mixed root samples using reverse transcriptase PCR
Table S3 Sources and sequences of isolated fungi, and the taxonomy of their closest BLAST hit to reference sequences in GenBank
Table S4 Statistical analysis of species‐specific root mass density along the diversity gradient
Table S2 Putative identities and functions of root‐associated fungal sequences characterised by 454‐pyrosequencing