

Abstract
An integrated analysis was performed with data from 4 phase 2 and phase 3 studies of tofogliflozin in which patients with type 2 diabetes mellitus received the sodium‐glucose cotransporter 2 inhibitor tofogliflozin for up to 24 weeks. Sex differences, baseline haemoglobin A1c (HbA1c) and serum uric acid (UA) levels, and log10‐transformed urinary N‐acetyl‐β‐D‐glucosaminidase ratio were significantly correlated with the reduction in serum UA levels at both 4 and 24 weeks in multivariate analysis (respectively, P < .0001). The decrease in HbA1c levels was greatest in the group with the highest baseline HbA1c level (quartile 4; HbA1c > 8.6%) and lowest in the group with the lowest baseline HbA1c level (quartile 1; HbA1c ≤ 7.4%). The decrease in serum UA levels was greatest in the quartile 1 group and lowest in the quartile 4 group. In most groups, the maximum decrease in serum UA levels was seen in the first 4 weeks, while the maximum decrease in HbA1c was seen at week 24. Thus, serum UA levels were significantly decreased in patients with moderate HbA1c levels.
Keywords: sodium‐glucose cotransporter 2 inhibitor, tofogliflozin, uric acid, urinary N‐acetyl‐β‐D‐glucosaminidase
1. INTRODUCTION
Impaired glucose metabolism, such as impaired glucose tolerance (IGT) and type 2 diabetes mellitus, is related to dyslipidaemia and hyperuricaemia. Data from the US Third Health and Nutrition Examination Survey have shown that serum levels of uric acid (UA) are closely related to glucose levels.1 Tofogliflozin, an oral hypoglycaemic agent developed by Chugai Pharmaceutical Co. Ltd., Kowa Co. Ltd., and Sanofi K.K., is an inhibitor of sodium‐glucose cotransporter 2 (SGLT2). The inhibitory mechanism of tofogliflozin is independent of insulin secretion, which blocks glucose reabsorption in the renal proximal tubule and facilitates urinary glucose excretion. Tofogliflozin reduces glycosylated haemoglobin (HbA1c) levels and body weight.2, 3, 4 Recent studies of treatment with an SGLT2 inhibitor have shown positive effects, not only on glucose metabolism, but also on serum lipid and UA levels.5, 6 Additionally, SGLT2 inhibitors have been reported to exert salutary effects on cardiovascular risk factors.7 In particular, a recent meta‐analysis clearly indicated that these inhibitors reduced serum UA levels.8 However, to our knowledge, the relationship between improved glycaemic control and serum UA level reduction has not been investigated in regard to the efficacy of tofogliflozin or other SGLT2 inhibitors.
The aims of the present study were to determine the effects of glycaemic conditions and serum UA levels on the efficacy of tofogliflozin and to determine factors predicting decreases in serum UA levels.
2. RESEARCH DESIGN AND METHODS
An integrated analysis was performed with data from 4 phase 2 and phase 3 studies of tofogliflozin (Table S1) lasting at least 24 weeks and which included patients with type 2 diabetes mellitus. The results of treatment were compared between a placebo and different doses of tofogliflozin. All studies were performed in accordance with the Declaration of Helsinki and Good Clinical Practice. The protocols were reviewed and approved by the institutional review board of each participating centre. All patients provided written informed consent before enrolment.
To assess the effect of baseline HbA1c levels and serum UA levels, the patients treated with tofogliflozin were divided into 4 groups, according to baseline HbA1c levels: patients with HbA1c quartile 1(HbA1c ≤ 7.4%), quartile 2 (7.4% < HbA1c ≤ 7.9%), quartile 3 (7.9% < HbA1c ≤ 8.6%) and quartile 4 (HbA1c > 8.6%). Supplementary information 1 was provided as additional information (research design and methods).
2.1. Statistical analysis
To determine differences among quartile groups, the changes in serum UA values from baseline to Week 24 were analysed using an analysis of covariance (ANCOVA) model, with the quartile group as a fixed effect and baseline UA and estimated glomerular filtration rate (eGFR) values as covariates. Similarly, changes in HbA1c were analysed with the baseline eGFR value as a covariate. For each quartile group, patient demographics were summarized with appropriate descriptive statistics (means and standard deviation [SD] for continuous variables and counts and percentages for categorical variables). Differences in changes across the quartile groups were also analysed with analysis of variance (ANOVA) and Fisher's exact test.
To identify baseline clinical factors that might affect serum UA levels at Weeks 4 and 24, 22 variables were included at baseline as potential factors in a multivariable model, with variables selected as clinically significant factors. Multivariate analysis was followed with stepwise model selection with P values <.05. From all 4 studies (CSG003JP, CSG004JP, CSG005JP, and CSG006JP), data up to 24 weeks were used. The (two‐sided) significance level for each test was .05 Supplementary information 2 was provided as additional information (statistical analysis).
3. RESULTS
The decreases in HbA1c levels in those who received tofogliflozin were significantly greater when baseline HbA1c levels were higher (P < .001 among groups) (Figure 1). HbA1c levels decreased in all 4 quartile groups (quartiles 1‐4) after tofogliflozin was administered for 24 weeks (P < .001 among all quartile groups). In contract, UA levels decreased to a greater degree in patients with lower baseline HbA1c levels (quartile 1 group). Furthermore, UA levels were lowest after tofogliflozin had been administered for 4 weeks (except for the levels in men in the quartile 4 group), but HbA1c levels gradually decreased and became lowest after 24 weeks of treatment with tofogliflozin (except for the levels in women in the quartile 1 group). Serum HbA1c levels decreased significantly from baseline to Weeks 4 and 24. However, serum UA levels had decreased significantly from baseline in women at Weeks 4 and 24 but not in men in the quartile 3 group at Week 24 or in the quartile 4 group at Weeks 4 or 24.
Figure 1.
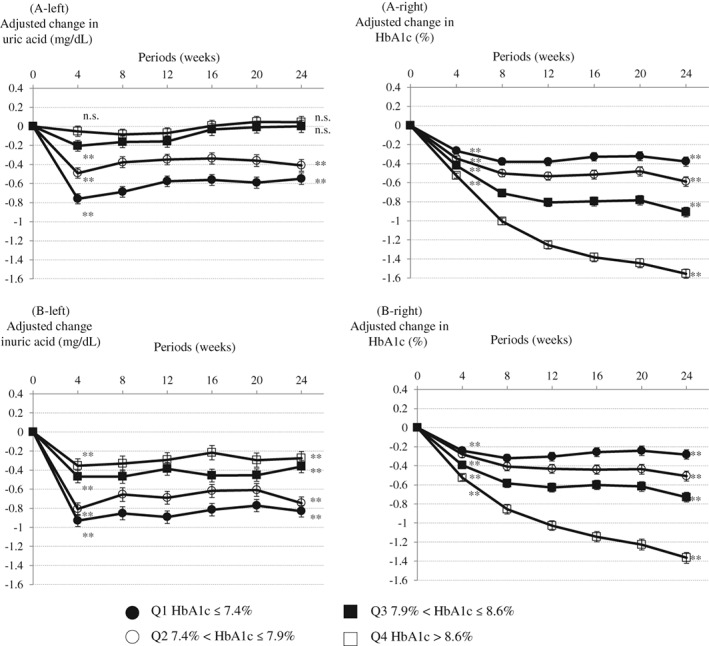
Change in glycosylated haemoglobin (HbA1c) levels (right panels) and uric acid levels (left panels) from baseline until Week 24 in patients receiving tofogliflozin. A, Men. B, Women. Least squares mean (standard error) (last observation carried forward [LOCF]). Analysis of covariance (ANCOVA) between groups. **P < .001, n.s.; not significant one sample t‐test vs baseline. Adjusted with baseline uric acid and estimated glomerular filtration rate (eGFR) as covariates for change in uric acid. Adjusted with baseline eGFR as a covariate for change in HbA1c
Sex differences, baseline levels of HbA1c and serum UA and log10‐transformed urinary N‐acetyl‐β‐D‐glucosaminidase (NAG)–creatinine ratio were significantly correlated with the reduction in serum UA levels at both 4 and 24 weeks (Table 1) (P < .0001, respectively). Baseline levels of serum UA and eGFR were negatively correlated with reduction in serum UA levels at 4 and 24 weeks. Sex differences (women) were also negatively correlated with reduction in serum UA levels. When patients were also treated with angiotensin II receptor blockers or diuretics, the baseline level of HbA1c, log10‐transformed urinary albumin creatinine ratio and log10‐transformed urinary NAG–creatinine ratio were positively correlated with the reduction in serum UA levels at 4 and 24 weeks. The degree of reduction in serum UA levels was greater in the subjects who received tofogliflozin than that in subjects who received a placebo (Figure S1). Additionally, in the subjects receiving tofogliflozin, the decreases in serum UA levels from baseline to week 24 were observed, regardless of the sexes.
Table 1.
Baseline factors influencing degrees of uric acid reduction
| Factors | β | P |
|---|---|---|
| Multivariate analysis for uric acid reduction at week 4 | ||
| Tofogliflozin (40 mg vs 10 mg) | 0.12 | .19 |
| Tofogliflozin (40 mg vs 20 mg) | 0.07 | .10 |
| Sex (women) | −0.46 | <.0001* |
| Angiotensin receptor blocker | 0.13 | .0034 |
| Diuretics | 0.19 | .0176 |
| Age (years) | −0.01 | .0065 |
| HbA1c (%) | 0.15 | <.0001* |
| Uric acid (mg/dL) | −0.31 | <.0001* |
| Fasting plasma glucose (mg/dL) | 0.002 | .0039 |
| Log10‐transformed urinary albumin–creatinine ratio (log10 mg/g Cr) | 0.07 | <.0001* |
| Log10‐transformed urinary NAG–creatinine ratio (log10 U/g Cr) | 0.19 | <.0001* |
| eGFR (mL/min/1.73 m2) | −0.01 | <.0001* |
| Multivariate analysis for uric acid reduction at week 24 | ||
| Tofogliflozin (40 mg vs 10 mg) | 0.10 | .3458 |
| Tofogliflozin (40 mg vs 20 mg) | −0.004 | .93 |
| Sex (women) | −0.56 | <.0001* |
| Angiotensin receptor blocker | 0.13 | .0137 |
| Diuretics | 0.27 | .0038 |
| Body mass index (kg/m2) | 0.02 | .0006 |
| HbA1c (%) | 0.21 | <.0001* |
| Homeostatic model assessment of insulin resistance | 0.005 | .0116 |
| Uric acid (mg/dL) | −0.3 | <.0001* |
| Log10‐transformed urinary albumin–creatinine ratio (log10 mg/g Cr) | 0.05 | .0093 |
| Log10‐transformed urinary NAG–creatinine ratio (log10 U/g Cr) | 0.2 | <.0001* |
| eGFR (mL/min/1.73m2) | −0.003 | .0427 |
Selected factors for the multivariate analysis: dosage of tofogliflozin, age, sex, duration of diabetes, glycosylated hemoglobin (HbA1c), fasting plasma glucose, glycoalbumin, homeostatic model assessment of insulin resistance, homeostatic model assessment of β cell function, systolic blood pressure, body mass index, log10‐transformed urinary albumin–creatinine ratio, log10‐transformed β2 microglobulin–creatinine ratio, log10‐transformed N‐acetyl‐β‐D‐glucosaminidase (NAG)–creatinine ratio, estimated glomerular filtration rate (eGFR), statin, angiotensin receptor blocker, calcium channel blocker, diuretics, antihypertensive drugs, antihyperuricemic drugs, uric acid.
P < .0001.
4. DISCUSSION
The factors affecting the reduction in UA levels were baseline serum levels of UA and HbA1c, the patient's sex and the urinary NAG‐creatinine ratio. The decrease in serum UA level was greater when the baseline serum UA level was higher.
In the present study, tofogliflozin also induced a greater reduction in HbA1c levels when the baseline HbA1c level was higher. An SGLT2 inhibitor induces weight loss, which might improve insulin resistance. A previous study showed that serum UA levels monotonically increased with an increase in fasting C‐peptide levels, which is similar to the increase in serum insulin levels and insulin resistance.1 Therefore, if insulin resistance or HbA1c levels decrease after administration of an SGLT2 inhibitor, serum UA is also thought to decrease. However, in the present study (Figure S2), the change in serum levels of HbA1c and UA tended to be negatively correlated in women, but uncorrelated in men. A reduction in serum UA levels might not be accompanied directly by a reduction in HbA1c. The reducing serum UA levels plateaued at 4 weeks after receiving the SGLT2 inhibitor. Improvement of insulin resistance with weight loss might have had only a limited influence on the reduction of serum UA levels, if any. The glycaemic control markers were significantly lower at baseline in patients with a decreased UA level than in patients with an increased UA level (Table S2). In addition, the absence of higher HbA1c levels at baseline was an independent factor for reduction in serum UA level achieved with tofogliflozin administration at both 4 and 24 weeks. An increase in the tofogliflozin dosage did not correlate with a reduction in the serum UA level in the present study. Similarly, in previous research with canagliflozin6 and in a recent meta‐analysis,8 no significant association was revealed between serum UA reduction and most of the SGLT2 inhibitors with a larger dosage.
The main finding of the present study, which was a unique feature, is that the transitive reductions of serum UA levels and HbA1c levels differed, demonstrated as a difference in the shape of the line graphs (Figure 1) in tofogliflozin‐administered patients. The serum levels of UA and HbA1c both decreased in general but were not clinically relevant. A previous cohort study1 found that serum UA levels increased with moderately increased levels of HbA1c, and then decreased as levels of HbA1c increased further (a bell‐shaped relationship). In the state of normal to moderately increased levels of HbA1c, serum UA levels are likely to be influenced by insulin resistance.1 When the blood glucose level is greater than 10 mmol/L (approximately 180 mg/dL), glycosuria can lead to uricosuria, which might be the biological mechanism underlying the bell‐shaped relationship.9 However, in the quartile 3 (7.9% < HbA1c ≤ 8.6%) and quartile 4 (HbA1c > 8.6%) groups of the present study, serum UA levels decreased in women, but were unchanged in men, despite reduced HbA1c levels. Choi et al. reported that the positive association between HbA1c levels (<7%) and serum UA levels was stronger in women than in men, and that the inverse association between HbA1c levels (≥7%) and serum UA levels was significantly stronger in men than in women.1
Urinary NAG is known to be a clinical marker of tubular damage and is increased in conditions of poor glycaemic control. For example, it is higher in patients with IGT than in patients with normal glucose tolerance and it is significantly and positively correlated with HbA1c levels.10 Furthermore, a prospective study showed that 24‐hour urinary NAG excretion was increased in patients with type 2 diabetes mellitus during conventional insulin therapy, but decreased in those receiving intensive insulin therapy.11 Through the analysis of longitudinal data, we have demonstrated that the urinary NAG‐creatinine ratio reflected long‐term blood glucose control in diabetes patients.12 Therefore, a relationship between increased urinary NAG and poorer glucose metabolism is likely. In addition, serum glucose levels are related to urinary NAG, and serum UA levels may also be related to urinary NAG. As shown in Table S3 and Figure 1, patients with better glycaemic control have a lower urinary NAG‐creatinine ratio, and the reduction in serum UA level after receiving an SGLT2 inhibitor is stronger. However, the mechanism of interaction between NAG and UA remains unclear.
The level of serum 1,5‐anhydroglucitol (1,5‐AG) is believed to decrease in patients who received an SGLT2 inhibitor.13 A small number of studies demonstrated a strong positive correlation between serum UA and 1,5‐AG levels.14, 15, 16 Yamanouchi et al. and the authors of the present study have shown negative associations between urinary NAG (U/L) levels,17 urinary NAG‐creatinine ratio levels18, 19 and serum 1,5‐AG. From the results of these studies, we are unable to exclude the possibility that 1,5‐AG was a mediator between the reduction in serum UA levels and treatment with SGLT2 inhibitors.
A limitation of this study is that some data were missing, such as levels of serum 1,5‐AG, urinary glucose and urinary UA. Despite this, we have reported, using multivariate analysis, a relationship between the change in serum UA levels and baseline characteristics in patients with type 2 diabetes who are receiving tofogliflozin.
In conclusion, the present study is, to the best of our knowledge, the first to demonstrate that serum UA levels decrease in patients with diabetes who have received an SGLT2 inhibitor, especially in those whose HbA1c levels are not greatly elevated before treatment. A further prospective long‐term study of cohorts, in vitro molecular action and pharmacological studies are required to confirm this presumed association.
Supporting information
Figure S1. Correlation between changes in uric acid and glycosylated haemoglobin (HbA1c) at Week 24. A, Men. B, Women. Pearson's product–moment correlation coefficient.
Figure S2. Change in uric acid. (■, Tofogliflozin; □, Placebo). Least squares mean (standard error) (last observation carried forward [LOCF]). One sample‐t vs baseline. **P < .001 vs baseline. Analysis of covariance (ANCOVA) between groups. Adjusted with baseline uric acid as a covariate.
Table S1. Integrated 4 clinical studies.
Table S2. Comparison of the baseline characteristics according to the change in uric acid.
Table S3. The characteristics with HbA1c quartile.
File S1.
ACKNOWLEDGMENTS
The authors thank the patients, the investigators and the staff at the study sites for their contribution to the study. The authors are grateful to Masao Okazaki, MD of the Academic Information Centre, Jikei University School of Medicine for his careful revision of the English in the manuscript. The original phase 2 and phase 3 studies of tofogliflozin were funded by Chugai Pharmaceutical Co., Ltd.
Conflict of interest
M. O. was an advisor to and received honoraria for lectures from Daiichi Sankyo, Otsuka Pharmaceutical, Kowa and Taisho Pharmaceutical. K. O. was an advisor to and received honoraria for lectures from Takeda, Taisho Pharmaceutical, Sumitomo Dainippon Pharma, Novartis, Mitsubishi Tanabe Pharma, Nippon Boehringer Ingelheim, and Daiichi Sankyo. K. K. has been an advisor to and received honoraria for lectures from Astelas, Novo Nordisk Pharma, Sanwa Kagaku Kenkyusho, Takeda, Taisho Pharmaceutical, MSD, Kowa, Kissei, Sumitomo Dainippon Pharma, Novartis, Mitsubishi Tanabe Pharma, Nippon Boehringer Ingelheim, Daiichi Sankyo and Sanofi.
H. S. and Y. F. are employees of Kowa. A. Y. is an employee of Kowa Pharmaceutical. A. M. received honoraria for lecturing from Daiichi Sankyo. T. S. received honoraria for lecturing from Astelas. M. Y. received research grants from Daiichi Sankyo, Sumitomo Dainippon Pharma, Mitsubishi Tanabe Pharma, Takeda, Shionogi and Esai. M. Y. received honoraria for lectures from MSD, Daiichi Sankyo, Mitsubishi Tanabe Pharma, Astelas, Sumitomo Dainippon Pharma, Takeda and Ono Pharmaceutical. N. A. received commissioned research funding for basic research from Kowa (from December 25, 2014 to December 25, 2015). N. A. received honoraria for lectures from Astelas, MSD, Daiichi Sankyo, Kowa, Kotobuki Pharma, Nippon Boehringer Ingelheim, Sanwa Kagaku Kenkyusho and Teijin Pharmaceutical. P. J., N. O., K. H. and T.F. had no conflicts of interest during the past 3 years.
Author contributions
M. O. and K. O. drafted the manuscript and contributed to the discussion. T. S., M. Y., T. F. and K. K. contributed to the discussion and reviewed/edited the manuscript. P. J., A. M., N. O., K. H. and N. A. reviewed and edited the manuscript. A. Y. and Y. F. researched data and reviewed the manuscript. H. S. created the database, performed statistical analyses and took responsibility for the integrity of the data and the accuracy of the data analyses. K. K. was a director involved in coordinating the original phase 2 and phase 3 studies of tofogliflozin. The authors are fully responsible for all content and editorial decisions, have been involved at all stages of manuscript development, and have approved the final version.
Ouchi M, Oba K, Kaku K, et al. Uric acid lowering in relation to HbA1c reductions with the SGLT2 inhibitor tofogliflozin. Diabetes Obes Metab. 2018;20:1061–1065. https://doi.org/10.1111/dom.13170
Funding information The original phase 2 and phase 3 studies of tofogliflozin were funded by Chugai Pharmaceutical Co., Ltd.
REFERENCES
- 1. Choi HK, Ford ES. Haemoglobin A1c, fasting glucose, serum C‐peptide and insulin resistance in relation to serum uric acid levels‐‐the Third National Health and Nutrition Examination Survey. Rheumatology (Oxford). 2008;47:713‐717. [DOI] [PubMed] [Google Scholar]
- 2. Kaku K, Watada H, Iwamoto Y, et al. Efficacy and safety of monotherapy with the novel sodium/glucose cotransporter‐2 inhibitor tofogliflozin in Japanese patients with type 2 diabetes mellitus: a combined phase 2 and 3 randomized, placebo‐controlled, double‐blind, parallel‐group comparative study. Cardiovasc Diabetol. 2014;13:65. [DOI] [PMC free article] [PubMed] [Google Scholar]
- 3. Ikeda S, Takano Y, Cynshi O, et al. A novel and selective sodium‐glucose cotransporter‐2 inhibitor, tofogliflozin, improves glycaemic control and lowers body weight in patients with type 2 diabetes mellitus. Diabetes Obes Metab. 2015;17:984‐993. [DOI] [PubMed] [Google Scholar]
- 4. Terauchi Y, Tamura M, Senda M, Gunji R, Kaku K. Efficacy and safety of tofogliflozin in Japanese patients with type 2 diabetes mellitus with inadequate glycaemic control on insulin therapy (J‐STEP/INS): Results of a 16‐week randomized, double‐blind, placebo‐controlled multicentre trial. Diabetes Obes Metab. 2017;19:1397‐1407. [DOI] [PMC free article] [PubMed] [Google Scholar]
- 5. Tanizawa Y, Kaku K, Araki E, et al. Long‐term safety and efficacy of tofogliflozin, a selective inhibitor of sodium‐glucose cotransporter 2, as monotherapy or in combination with other oral antidiabetic agents in Japanese patients with type 2 diabetes mellitus: multicenter, open‐label, randomized controlled trials. Expert Opin Pharmacother. 2014;15:749‐766. [DOI] [PubMed] [Google Scholar]
- 6. Davies MJ, Trujillo A, Vijapurkar U, Damaraju CV, Meininger G. Effect of canagliflozin on serum uric acid in patients with type 2 diabetes mellitus. Diabetes Obes Metab. 2015;17:426‐429. [DOI] [PMC free article] [PubMed] [Google Scholar]
- 7. Rajasekeran H, Lytvyn Y, Cherney DZ. Sodium‐glucose cotransporter 2 inhibition and cardiovascular risk reduction in patients with type 2 diabetes: the emerging role of natriuresis. Kidney Int. 2016;89:524‐526. [DOI] [PubMed] [Google Scholar]
- 8. Zhao Y, Xu L, Tian D, et al. Effects of sodium‐glucose co‐transporter 2 (SGLT2) inhibitors on serum uric acid level: A meta‐analysis of randomized controlled trials. Diabetes Obes Metab. 2018;20:458‐462. [DOI] [PubMed] [Google Scholar]
- 9. Cook DG, Shaper AG, Thelle DS, Whitehead TP. Serum uric acid, serum glucose and diabetes: relationships in a population study. Postgrad Med J. 1986;62:1001‐1006. [DOI] [PMC free article] [PubMed] [Google Scholar]
- 10. Ellis EN, Brouhard BH, Lagrone L, Travis LB. Urinary excretion of N‐acetyl‐β‐D‐glucosaminidase in children with type I diabetes mellitus. Diabetes Care. 1983;6:251‐255. [DOI] [PubMed] [Google Scholar]
- 11. Ohkubo Y, Kishikawa H, Araki E, et al. Intensive insulin therapy prevents the progression of diabetic microvascular complications in Japanese patients with non‐insulin‐dependent diabetes mellitus: a randomized prospective 6‐year study. Diabetes Res Clin Pract. 1995;28:103‐117. [DOI] [PubMed] [Google Scholar]
- 12. Oba K, Igari Y, Matsumura N, et al. Effect of control of blood glucose on urinary excretion of N‐acetyl‐β‐D‐glucosaminidase in elderly type 2 diabetes mellitus. J Nippon Med Sch. = Nihon Ika Daigaku Zasshi. 2000;67:143‐145. [DOI] [PubMed] [Google Scholar]
- 13. Balis DA, Tong C, Meininger G. Effect of canagliflozin, a sodium‐glucose cotransporter 2 inhibitor, on measurement of serum 1,5‐anhydroglucitol. J Diabetes. 2014;6:378‐380. [DOI] [PubMed] [Google Scholar]
- 14. Gotoh M, Li C, Yatoh M, et al. Serum uric acid concentrations in type 2 diabetes: its significant relationship to serum 1,5‐anhydroglucitol concentrations. Endocr Regul. 2005;39:119‐125. [PubMed] [Google Scholar]
- 15. Koga M, Murai J, Saito H, et al. Close relationship between serum concentrations of 1,5‐anhydroglucitol and uric acid in non‐diabetic male subjects implies common renal transport system. Clin Chim Acta. 2009;410:70‐73. [DOI] [PubMed] [Google Scholar]
- 16. Ouchi M, Oba K, Aoyama J, et al. Serum uric acid in relation to serum 1,5‐anhydroglucitol levels in patients with and without type 2 diabetes mellitus. Clin Biochem. 2013;46:1436‐1441. [DOI] [PubMed] [Google Scholar]
- 17. Yamanouchi T, Kawasaki T, Yoshimura T, et al. Relationship between serum 1,5‐anhydroglucitol and urinary excretion of N‐acetylglucosaminidase and albumin determined at onset of NIDDM with 3‐year follow‐up. Diabetes Care. 1998;21:619‐624. [DOI] [PubMed] [Google Scholar]
- 18. Ouchi M, Oba K, Motoyama M, et al. Postprandial glycemic control conditions in relation to urinary N‐acetyl‐β‐D‐glucosaminidase in patients with type 2 diabetes mellitus without low glomerular filtration rate. Diabetes Technol Ther. 2014;16:41‐47. [DOI] [PubMed] [Google Scholar]
- 19. Ouchi M, Oba K, Ohara M, et al. Change in urinary N‐acetyl‐β‐D‐glucosaminidase levels relevant to postprandial glycemic control conditions in subjects without diabetes mellitus. Clin Chim Acta. 2014;433:88‐92. [DOI] [PubMed] [Google Scholar]
Associated Data
This section collects any data citations, data availability statements, or supplementary materials included in this article.
Supplementary Materials
Figure S1. Correlation between changes in uric acid and glycosylated haemoglobin (HbA1c) at Week 24. A, Men. B, Women. Pearson's product–moment correlation coefficient.
Figure S2. Change in uric acid. (■, Tofogliflozin; □, Placebo). Least squares mean (standard error) (last observation carried forward [LOCF]). One sample‐t vs baseline. **P < .001 vs baseline. Analysis of covariance (ANCOVA) between groups. Adjusted with baseline uric acid as a covariate.
Table S1. Integrated 4 clinical studies.
Table S2. Comparison of the baseline characteristics according to the change in uric acid.
Table S3. The characteristics with HbA1c quartile.
File S1.