

Abstract
Objectives. To assess the impact of the expansion of Medicaid eligibility in the United States on the opioid epidemic, as measured through increased access to opioid analgesic medications and medication-assisted treatment.
Methods. Using Medicaid enrollment and reimbursement data from 2011 to 2016 in all states, we evaluated prescribing patterns of opioids and the 3 Food and Drug Administration–approved medications used in treating opioid use disorders by using 2 statistical models. We used difference-in-differences and interrupted time series models to measure prescribing rates before and after state expansions.
Results. Although opioid prescribing per Medicaid enrollee increased overall, we observed no statistical difference between expansion and nonexpansion states. By contrast, per-enrollee rates of buprenorphine and naltrexone prescribing increased more than 200% after states expanded eligibility, while increasing by less than 50% in states that did not expand. Methadone prescribing decreased in all states in this period, with larger decreases in expansion states.
Conclusions. The Medicaid expansion enrolled a population no more likely to be prescribed opioids than the base Medicaid population while significantly increasing uptake of 2 drugs used in medication-assisted treatment.
The United States is in the midst of an epidemic of opioid drug use, constituting one of the worst public health crises in recent history. In 2015, more than 52 000 people died from drug overdoses, and early estimates suggest continuing increases in mortality in 2016 and 2017.1,2 Today, drug overdose is the leading cause of accidental death in the country and contributes to more deaths than do motor vehicle accidents.3,4
The response to rising opioid use and mortality will require increased access to evidence-based treatment options for people who use drugs. Currently, methadone, buprenorphine, and naltrexone are the only Food and Drug Administration (FDA)–approved medications produced for and used in the treatment of opioid dependence. According to the World Health Organization and Centers for Disease Control and Prevention (CDC), medication-assisted treatment (MAT) is the most effective regimen for reducing drug use and is effective in reducing overdose rates, HIV transmission, and criminal activity, while increasing treatment retention.5,6 Yet nearly 9 out of 10 people with substance use disorders do not access treatment services, and lack of health insurance is cited as a primary barrier to accessing treatment by nearly one third of those with an identified need for treatment.6
Medicaid is a major funder of substance use treatment programs and in 2015 covered services for 17% of all adults with substance use disorder.7,8 The Patient Protection and Affordable Care Act (ACA) included several provisions that increased access to substance use disorder treatment. In addition to enabling states to expand Medicaid eligibility to low-income adults, the ACA established guidance such that state benchmark plans must include a specified set of essential health benefits, including mental health and substance use disorder services.9 In addition, the Mental Health Parity and Addiction Equity Act, which mandates that mental health services be offered at parity with other types of medical care, is expanded to apply to plans in the expansion. Previous work finds that the number of Medicaid-reimbursed prescriptions for buprenorphine increased in states that expanded Medicaid, although many low-income adults with substance use disorders in all states continue to have limited access to affordable treatment.10 In addition, Medicaid expansion may increase access by increasing health system capacity, as shown by documented increases in the number of Drug Addiction Treatment Act of 2000–waived physicians eligible to prescribe buprenorphine in states that expanded Medicaid.11
While the Medicaid expansion has increased access to MAT, it may have similarly increased access to opioid analgesic medications. Historical analyses have found opioid prescribing rates for the Medicaid population to be more than double the rates for non-Medicaid enrollees, raising concerns that Medicaid expansion may inadvertently act as a driver of opioid abuse and addiction.12 Citing increased access to pharmaceuticals as a potential driver of opioid use and addiction, both in the Medicaid population and also generally, several states have instituted policies to reduce access to opioids, including setting limits on the number of opioid pills that can be prescribed or requiring prior authorization before prescribing.13–17
However, despite the role of Medicaid as a major payer of substance use disorder treatment,18 the expansion’s impact on the opioid epidemic has not been sufficiently quantified. Recently, at least 1 analysis has refuted the assertion that Medicaid expansion has contributed to rising opioid use and mortality, but no previous work has quantitatively described the impact of the ACA’s changes to Medicaid eligibility on both opioid drug use and treatment.19 Using both a difference-in-differences model and an interrupted time series model, this analysis describes prescribing patterns for opioids and the 3 FDA–approved medications for opioid use disorder treatment before and after Medicaid expansion, providing an important body of evidence on the role of Medicaid programs in the opioid epidemic.
METHODS
We used data on prescriptions reimbursed by Medicaid from Medicaid’s State Drug Utilization Data for years 2011 through 2016.20 We calculated the number of prescriptions reimbursed quarterly by the Medicaid program by state for opioid analgesics, buprenorphine–naloxone (hereafter, buprenorphine), methadone, and naltrexone (oral and injectable formulations) used for substance use treatment, by using the FDA’s National Drug Code Directory and the CDC’s data file of oral morphine milligram equivalent (MME) conversion factors.21,22 Where the number of prescriptions of a medication was fewer than 11 per state per quarter, data were suppressed and therefore were unavailable. These suppressed values, on average of per-quarter, per-drug observations across all years, comprised 46.2% of observations for opioids, 38.6% for buprenorphine, 49.3% for methadone, and 40.4% for naltrexone. At the maximum number requiring suppression, the overall count of prescriptions reimbursed was decreased by only 0.020% because of suppression.
We measured quarterly rates of prescribing of each medication per annual count of Medicaid enrollees by using Centers for Medicare and Medicaid Services enrollment reports.23,24 We measured both the number of prescriptions and the number of units prescribed, for both opioids and MAT drugs. A “unit” is defined by drug, typically representing a capsule, gram, milliliter, tablet, or transdermal patch. To assess trends in the strength of opioid drugs prescribed over time, we calculated the number of MMEs, a standardized measure of opioid dosage, by using CDC conversion factors.22 We excluded states in which Medicaid does not reimburse methadone (n = 17) or naltrexone (n = 1) for substance use disorders from those drug-specific analyses; all states reimburse buprenorphine.25
We categorized all states and the District of Columbia as “expansion” states if they eventually expanded Medicaid (n = 32) and “nonexpansion” if they did not expand by the end of 2016 (n = 19). We took the date of Medicaid expansion for each state from the Kaiser Family Foundation’s database.26 In both expansion and nonexpansion states, we centered dates at the first quarter of 2014, the date when Medicaid expansion went into effect for most states. For the states that expanded eligibility after January 1, 2014 (n = 7), we centered dates at the state-specific date of expansion. We measured the impact of Medicaid expansion on opioid and medications for substance use disorders with 2 models: (1) a difference-in-differences model with state-level fixed effects and (2) an interrupted time series method with state-level fixed effects, with temporal interaction terms, on the period 2011 to 2016. We selected these models to both assess the overall effect size of the expansion on prescribing as well as to provide a more nuanced assessment of both the pre–post changes and the temporal changes in trends in this period. These models are described as follows:
 |
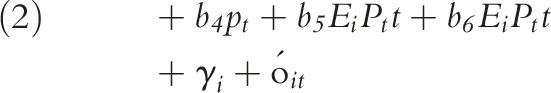 |
where b coefficients measure the estimated effect size on prescribing for the following indicators: Ei is an indicator for Medicaid expansion states (0 = states that did not expand; 1 = states that did expand), Pt is an indicator for the postexpansion time period (0 = preexpansion; 1 = postexpansion), and t is a continuous measure of time at 3-month quarterly intervals (from 2011 to 2016). The γi is state-level fixed effects and  is an error term. The models are assessed where
  represents the number of prescriptions, the count of units prescribed, and the MMEs.
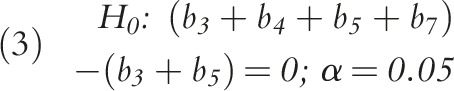
To measure the overall impact of the Medicaid expansion on prescribing rates in this period, we tested the following hypotheses: for the difference-in-differences model (Equation 1), we measured the impact by testing the significance of the b2 coefficient, while in the interrupted time series model (Equation 2), we assessed the impact of the expansion by b5 and b6, where b5 measures changes in prescribing rates at the transition from before expansion to after expansion, and where b6 represents changes in the trend in prescribing in the postexpansion period. We measured the overall trends in prescribing rates by postestimation tests of linear combinations of coefficients. For example, we tested the difference in trends after expansion in states that expanded Medicaid relative to those that did not by
 |
We performed all analyses with Stata version 15 (StataCorp LP, College Station, TX).
RESULTS
A total of 181 485 806 opioid prescriptions, totaling 10 745 379 857 units (e.g., pills, tablets, sprays, milligrams) of opioids, were reimbursed by Medicaid from 2011 to 2016. In 2013, the year preceding the Medicaid expansion, Medicaid expansion states had an average of 12 138 opioid prescriptions per 100 000 Medicaid enrollees (Table 1). In nonexpansion states, opioid prescribing rates were 10 861 per 100 000 enrollees in 2013. Similarly, both the number of units prescribed and the MMEs per 100 000 were higher in expansion states than in nonexpansion states during the preexpansion period (Figure A, available as a supplement to the online version of this article at http://www.ajph.org).
TABLE 1—
Prescribing Characteristics in the First Quarter (January–March) of 2013 and in the First Quarter of 2015, in States That Expanded and Did Not Expand Medicaid Eligibility: United States
| Characteristics | Did Not Expand, Mean (SE) | Expanded, Mean (SE) | Difference (95% CI) |
| Q1 2013 | |||
| Prescriptions per 100 000 enrollees | |||
| Opioids | 10 861.0 (4 476.8) | 12 138.1 (3 978.1) | −1 277.1 (−3 703.1, 1 148.9) |
| Buprenorphine | 536.6 (1 142.0) | 969.0 (1 527.2) | −432.4 (−1 263.4, 398.7) |
| Methadone | 196.8 (143.8) | 318.8 (224.2) | −122.0 (−237.5, −6.5) |
| Naltrexone | 42.7 (35.1) | 49.9 (48.6) | −7.2 (−34.8, 20.4) |
| Units reimbursed per 100 000 enrollees | |||
| Opioids | 607 987.0 (276 481.6) | 773 705.1 (448 303.3) | −165 718.1 (−395 028.5, 63 592.2) |
| Buprenorphine | 18 100.6 (31 750.1) | 26 943.1 (28 774.5) | −8 842.5 (−26 532.7, 8 847.5) |
| Methadone | 25 816.5 (19 378.9) | 45 315.3 (33 034.3) | −19 498.8 (−36 245.0, 2 747.7) |
| Naltrexone | 1 296.2 (974.8) | 1 427.5 (1 248.4) | −131.3 (−853.3, 590.5) |
| MMEs per 100 000 enrollees: opioids | 647 158.7 (370 754.1) | 907 012.1 (535 205.4) | −259 853.4 (−540 019.0, 20 312.2) |
| Q1 2015 | |||
| Prescriptions per 100 000 enrollees | |||
| Opioids | 22 719.9 (40 602.0) | 20 001.5 (24 714.9) | 2 718.4 (−15 613.1, 21 049.9) |
| Buprenorphine | 621.9 (1 064.6) | 1 756.0 (2 579.9) | −1 134.1 (−2 418.5, 150.1) |
| Methadone | 315.4 (568.9) | 300.0 (291.9) | 15.4 (−229.4, 260.2) |
| Naltrexone | 101.3 (205.8) | 104.2 (136.6) | −2.9 (−102.5, 96.8) |
| Units reimbursed per 100 000 enrollees | |||
| Opioids | 1 331 492.5 (227 620.4) | 1 168 961.8 (1 450 756.1) | 162 530.7 (−888 073.4, 1 213 135.4) |
| Buprenorphine | 19 660.8 (24 042.5) | 56 499.6 (93 709.3) | −36 838.8 (−82 248.6, 8571.1) |
| Methadone | 38 489.9 (61 004.0) | 38 421.2 (39 997.9) | 68.7 (−28 603.0, 28 740.5) |
| Naltrexone | 3 437.2 (8 258.4) | 2 547.3 (3 225.2) | 889.9 (−2 465.3, 4 245.2) |
| MMEs per 100 000 enrollees: opioids | 1 380 219.6 (2 184 246.7) | 1 472 694.4 (2 040 427.4) | −92 474.8 (–1 311 461.3, 1 126 511.0) |
Note. CI = confidence interval; MME = morphine milligram equivalents. Prescribing rates are per 100 000 Medicaid enrollees.
Postexpansion Opioid Prescription Differences
On average, in all states, opioid prescribing rates increased from preexpansion to postexpansion periods (Figure 1, Table 1). According to the difference-in-differences model, average prescription rates increased by 5985 per 100 000 in nonexpansion states and by 4366 per 100 000 in expansion states (Table 2). This difference in the differences in prescribing rates in expansion relative to nonexpansion states was not statistically significant. We saw similar patterns in rates of opioid units prescribed and MME prescribing (Figure A, Table A, and Table B, available as supplements to the online version of this article at http://www.ajph.org).
FIGURE 1—

Number of Prescriptions per 100 000 Medicaid Enrollees From 2011 to 2016 in States That (a) Expanded and (b) Did Not Expand Medicaid: United States
Note. MAT = medication-assisted treatment.
TABLE 2—
Regression Table for Difference-in-Differences Model With State-Level Fixed Effects for Number of Prescriptions: United States, 2011–2016
| Opioids, b (95% CI) | Buprenorphine, b (95% CI) | Methadone, b (95% CI) | Naltrexone, b (95% CI) | |
| Post (1 = postexpansion; 0 = preexpansion) | 5 985.31 (3 700.49, 8 270.13) | 214.07 (15.79, 412.35) | −8.37 (–60.54, 43.80) | 36.44 (21.98, 50.90) |
| Post × expanded | −1 619.79 (–4 541.75, 1 302.16) | 996.67 (744.71, 1 248.64) | −56.30 (–120.32, 7.73) | 38.99 (20.69, 57.28) |
| (Constant) | 12 226.25 (11 291.60, 13 160.91) | 760.71 (679.29, 842.14) | 335.69 (315.56, 355.82) | 48.87 (43.06, 54.67) |
Note. CI = confidence interval. All prescribing rates are number of prescriptions reimbursed by Medicaid per 100 000 Medicaid enrollees.
In the interrupted time series model, the mean level of opioid prescriptions per 100 000 enrollees increased in all states between the preexpansion and postexpansion period, again with no significant difference between expansion and nonexpansion states (Table 3). In the period before the expansion, quarterly prescribing rates increased by an average of 62 prescriptions per 100 000 each quarter in expansion states and by 217 per quarter in nonexpansion states, although these trends were not significant, nor were they significantly different from each other. After an increase in prescribing at the time of the expansion, prescribing rates began to decline slightly in all states, with the rate of prescribing decreasing by 448 prescriptions per 100 000 every quarter in the nonexpansion states and by 230 per quarter in expansion states; again, this trend was not significant in either group.
TABLE 3—
Regression Table for Interrupted Time Series Model With State-Level Fixed Effects for Number of Prescriptions: United States, 2011–2016
| Opioids, b (95% CI) | Buprenorphine, b (95% CI) | Methadone, b (95% CI) | Naltrexone, b (95% CI) | |
| Post (1 = postexpansion; 0 = preexpansion) | 7 376.54 (2 769.77, 11 983.3) | −105.74 (−484.92, 273.43) | 131.42 (26.78, 236.06) | 25.49 (−3.01, 54.00) |
| Post × expanded | −2 090.27 (−7 884.19, 3 703.65) | −107.95 (−366.44, 582.34) | −78.90 (−206.34, 48.53) | −18.75 (−54.21, 16.70) |
| Time (quarters) | 216.55 (−193.69, 626.79) | 43.47 (8.98, 77.95) | −9.51 (−18.83, −0.19) | 0.59 (−1.93, 3.12) |
| Time × post | −664.25 (−1 331.90, 3.40) | −32.54 (−87.52, 22.43) | −4.28 (−19.46, 10.90) | 0.63 (−3.48, 4.75) |
| Time × expanded | −154.61 (−643.18, 333.96) | 28.84 (−12.45, 70.13) | −0.02 (−11.05, 11.08) | 0.74 (−2.24, 3.73) |
| Time × expanded × post | 372.33 (−463.47, 1 208.13) | 96.49 (27.74, 165.24) | 3.66 (−14.79, 22.11) | 8.56 (3.47, 13.64) |
| (Constant) | 12 967.47 (11 268.62, 14 666.32) | 1 135.77 (995.69, 1 275.85) | 277.47 (240.71, 314.24) | 55.62 (45.23, 66.02) |
Note. CI = confidence interval. All prescribing rates are number of prescriptions reimbursed by Medicaid per 100 000 Medicaid enrollees.
Overall, this model showed an increase in opioid prescribing in this time period, with the expansion of Medicaid eligibility not differentially impacting the overall growth in opioid prescribing rates nor the quarterly trends. We observed the same pattern for the number of units prescribed per 100 000 enrollees (Tables A and C, available as supplements to the online version of this article at http://www.ajph.org) and the MME prescribing rate (Table B).
Medication-Assisted Treatment
From 2011 to 2016, 11 166 525 prescriptions of buprenorphine, 3 267 551 of methadone, and 892 402 of naltrexone were reimbursed by Medicaid. The number of MAT prescriptions per 100 000 Medicaid enrollees was higher in 2013, the year before the expansion, for all 3 drugs in states that expanded Medicaid relative to those that did not expand (Table 1).
In the difference-in-differences model, buprenorphine prescribing increased across all states from the period before the expansion to the period after, with significantly larger increases in expansion states (P < .001). In expansion states, the rate of buprenorphine prescriptions increased by 1211 prescriptions per 100 000 from the preexpansion period to the postexpansion period, while in states that did not expand prescribing, they increased by 214 prescriptions per 100 000 (Table 2). Overall, expansion states increased buprenorphine prescribing rates by 997 units per 100 000 more than did nonexpansion states. In the analysis of units prescribed, we observed no significant change in the level of units of buprenorphine prescribed per 100 000 in nonexpansion states, while the number of units prescribed increased significantly for expansion states (Table A).
In the interrupted time series analysis of MAT, before the expansion, the quarterly rate of buprenorphine prescribing was increasing in both expansion (72.3 units per 100 000 per quarter) and nonexpansion states (43.5 units per 100 000 per quarter). This difference was not statistically significant (Table 3). After the expansion, the rate of buprenorphine prescribing leveled off slightly in the nonexpansion states, while the prescribing rate increased by 136.3 units per 100 000 every quarter in the expansion states, a statistically significant rate increase (P < .001). We observed a similar trend in the number of units prescribed per 100 000 enrollees (Table C).
By contrast, methadone prescribing exhibited an overall declining trend in the 2011–2016 period. In the difference-in-differences model, the number of methadone prescriptions per 100 000 did not significantly change in nonexpansion states but decreased by 65 per 100 000 in expansion states (P = .001; Table 2). The number of units of methadone prescribed decreased in both expansion and nonexpansion states, with a larger decrease in expansion than in nonexpansion states (–6551 per 100 000 in nonexpansion, −13 313 per 100 000 in expansion states; P < .001; Table A).
Temporal trends in the quarterly number of per-enrollee methadone prescriptions revealed a significant downward trend in the preexpansion period in both expansion (–9.50 units per 100 000 per quarter) and nonexpansion (–9.51 units per 100 000 per quarter) states (Table 3), as well as in units prescribed (Table C). The trends were not significantly different in this period. In the postexpansion period, we observed a similar downward trend, with the rate of change again not significantly different between the 2 groups.
Finally, the rate of naltrexone prescribing increased by 75 prescriptions per 100 000 in expansion states and by 36 prescriptions per 100 000 in nonexpansion states in the difference-in-differences model, with the increased prescribing significantly higher in expansion states (P < .001; Table 2). The number of units of naltrexone prescribed per 100 000 similarly increased in this period, although we observed no difference in expansion relative to nonexpansion states (Table Ag).
In the interrupted time series model, the trend in the rate of naltrexone prescriptions per 100 000 enrollees was flat in all groups and periods, with the exception of a significant increasing trend in prescribing rates (10.5 prescriptions per 100 000 per quarter) in expansion states after the expansion (Table 3). The trend in the rate of units prescribed similarly increased by 141.91 units per 100 000 every quarter in expansion states after the expansion (Table C) but did not change in any other period or group.
DISCUSSION
States that did and did not expand Medicaid had similar growth in opioid prescribing rate per Medicaid enrollee after expansion, while per-enrollee rates of Medicaid-reimbursed MAT increased significantly more in expansion states. The results from both models showed an overall increase in the rate of per-enrollee opioid prescribing in the period after January 2014, or after the date of Medicaid expansion for states that expanded later, through the end of 2016 in all states. This increase in opioid prescribing per state number of enrollees was not statistically different in states that expanded Medicaid to low-income adults under the ACA relative to those that did not expand. Although there was an overall increase in the quarterly trend of opioid prescribing in the preexpansion period, the trends in opioid prescribing rates were not different in expansion and nonexpansion states.
As with opioid prescribing, the per-enrollee rates of prescribing for all 3 MAT drugs was higher at the preexpansion baseline in states that ultimately expanded Medicaid relative to those that did not. For buprenorphine, the quarterly growth in prescribing was significantly higher in expansion states after the expansion, while the trend in nonexpansion states did not change. For methadone, we found overall declining rates of prescribing, with larger decreases in expansion states across this period. Naltrexone prescribing was higher in expansion states in the pre- and postexpansion period, and both the growth in prescribing after the expansion as well as the change in the rate of prescribing were significantly greater in states that expanded than in those that did not.
These findings suggest that the population of low-income adults newly eligible for Medicaid as part of the ACA’s expansion were no more likely to be prescribed opioid medications than the base preexpansion population, while being more likely to access treatment of substance use disorders. States that expanded Medicaid had historically higher rates of per-enrollee opioid prescribing in the Medicaid population, although this did not appear to be driven by the population of newly eligible enrollees. Rather, the expansion of Medicaid eligibility appears to have primarily served as an important source of access to MAT of low-income adults with substance use disorders.
The finding that the rate of MME prescribing increased in this time period contrasts with a recent analysis of per-capita MME prescribing in the total population, which found that national opioid prescribing rates have declined from 2010 to 2015.27 Our findings are corroborated by this analysis, which found that opioid prescribing rates were highest in communities with large populations without health insurance or enrolled in Medicaid. It is outside of the scope of this analysis to determine why prescribing has increased among Medicaid enrollees yet declined nationally; as the indication for each prescription is not publicly available, neither the appropriateness of each prescription nor the condition each was intended to treat can be evaluated. It is nonetheless apparent that high prescribing in the Medicaid population predates the ACA, and we observed no differential effect on prescribing in states that expanded Medicaid relative to those that did not. These findings are corroborated by other analyses that have found that the Medicaid expansion had no differential impact on drug-related mortality.19
Trends in the number of opioid prescriptions, the units of opioids prescribed, and the number of MMEs prescribed were similar. As such, we observed no distinct trends in the number of units per prescription or the relative potency of prescriptions over time, suggesting that changes in the number of prescriptions were neither offset nor compounded by changes in the number of units prescribed or the comparative potency of the drugs prescribed. However, the number of MMEs per capita observed in these data was considerably higher than that described in the total population; this finding may be attributable to the comparatively high proportion of Medicaid enrollees who have disabilities requiring long-term pain management or who are aged 65 years or older.27,28
In addition, we found a general trend toward the use of buprenorphine in MAT and a shift away from methadone. Although naltrexone occupies a smaller proportion of the MAT prescribing in this population, its use increased in this period. This trend, whether driven by provider or patient, may be driven by the lower risk for addiction or overdose in buprenorphine and naltrexone relative to methadone. In addition, methadone is typically administered via daily in-person clinic visits, whereas buprenorphine and naltrexone can be administered by larger “take-home” doses or through long-term injectable formulations. The burden of patient visits, which may incur financial costs, opportunity costs, and increased stigma, may also contribute toward the shift away from methadone.
This analysis was limited by several factors. First, the suppression of drugs or quarters with low prescribing rates limited our ability to fully describe all trends in prescribing, although this analysis nonetheless describes trends of the most commonly prescribed drugs in the Medicaid program. Second, the use of state-level data may mask microtrends within states or mask differential impacts by urbanicity, distribution of substance use treatment programs or services, or health facility practices. In future research, more granular assessments that measure subnational enrollment and prescribing patterns will facilitate a more complete assessment of the impact of the Medicaid expansion.
Third, the prescribing data did not include the indication nor the patient diagnosis, which may confound the findings. Indeed, methadone is used not just for treating opioid dependence, but is also used as an analgesic, and naltrexone is also approved for the treatment of alcohol addiction. Fourth, we identified 5 states where the proportion of data from managed care organizations was lower than would be predicted by the proportion of Medicaid enrollees in managed care organizations. The main findings are unchanged by excluding these states, except that in the difference-in-differences model opioid prescribing rates did expand significantly in expansion states, while remaining nonsignificant for units, MMEs, and in the interrupted time series model. Finally, we were not able to measure trends in the number of days associated with each prescription, an important metric that can signify patterns of overprescribing. Nonetheless, the use of 3 distinct metrics of prescribing (number of prescriptions, number of units prescribed, and MMEs) provide a multifaceted assessment that triangulates state-level trends in prescribing patterns.
This analysis of Medicaid prescribing data suggests that the expansion of insurance coverage in expansion states provided health insurance coverage to a population no more likely to be prescribed opioids than the preexpansion population, while significantly increasing access to treatment for people with substance use disorders. Continuing to address the opioid epidemic should maintain a focus on increasing access to health care and increasing health system capacity to provide substance abuse treatment of all those in need.
HUMAN PARTICIPANT PROTECTION
This analysis did not involve human participants or personally identifiable information. Institutional review board approval was not required.
Footnotes
See also Humphreys, p. 589.
REFERENCES
- 1. Results from the 2015 National Survey on Drug Use and Health: Detailed Tables. Rockville, MD: Substance Abuse and Mental Health Services Administration; 2016. [PubMed]
- 2.Katz J. Drug deaths in America are rising faster than ever. New York Times. June 5, 2017. Available at: https://www.nytimes.com/interactive/2017/06/05/upshot/opioid-epidemic-drug-overdose-deaths-are-rising-faster-than-ever.html. Accessed December 1, 2017.
- 3. NCHS data on drug-poisoning deaths. Atlanta, GA: National Center for Health Statistics; 2017.
- 4.All injuries. National Center for Health Statistics. 2017. Available at: https://www.cdc.gov/nchs/fastats/injury.htm. Accessed December 1, 2017.
- 5.How to Improve Opioid Substitution Therapy Implementation. Geneva, Switzerland: World Health Organization; 2014. [Google Scholar]
- 6.Rudd RA, Seth P, David F, Scholl L. Increases in drug and opioid-involved overdose deaths—United States, 2010–2015. MMWR Morb Mortal Wkly Rep. 2016;65(5051):1445–1452. doi: 10.15585/mmwr.mm655051e1. [DOI] [PubMed] [Google Scholar]
- 7.Burns RM, Pacula RL, Bauhoff S et al. Policies related to opioid agonist therapy for opioid use disorders: the evolution of state policies from 2004 to 2013. Subst Abus. 2016;37(1):63–69. doi: 10.1080/08897077.2015.1080208. [DOI] [PMC free article] [PubMed] [Google Scholar]
- 8. Zur J, Musumeci M, Garfield R. Medicaid’s role in financing behavioral health services for low-income individuals. Menlo Park, CA: Kaiser Family Foundation; 2017.
- 9. Mann C. Essential health benefits in the Medicaid program. Baltimore, MD: Department of Health and Human Services; 2012.
- 10. Clemans-Cope L, Epstein M, Kenney G. Medicaid coverage of effective treatment for opioid use disorder trends in state buprenorphine prescriptions and spending since 2011. Washington, DC: Urban Institute; 2017.
- 11.Wen H, Schackman BR, Aden B, Bao Y. States with prescription drug monitoring mandates saw a reduction in opioids prescribed to Medicaid enrollees. Health Aff (Millwood) 2017;36(4):733–741. doi: 10.1377/hlthaff.2016.1141. [DOI] [PMC free article] [PubMed] [Google Scholar]
- 12. Centers for Disease Control and Prevention. Overdose deaths involving prescription opioids among Medicaid enrollees, 2004–2007. Washington, DC: Department of Health and Human Services; 2009.
- 13. Baker-White A. A look at state legislation limiting opioid prescriptions. Arlington, VA: Association of State and Territorial Health Officials; 2017.
- 14. Dube N. Connecticut’s opioid drug abuse law. Hartford, CT: Connecticut Office of Legislative Research; 2016.
- 15.Vestal C. Maryland moves to limit opioid painkillers. The Pew Charitable Trusts. 2017. Available at: http://www.pewtrusts.org/en/research-and-analysis/blogs/stateline/2017/01/25/maryland-moves-to-limit-opioid-painkillers. Accessed December 1, 2017.
- 16.Opioid prior authorization requirements. Medstar Family Choice. 2017. Available at: http://www.medstarfamilychoice.com/maryland-healthchoice/for-maryland-healthchoice-physicians/pharmacy/opioid/#q={}. Accessed December 1, 2017.
- 17. Senate Bill No.: 226, General Assembly of the State of Indiana, 120 Sess (2017).
- 18. Use of opioid recovery medications: recent evidence on state level buprenorphine use and payment types. IMS Institute for Healthcare Informatics. 2016. Available at: https://www.iqvia.com/-/media/iqvia/pdfs/institute-reports/use-of-opioid-recovery-medications.pdf?la=en&hash=A0AEB9DE498D46FED720F37C41515330504F4DC3. Accessed December 1, 2017.
- 19.Goodman-Bacon A, Sandoe E. Did Medicaid expansion cause the opioid epidemic? There’s little evidence that it did. Health Affairs Blog. 2017. Available at: https://www.healthaffairs.org/action/showDoPubSecure?doi=10.1377%2Fhblog20170823.061640&format=full&. Accessed December 1, 2017.
- 20.State drug utilization data. Centers for Medicare and Medicaid Services. Available at: https://www.medicaid.gov/medicaid/prescription-drugs/state-drug-utilization-data/index.html. Accessed August 8, 2017.
- 21. National Drug Code Directory. US Food and Drug Administration. 2017. Available at: https://www.fda.gov/Drugs/InformationOnDrugs/ucm142438.htm. Accessed August 8, 2017.
- 22.Analyzing prescription data and morphine milligram equivalents. Centers for Disease Control and Prevention. 2017. Available at: https://www.cdc.gov/drugoverdose/media/index.html. Accessed August 8, 2017.
- 23.Medicaid Enrollment Report Centers for Medicare & Medicaid Services. Centers for Medicare & Medicaid Services. 2015. Available at: https://www.medicaid.gov/medicaid/managed-care/enrollment/index.html. Accessed August 8, 2017.
- 24.Medicaid enrollment data collected through MBES. Centers for Medicare and Medicaid Services. 2016. Available at: https://www.medicaid.gov/medicaid/program-information/medicaid-and-chip-enrollment-data/enrollment-mbes/index.html. Accessed August 8, 2017.
- 25.Advancing access to addiction medications. implications for opioid addiction treatment. American Society of Addiction Medicine. 2013. Available at: https://www.asam.org/docs/default-source/advocacy/aaam_implications-for-opioid-addiction-treatment_final. Accessed August 8, 2017.
- 26.Status of state action on the Medicaid expansion decision. The Kaiser Family Foundation. 2017. Available at: http://www.kff.org/health-reform/state-indicator/state-activity-around-expanding-medicaid-under-the-affordable-care-act/?currentTimeframe=0&sortModel=%7B%22colId%22:%22Location%22,%22sort%22:%22asc%22%7D. Accessed August 8, 2017.
- 27.Guy GP, Jr, Zhang K, Bohm M et al. Vital signs: changes in opioid prescribing in the United States, 2006–2015. MMWR Morb Mortal Wkly Rep. 2017;66(26):697–704. doi: 10.15585/mmwr.mm6626a4. [DOI] [PMC free article] [PubMed] [Google Scholar]
- 28.Medicaid enrollees by enrollment group. The Kaiser Family Foundation. 2014. Available at: http://www.kff.org/medicaid/state-indicator/distribution-of-medicaid-enrollees-by-enrollment-group/?dataView=1¤tTimeframe=0&sortModel=%7B%22colId%22:%22Location%22,%22sort%22:%22asc%22%7D. Accessed August 8, 2017.