Abstract
GPCRs have diverse signaling capabilities, based on their ability to assume various conformations. Moreover, it is now appreciated that certain ligands can promote distinct receptor conformations and thereby bias signaling toward a specific pathway to differentially affect cell function. The recently deorphanized G protein-coupled receptor OGR1 [ovarian cancer G protein-coupled receptor 1 (GPR68)] exhibits diverse signaling events when stimulated by reductions in extracellular pH. We recently demonstrated airway smooth muscle cells transduce multiple signaling events, reflecting a diverse capacity to couple to multiple G proteins. Moreover, we recently discovered that the benzodiazepine lorazepam, more commonly recognized as an agonist of the γ-aminobutyric acid A (GABAA) receptor, can function as an allosteric modulator of OGR1 and, similarly, can promote multiple signaling events. In this study, we demonstrated that different benzodiazepines exhibit a range of biases for OGR1, with sulazepam selectively activating the canonical Gs of the G protein signaling pathway, in heterologous expression systems, as well as in several primary cell types. These findings highlight the potential power of biased ligand pharmacology for manipulating receptor signaling qualitatively, to preferentially activate pathways that are therapeutically beneficial.—Pera, T., Deshpande, D. A., Ippolito, M., Wang, B., Gavrila, A., Michael, J. V., Nayak, A. P., Tompkins, E., Farrell, E., Kroeze, W. K., Roth, B. L., Panettieri, R. A. Jr., Benovic, J. L., An, S. S., Dulin, N. O., Penn, R. B. Biased signaling of the proton-sensing receptor OGR1 by benzodiazepines.
Keywords: airway smooth muscle, asthma, biased agonism, GPR68, qualitative signaling
GPCRs have diverse signaling capabilities based on the ability to assume various conformations. Moreover, the ability to promote different receptor confirmations enables ligands to stimulate qualitatively distinct signaling or to bias signaling toward a specific pathway [reviewed in Rajagopal et al. (1)]. These findings have ushered in a new era of pharmacology (2, 3). The promise of biased-ligand pharmacology to enable tuning of GPCRs, instead of simply turning them on or off to various degrees, increases the ways in which a receptor can be exploited to regulate cell, tissue, and integrative in vivo functions. Different signaling events promoted by a GPCR could serve either pathologic or therapeutic functions. Selective activation of a therapeutic signaling event, and avoiding or inhibiting other signaling that promotes pathology, represents an obvious application of biased ligand pharmacology. Such an approach has been proposed for certain receptors/diseases, including the β1 and β2 adrenoceptors and angiotensin II type 1A receptor for heart failure (4), the β2 adrenoceptor for asthma (5), the parathyroid hormone receptor for osteoporosis (6), and the µ-opioid receptor for pain (7).
The challenge of applying therapeutic-biased ligand pharmacology rests on understanding the signaling capabilities of a given GPCR and finding ligands with bias. We and others have characterized the signaling and function of the proton-sensing receptor OGR1 [ovarian cancer G protein-coupled receptor 1 (GPR68)] in response to acute reductions in extracellular pH, in multiple cell types, including bone (8, 9) and smooth muscle (10,–12). We previously revealed the pleiotropic nature of OGR1 signaling in airway smooth muscle (ASM) (11), demonstrating the ability of reduced extracellular pH to elicit classic Gq/Gi- and Gs-dependent signals, with procontractile signaling (typically Gq- but sometimes Gi-dependent in ASM) dominating to cause contraction of ASM cells and airways. Our most recent study (13) discovered that certain benzodiazepines can function as allosteric modulators of OGR1. In this study, using expression systems and several primary cell types, we identify benzodiazepine activators of OGR1 with variable properties, including the ability to bias signaling toward the Gs pathway, thus raising the possibility that OGR1 signaling can be optimized to function therapeutically instead of pathologically.
MATERIALS AND METHODS
Materials
Antibodies against phosphorylated, vasodilator-stimulated phosphoprotein (p-VASP; serine 157) and phospho-ERK1/2 (threonine 202, tyrosine 204) were from Cell Signaling Technology (Danvers, MA, USA). Antibody against β-actin (A5441) was from MilliporeSigma (Billerica, MA, USA). Fr122047 IRDye 680 or 800 secondary antibodies were from Rockland Immunochemicals (Limerick, PA, USA). Lorazepam was purchased from MilliporeSigma. Sulazepam was purchased from Specs (Zoetermeer, The Netherlands). The benzodiazepines clobazam, diazepam, and desmethyldiazepam were obtained from MilliporeSigma or Bio-Techne (Minneapolis, MN, USA) as described in Saxena et al. (11). YM-254890 was obtained from Focus Biomolecules (Plymouth Meeting, PA, USA). All other materials were obtained from MilliporeSigma or from previously identified sources (11, 14, 15).
Yeast screen
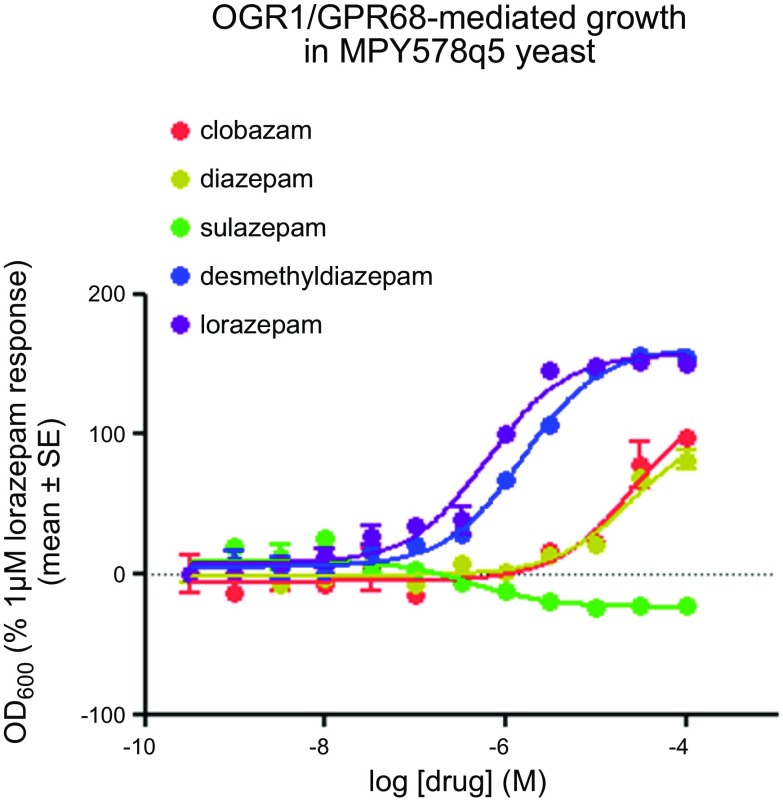
The generation of the yeast MPY578q5 line, expressing OGR1/GPR68, and use as a screening assay was described previously in Huang et al. (13). Briefly, human OGR1/GPR68 was cloned into the multiple cloning site of the yeast high copy number plasmid p426GPD (16). The yeast strain MPY578q5 [Gq yeast; provided by M. Pausch (Merck, Darmstadt, Germany)], expressing a chimeric G protein, in which the last 5 aa of the yeast Gα protein are replaced with the mammalian Gq homologs (17), was transformed and selected to maintain expression of OGR1 by culture in synthetic-defined (SD) medium lacking uracil (Clontech Laboratories, Mountain View, CA, USA). The yeast-screening assays were performed as described previously (18). Assays were set up in 96-well, flat-bottom, clear assay plates that contained 50 μl of test compound at 40 μM (final concentrations ranging from 0 to 10 μM, in triplicate), diluted in SD-His-Ura medium (Clontech Laboratories), with 50 μl of 3-amino-1,2,4-triazole at 4 times the concentration diluted in SD-His-Ura medium (pH 5.4), and 100 μl of yeast cell suspension diluted in SD-His-Ura medium to a final A600 nm of 0.02. Growth was at 30°C for 2–3 d. Cell growth was measured by absorbance at 600 nm in a microplate reader (POLARstar Omega, BMG Labtech, Ortenberg, Germany). Data presented in Fig. 1 are expressed as the percentage of the lorazepam response at 1 µM. MPY578q5 not expressing OGR1/GPR68 had no response to the tested benzodiazepines; additional positive and negative control data are reported in the Supplemental Data section in Huang et al. (13).
Figure 1.
Activation of OGR1 by various benzodiazepines, as assessed in a yeast-based screen. Dose-dependent effect of the benzodiazepines lorazepam, DMD, clobazam, diazepam, and sulazepam on yeast growth in the strain MPY578q5 overexpressing OGR1/GPR68. Data are expressed as the percentage of the lorazepam response at 1 µM. OD, optical density.
Cell culture
Human embryonic kidney 293 (HEK293) cells stably expressing hemagglutinin-tagged human OGR1 or (vector control) were generated as discussed in Saxena et al. (11) and maintained in 250 µg/ml G418.
Fibroblast culture
Human lung fibroblast cultures were established from the parenchyma of a lung obtained from a patient with scleroderma undergoing lung transplant as discussed in Sandbo et al. (19), under a protocol approved by the University of Chicago Institutional Review Board. Tissues was minced, washed in PBS, and plated onto 10-cm plates in growth medium containing DMEM, supplemented with 10% fetal bovine serum, 2 mM l-glutamine, 100 U/ml streptomycin, 250 ng/ml amphotericin B, and 100 U/ml penicillin. Expanded cells were subsequently subcultured, resulting in the development of a homogenous fibroblast population. Cells were serum deprived for 24 h in DMEM containing 0.2% fetal bovine serum and 2 mM l-glutamine before stimulation with agonists.
Human ASM cultures
Human ASM cultures were established from human tracheae, as described previously (20). In addition, senescence-resistant ASM cultures stably expressing human telomerase reverse transcriptase (21) were also used. Data from the human telomerase reverse transcriptase and the primary ASM cultures were similar and were, therefore, analyzed collectively. As described previously (22), cells were maintained in medium containing 10% fetal bovine serum, then switched to serum-free medium 24 h before stimulation.
Osteoblast cultures
Experiments employed UMR106-01 cells, a rat osteoblast-like cell line that expresses both parathyroid hormone (PTH) receptor and OGR1 (23). The cells were maintained in DMEM/F-12 medium with 10% fetal bovine serum, 100 units/ml penicillin, and 100 mg/ml streptomycin at 37°C in 5% CO2, and switched to serum-free medium before stimulation with vehicle, indicated benzodiazepines, or PTH.
Cellular cAMP accumulation
HEK293 or human ASM cells were grown to near confluence in 24-well plates and maintained in Ham’s F12 medium (pH 8.0) in a 37°C room-air incubator for 3 h. To stimulate cells, the medium was replaced with Ham’s F12 medium (pH 8.0) containing 1 mM isobutylmethylxanthine, plus different amounts of dilute HCl to achieve medium pH values of 8.0, 7.4, or 6.8, alone or in combination with indicated final concentrations of lorazepam or sulazepam. Vehicle (0.1% DMSO) was maintained constant among wells. cAMP was quantified using Thermo Fisher Scientific cAMP-Screen ELISA, according to the manufacturer’s instructions. For experiments employing the GloSensor cAMP assay (Promega, Madison, WI, USA), HEK 293 cells stably expressing pGloSensor-22F plasmid were generated as described previously (24) and maintained in cell culture medium containing hygromycin B (200 µg/ml). Cells were plated on poly-l-lysine–coated, white plates and allowed to attach overnight. The following day, the cells were maintained in Ham’s F12 medium (pH 8.0) in a 37°C room-air incubator for 3 h and subsequently loaded with d-luciferin potassium salt (500 µM) (VWR International, Radnor, PA, USA) for 30 min. After determining the basal luminescence for all wells, the cells were stimulated with dilute HCl and/or lorazepam, sulazepam, isoproterenol, or forskolin, and luminescence was determined every 2 min for a period of 22 min using a Synergy 2 plate reader (BioTek Instruments, Winooski, VT, USA).
Protein analysis using the ProteinSimple Wes
Cells were grown to near confluence in 12-well plates and growth-arrested as described above. Cells were then refed Ham’s F12 medium (pH 8.0) and placed in a 37°C, room air incubator for 3 h. Cells were stimulated as above with dilute HCl to achieve extracellular medium pH as described previously (11) plus indicated concentrations of lorazepam or sulazepam for 5 min. Cells were then washed with ice-cold PBS and then solubilized in radioimmunoprecipitation assay buffer [25 mM Tris HCl (pH 7.6), 150 mM NaCl, 1% NP-40, 1% sodium deoxycholate, 0.1% SDS] with protease and phosphatase inhibitor cocktail (BioTools, Jupiter, FL, USA). For analysis of protein expression, the ProteinSimple Wes (ProteinSimple, San Jose, CA, USA) system was used. Wes is a Western blotting alternative based on capillary electrophoresis immunoassay principle. The processes of protein fractionation, immobilization, and immunodetection are fully automated. The procedure was performed according to manufacturer’s protocol. Briefly, cell lysates were mixed 4:1 (vol/vol) with a master mix (final concentration of 40 mM dithiothreitol) and then heated at 95°C for 5 min. The samples, antibody diluent, primary antibodies, secondary antibodies, chemiluminescent substrate, and wash buffer were added to designated wells in the manufacturer-provided microplate. After plate loading, the separation electrophoresis and immunodetection were performed using instrument default settings. Data were analyzed using the manufacturer-provided Compass software. Peak area of the target-protein chemiluminescence signal was calculated and normalized to the β-actin peak-area signal in the same sample. MWs of the proteins were calculated from the 3 MW markers added to each sample (as a component of the master mix), which were compared with a standard curve; 6 biotinylated proteins, ranging from 12 to 230 kDa, which were separated in a separate capillary and detected using streptavidin conjugated–horseradish peroxidase. Representative data are presented as an electropherogram of the chemiluminescence signal in the capillary.
Intracellular calcium measurements
Cells were plated onto collagen-coated, 96-well plates, grown to confluence, and loaded with 2 µM Fluo-4 acetoxymethyl (AM; BD Biosciences, Franklin Lakes, NJ, USA) and probenecid for 1 h in buffer (pH 8.0). Indicated final concentrations of agonists were added by an automated pipetting system in duplicate, and the 525 nm signals were generated by excitation at 485 nm with a Flex Station II (Molecular Devices, Sunnyvale, CA, USA), as discussed in Deshpande et al. (25). The net peak Ca2+ response was calculated as [(Agonist-induced fluorescence units) − (Basal fluorescence units)]. Maximal Ca2+ response was determined by stimulating the cells with ionomycin (1 µM). As an alternative approach that also enabled analysis of the effects of benzodiazepines at various buffer pH values (acute changes in pH can result in artifactual signals in the Flexstation system), ASM cells grown on glass coverslips (Delta T dishes; Bioptechs, Butler, PA, USA) were washed and loaded with 5 μM Fura-2 AM in HBSS (adjusted to pH 8.0) for 30 min at 37°C. The cells were then washed and maintained in the same HBSS (pH 8.0) (lacking Fura-2). Acute changes in buffer pH or lorazepam/sulazepam concentration were introduced by superfusion of buffer/drug, as per Saxena et al. (11). Calcium imaging was performed using a fluorescent imaging system (Metafluor; Nikon, Minato, Tokyo, Japan) as described previously (26). The net calcium response was calculated by subtracting the basal from peak intracellular Ca2+ ([Ca2+]i) upon agonist stimulation.
cAMP response element–luciferase assay
UMR106-01 cells (American Type Culture Collection, Manassas, VA, USA) were transfected with lentiviral particles of cAMP response element (CRE) reporter (Qiagen, Hilden, Germany) (27). After 72-h transfection, cells were selected with puromycin to obtain the stable cell line of UMR-106–CRE-luciferase (Luc). These cells were then treated with lorazepam, sulazepam, PTH, or vehicle for 6 h. The Luc activity was detected as described previously (28).
Quantitative PCR
Given the lack of useful antibodies for detecting OGR1 protein expression in cells, small interfering RNA (siRNA)-mediated knockdown was assessed using quantitative PCR as per Saxena et al. (11). Total RNA was isolated by standard procedures using Trizol (Thermo Fisher Scientific), converted to cDNA, and OGR1 mRNA abundance was assessed by quantitative PCR as described previously (11).
siRNA-mediated knockdown of OGR1
siRNA-mediated knockdown of OGR1 was accomplished as described previously (11) using siRNA duplexes for OGR1 (ON-TARGETplus SMARTpool L-005591-00; Thermo Fisher Scientific) or for a scrambled (control) sequence (5′-GCG CGC UUU GUA GGA UUC GdTdT-3′) and Dharmafect transfection reagent (Thermo Fisher Scientific), per manufacturer’s instructions; 24 h later, cells were passaged for terminal experiments as described above.
Magnetic twisting cytometry
Dynamic changes in cell stiffness were measured as an indicator of contraction of isolated ASM cells cultured in serum-free medium (pH 7.4) using the magnetic twisting cytometry (MTC) technique, as described previously (25, 29). Briefly, Arg-Gly-Asp (arginylglycylaspartic acid)–coated ferrimagnetic microbeads, bound to adherent cells, were magnetized horizontally and then twisted in a vertically aligned, homogenous magnetic field that was varying sinusoidally in time. That sinusoidal-twisting magnetic field causes both a rotation and a pivoting displacement of the bead; such forced bead motions are, in turn, impeded by internal stresses, developed by the cell (30). Lateral bead displacements in response to the resulting oscillatory torque were detected with a spatial resolution of ∼5 nm, and the ratio of specific torque to bead displacements was computed as the cell stiffness in Pascal units per nanometer and expressed as ratio of induced stiffness to baseline stiffness or the percentage of relaxation from precontracted cell stiffness. For each individual ASM cell, baseline stiffness was measured for the first 60 s, and changes in cell stiffness in response to the indicated agent were measured continuously for the next 240 s.
Statistical analysis
Data are presented as means ± sem values. Experiments employing human ASM cells were repeated with cultures from different donors to create the indicated n values. Statistically significant differences among vehicle/benzodiazepine treatment groups were assessed by ANOVA, and Bonferroni post hoc analysis was applied in studies of OGR1 knockdown effect, with values of P < 0.05 sufficient to reject the null hypothesis using Prism software (GraphPad Software, La Jolla, CA, USA).
RESULTS
Discovery of putative OGR1 ligands/modulators
Using a modified yeast screen (employing the yeast MPY578q5 line expressing OGR1/GPR68), we recently identified several N-unsubstituted benzodiazepines as allosteric modulators of the proton-sensing GPCR OGR1/GPR68 (13). Among those benzodiazepines tested, variable ability to regulate OGR1-dependent growth was observed (Fig. 1). Lorazepam was among the most efficacious in promoting OGR1-dependent growth; desmethyldiazepine (DMD) had a modest effect and only at high concentrations and clobazam and diazepam were without effect, whereas 1 benzodiazepine (sulazepam) inhibited growth of yeast expressing OGR1.
Benzodiazepines induce intracellular signaling by OGR1 when heterologously expressed in HEK293 cells
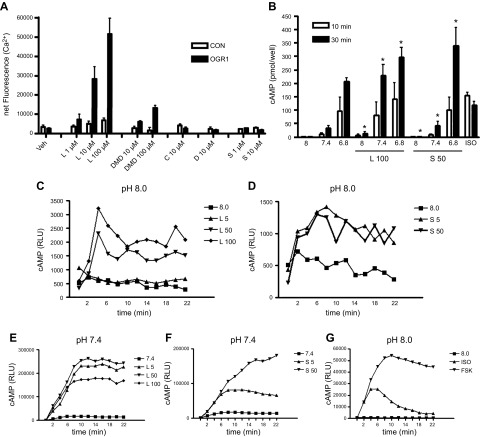
To explore the relationship between the ability of certain benzodiazepines to regulate yeast growth and to transduce OGR1-dependent signaling, we generated HEK293 cells overexpressing hemagglutinin-tagged human OGR1 receptor and a (vector-transfected) control line. In a Flexstation analysis, lorazepam stimulated intracellular calcium mobilization in a dose-dependent (1–100 µM) manner, as did DMD at 10 and 100 µM concentrations. Clobazam (C), diazepam (D), and sulazepam (S) failed to induce Ca2+ mobilization when tested at concentrations up to 100 µM (Fig. 2A and data not shown). None of the benzodiazepines tested stimulated calcium mobilization in control [plasmid cytomegalovirus (pc)DNA transfected] cells.
Figure 2.
Calcium mobilization and cAMP generation by benzodiazepine stimulation of heterologously expressed OGR1. Stable lines of HEK293 were selected after transfection of vector (CON) or OGR1, as described in the Materials and Methods. A) Cells were plated into 96-well plates for analysis of agonist-stimulated calcium mobilization using Flexstation as described in Saxena et al. (11). Cells were stimulated with indicated concentrations of lorazepam (L), DMD, clobazam (C), diazepam (D), or sulazepam (S). In additional experiments using OGR1-expressing HEK293 lines, 50 µM sulazepam failed to stimulate calcium mobilization beyond that stimulated with vehicle (data not shown). B) Cells were plated in 24-well plates in medium adjusted to the indicated pH and stimulated with the indicated agents for 10 or 30 min in the presence of 100 µM isobutylmethylxanthine, and cAMP quantified as described in the Materials and Methods. No cAMP accumulation was observed in (vector) control cells. C–F) HEK293–OGR1 cells expressing GloSensor were stimulated to produce the indicated pH and lorazepam or sulazepam concentrations, and induced relative luminescence units (RLU) were measured in real time as an indication of intracellular cAMP levels. G) ISO (1 µM) and forskolin (FSK; 100 µM) served as positive controls. Data represent means + sem values from 3–5 experiments in A and B. For GloSensor, representative curves from 4–5 experiments are shown. For calcium mobilization, a statistically significant (*P < 0.05, ANOVA) treatment effect for lorazepam and desmethyldiazepam was observed. For cAMP, a statistically significant treatment effect for lorazepam and sulazepam was observed.
Both lorazepam (5–100 µM) and sulazepam (5–50 µM; 50 µM representing the limit of solubility for this drug in the buffers and culture media employed) induced cAMP accumulation in OGR1-expressing HEK293 cells (but not in pcDNA-transfected cells) as assessed by cAMP immunoassay (Fig. 2B) and in cells expressing cAMP GloSensor (Fig. 2C–F). Both agents induced a modest increase of cAMP production at pH 8.0 but showed cooperativity with pH (7.4)-induced cAMP production. Pretreatment with indomethacin had no effect on induced cAMP accumulation (data not shown).
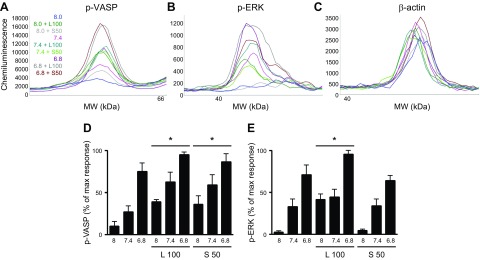
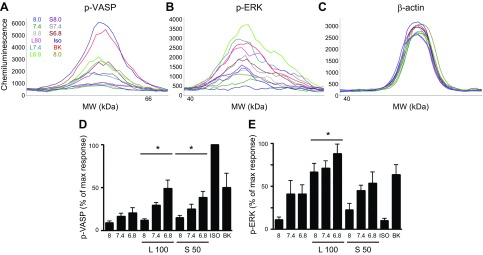
Additional OGR1-mediated signaling, known to be activated by reduced extracellular pH and suggestive of canonical Gq/Gi- or Gs-dependent signals, include phosphorylation of ERK1/2 and of the PKA substrate VASP, respectively. Lorazepam increased levels of both phospho-ERK1/2 and phospho-VASP (as assessed by ProteinSimple Wes analysis; see the section Protein analysis using the ProteinSimple Wes). Sulazepam increased levels of phospho-VASP (beyond that stimulated by decreased pH) but failed to increase levels of phospho-ERK1/2 (Fig. 3).
Figure 3.
Induction of VASP or ERK phosphorylation by lorazepam and sulazepam in OGR1-expressing HEK293 cells. A–C) Representative electropherograms for p-VASP, p-ERK, and β-actin generated by capillary electrophoresis using ProteinSimple Wes. D, E) Data represent means ± sem values from 4 experiments. For p-VASP, a statistically significant (P < 0.05, ANOVA) treatment effect for lorazepam (L) and sulazepam (S) was observed. For p-ERK, a statistically significant treatment effect for lorazepam was observed. *P < 0.05 by 2-way ANOVA.
Benzodiazepines induce similar, qualitative signaling via endogenously expressed OGR1 in primary/differentiated cells
Having established the ability of different benzodiazepines to induce qualitative signaling in the highly controlled HEK293 expression system, we turned our attention to benzodiazepine effects in primary cells expressing endogenous OGR1.
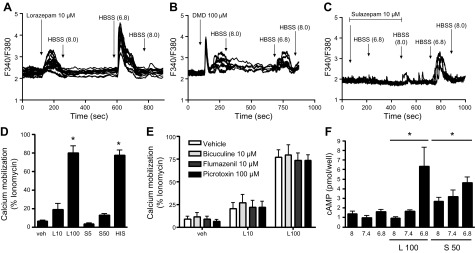
We previously demonstrated that acute reductions in extracellular pH induce multiple, OGR1-mediated intracellular signals in human ASM cells (11). In imaging-based analysis of intracellular calcium mobilization in human ASM cells, as discussed in Saxena et al. (11), both lorazepam (Fig. 4A) and desmethyldiazepam (Fig. 4B) could again stimulate Ca2+ mobilization. Sulazepam (10 µM) did not stimulate Ca2+ mobilization but, instead, inhibited Ca2+ mobilization stimulated by a reduction in buffer pH (Fig. 4C). Flexstation analysis similarly demonstrated a strong induction of Ca2+ mobilization by lorazepam, with no effect of sulazepam (Fig. 4D).
Figure 4.
Lorazepam and sulazepam promote qualitative signaling in primary/differentiated cells. A–D). Calcium mobilization in human ASM cells stimulated with different benzodiazepines. A–C) Calcium traces from FURA-2–loaded ASM cells plated on coverslips: buffer pH was adjusted as indicated and delivered by superfusion to the chamber. Arrows indicate either a change in the pH of the buffer superfused or the addition of the indicated agent: lorazepam (L) (A); desmethyldiazepam (DMD) (B); and sulazepam (S) (C) into the superfused buffer. D) Calcium mobilization in human ASM cells (Flexstation analysis). E) Calcium mobilization by lorazepam in the presence of GABAA antagonists (Flexstation analysis). F) cAMP accumulation by lorazepam and sulazepam in ASM cells. Data represent means ± sem values from 5–6 experiments. For Flexstation analysis in D, *P < 0.05 by 1-way ANOVA.
Because benzodiazepines are established activators of GABAA channels, we assessed the ability of known GABAA antagonists to inhibit benzodiazepine-stimulated Ca2+ mobilization in ASM cells (Fig. 4E). Neither bicuculline, which binds the orthosteric ligand site in GABAA, nor flumazenil, which binds the (distinct) benzodiazepine binding site of GABAA, affected Ca2+ mobilization induced by lorazepam. Picrotoxin, a noncompetitive channel blocker for GABAA chloride channels, was also without effect.
With respect to cAMP accumulation, cooperativity between (decreased) medium pH and lorazepam/sulazepam was observed (Fig. 4F), similar to that which occurred in HEK293 cells expressing recombinant OGR1 (Fig. 2A). At pH 8.0, only sulazepam significantly increased cAMP accumulation, with levels slightly higher at pH 7.4. The highest levels of cAMP accumulation occurred with sulazepam and lorazepam stimulation at pH 6.8. Pretreatment of cells with indomethacin had no effect on cAMP accumulation (data not shown).
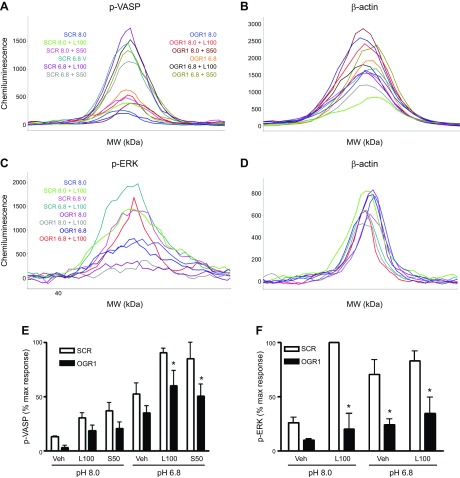
Lorazepam was shown to induce acute phosphorylation of ERK1/2 and modestly induced phosphorylation of VASP, with both inductions being cooperative with reduced extracellular pH (Fig. 5). Alternatively, sulazepam failed to stimulate ERK1/2 phosphorylation, yet induced phospho-VASP levels, again showing cooperativity with a reduced extracellular pH.
Figure 5.
Lorazepam- and sulazepam-induced VASP and ERK1/2 phosphorylation in human ASM cells. A–C) Representative electropherograms for p-VASP, p-ERK, and β-actin generated by capillary electrophoresis using ProteinSimple Wes. D, E) Data represent means + sem values from 8 experiments. For p-VASP, a statistically significant (P < 0.05, ANOVA) treatment effect for lorazepam and sulazepam was observed. For p-ERK, a statistically significant (*P < 0.05, ANOVA) treatment effect for lorazepam was observed.
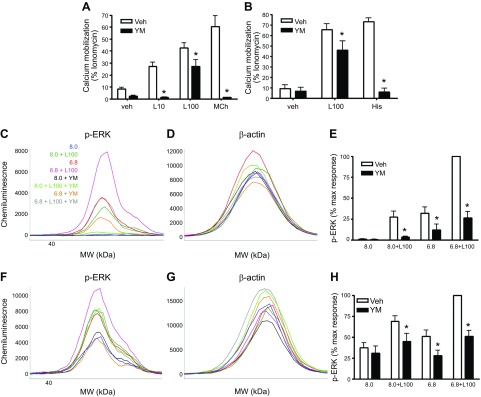
To gain insight into the G proteins mediating the calcium and phospho-ERK signals induced by lorazepam, we pretreated HEK293–OGR1 cells with the Gq inhibitor YM-254890 (1 µM; 15 min preincubation). Pretreatment with YM-254890 resulted in full inhibition of calcium mobilization induced by 10 µM lorazepam (Fig. 6A). Calcium mobilization induced by 100 µM lorazepam was significantly, but not fully, inhibited in both HEK293–OGR1 and human ASM cells (Fig. 6A, B). Calcium mobilization induced by methacholine and histamine (1 µM for both in HEK293 and ASM cells) was fully inhibited by YM-254890. Phosphorylation of ERK, induced by pH 6.8 and by 100 µM lorazepam, was, however, strongly inhibited by YM-254890 in both HEK293 and ASM cells (Fig. 6C–H).
Figure 6.
Effects of the Gq inhibitor YM-254890 on pH and lorazepam-induced signaling. A, B) Lorazepam-induced calcium mobilization in the presence or absence of YM-254890 (1 µM) in HEK293–OGR1 and human ASM cells. C–H) Effect of YM-254890 on pH 6.8 and/or lorazepam (100 µM)-induced ERK phosphorylation (ProteinSimple Wes) in HEK293–OGR1 (C–E) and human ASM cells. Data represent means ± sem values from 3 experiments. *P < 0.05, ANOVA.
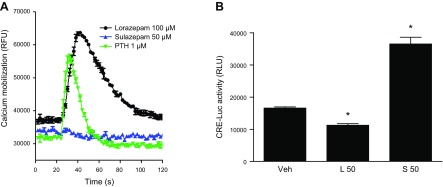
The rat osteoblast cell line UMR106 enabled an additional, albeit limited, analysis of endogenous OGR1 signaling by benzodiazepines. Lorazepam, but not sulazepam, promoted calcium mobilization, which was actually greater and more sustained than that stimulated by (positive control) PTH (Fig. 7A). Alternatively, sulazepam significantly increased CRE-Luc activity in UMR cells stably expressing this reporter, whereas lorazepam was without effect (Fig. 7B).
Figure 7.
Benzodiazepine signaling in osteoblasts. A) Calcium mobilization in UMR106-01 cells. Traces are the averages of 3 measurements. B) CRE-Luc luminescence induced by lorazepam and sulazepam (means ± sem values from 3 experiments). RLU, relative luminescence units. CRE-Luc luminescence is indicative of increased cAMP signaling. For CRE-Luc activity, a statistically significant treatment effect for sulazepam was observed. *P < 0.05, ANOVA.
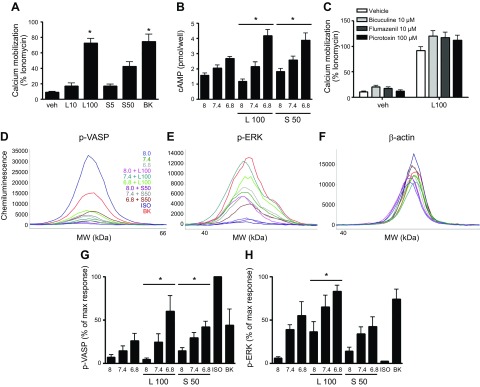
In human lung fibroblasts (HLFs), OGR1 expression was suggested by quantitative PCR analysis (cycle threshold values of 18.1 ± 0.2 for glyceraldehyde-3-phosphate dehydrogenase and 26.9 ± 0.3 for OGR1; n = 3). Lorazepam induced calcium mobilization in HLFs (Fig. 8A) comparable to that stimulated by bradykinin. Unlike the effects observed in HEK293 and human ASM cells, sulazepam did exhibit the ability to induce calcium mobilization, albeit significantly less than the lorazepam-induced response. The benzodiazepine-induced calcium mobilization was not inhibited by the GABAA inhibitors bicuculline, flumazenil, or picrotoxin (data not shown). Both lorazepam and sulazepam induced a modest, but significant, increase in cAMP levels stimulated by pH 6.8. (Fig. 8B). Lorazepam strongly induced p-ERK beyond those levels stimulated by reduced extracellular pH, whereas sulazepam did not (Fig. 8D, F, H). With respect to induction of p-VASP, across the range of pH treatments, a group treatment effect of both lorazepam and sulazepam was observed, although only sulazepam, and not lorazepam, increased p-VASP levels at pH 8.0. (Fig. 8C, F, G).
Figure 8.
Lorazepam- and sulazepam-promoted signaling in human lung fibroblasts. A, B) Benzodiazepines induce calcium mobilization (means ± sem; n = 4) and cAMP production (means ± sem; n = 5). C–E) Representative electropherograms for p-VASP, p-ERK, and β-actin generated by capillary electrophoresis using ProteinSimple Wes. G, H) Graphic representation of data, representing means ± sem values from 3–5 experiments; values are percentages of maximal (max) response in each individual experiment. For Flexstation analysis in A, P < 0.05 by 1-way ANOVA. For p-VASP, a statistically significant (*P < 0.05, ANOVA) treatment effect for lorazepam and sulazepam was observed. For p-ERK, a statistically significant (*P < 0.05, ANOVA) treatment effect for lorazepam was observed. BK, bradykinin; L, lorazepam; S, sulazepam.
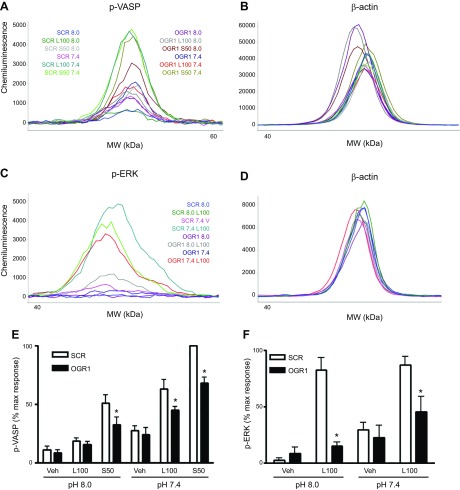
To confirm the role of endogenous OGR1 in lorazepam- and sulazepam-induced signaling, siRNA-mediated knockdown of OGR1 was performed in both ASM and HLF. In human ASM, a 62 ± 4% mean knockdown resulted in a statistically significant inhibition (43 ± 6% decrease, P < 0.05, n = 5) of lorazepam (100 µM)-induced calcium mobilization (Flexstation analysis), without affecting histamine-induced calcium mobilization (6 ± 23% decrease). Induction of p-ERK by lorazepam was reduced to basal levels by OGR1 knockdown (Fig. 9D–F, H). Induction of p-VASP by lorazepam and sulazepam was also inhibited (72 ± 20 and 71 ± 11% inhibition, respectively, at pH 6.8) (Fig. 9A–C, G). In HLF, siRNA-mediated knockdown of OGR1 was more challenging; nevertheless, a 48 ± 4% mean knockdown resulted in a statistically significant inhibition (31 ± 8% decrease, P < 0.05, n = 3) of lorazepam (100 µM)-induced calcium mobilization, without affecting induction by bradykinin (8 ± 10% decrease). Induction of p-ERK by lorazepam was more profoundly inhibited by OGR1 knockdown (88 ± 7% inhibition at pH 8.0 and 68 ± 11% at pH 7.4) (Fig. 10D–F, H). OGR1 knockdown also significantly inhibited both lorazepam- and sulazepam-induced p-VASP levels, under all pH costimulatory conditions (Fig. 10A–C, G).
Figure 9.
OGR1 knockdown attenuates benzodiazepine-induced p-VASP and p-ERK in human ASM. A–D) Representative electropherograms for p-VASP, p-ERK, and β-actin generated by capillary electrophoresis using ProteinSimple Wes, for SCR and OGR1 siRNA-transfected ASM cells. E, F) Graphic representation of data, means ± sem values from 3–5 experiments; values are percentage of the maximal (max) response in each individual experiment. *P < 0.05, SCR vs. OGR1 group comparison. L, lorazepam; S, sulazepam; Veh, vehicle.
Figure 10.
OGR1 knockdown attenuates benzodiazepine-induced p-VASP and p-ERK and calcium mobilization in HLF. A–D) Representative electropherograms for p-VASP, p-ERK, and β-actin, generated by capillary electrophoresis using ProteinSimple Wes, for SCR and OGR1 siRNA transfected HLF cells. E, F) Graphic representation of data, means + sem values from 3–5 experiments; values are the percentage of the maximal (max) response in each individual experiment. *P < 0.05, SCR vs. OGR1 group comparison. L, lorazepam; S, sulazepam; Veh, vehicle.
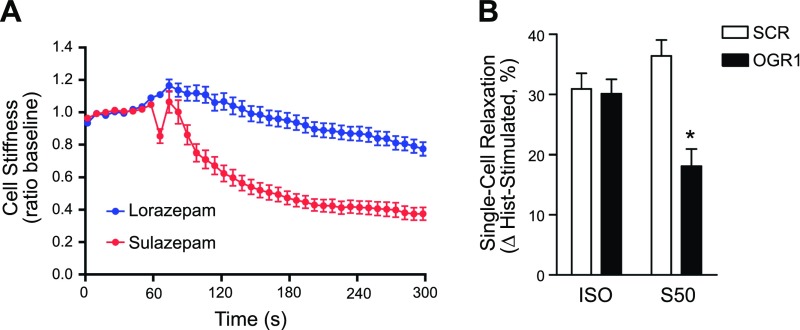
Lastly, to establish a link between bias in OGR1 signaling with cellular function, we assessed the regulation of the ASM contractile state by lorazepam and sulazepam using MTC (11, 25, 29,–31). Lorazepam, with relatively balanced signaling properties in human ASM cells (Figs. 4 and 5), did not significantly alter basal cell stiffness, whereas sulazepam had a profound relaxant effect (Fig. 11A). Contractile-agonist–induced increases in cell stiffness were similarly reduced by sulazepam, but not by lorazepam (data not shown); thus, subsequent studies to establish the OGR1 dependence of the regulation of ASM-contractile state by benzodiazepines focused on sulazepam. Knockdown of OGR1 (63 ± 10%; 5 different primary ASM cultures) resulted in a significant reduction (50%, relative to inhibition observed in control scrambled (SCR) cells; SCR: 36 ± 3; OGR1: 18 ± 3%; P < 0.05) in the ability of sulazepam to reverse histamine-induced ASM stiffness, whereas the relaxant effect of the β-agonist isoproterenol was unaffected (SCR: 31 ± 3%; OGR1: 30 ± 2%) (Fig. 11B).
Figure 11.
Differential regulation of ASM contractile state by benzodiazepines, consistent with OGR1-bias signaling properties. A) Sulazepam (50 µM), but not lorazepam (100 µM), relaxes ASM cells. B) OGR1 knockdown attenuates sulazepam-induced relaxation. Single-cell stiffness (Pa/nm) was determined by MTC. Histamine (Hist)-induced contraction of individual cells (mean ratio of histamine-induced to basal cell stiffness) The SCR, 1.4 (n = 806 cells) and OGR1, 1.3 (n = 670 cells) were reduced by sulazepam [percentage of relaxation: SCR, 36 ± 3 (n = 456 cells); OGR1, 18 ± 3% (n = 611 cells); *P < 0.05] and ISO [percentage of relaxation: SCR, 31 ± 3 (n = 587 cells); OGR1: 30 ± 2% (n = 749 cells)]. Data are means ± se values from individual cells from 5 primary ASM cell lines.
DISCUSSION
In the current study, we demonstrated that multiple benzodiazepines activate the proton-sensing receptor OGR1/GPR68 and exhibit differing ability to promote disparate signaling events that have differing effects on cellular function.
It is now well appreciated that many GPCRs have the capacity to activate multiple signaling pathways, including those mediated through different G proteins, and those that are G protein independent (32,–35). It is presumed that the nature of the signaling transduced depends on the conformation of the receptor that is promoted by the activated agent, a conformation that may be further influenced by other factors. Thus, the capacity to identify/develop agents with the ability to bias receptor signaling toward a specific pathway, suggests that receptors can be targeted in novel ways to increase their therapeutic utility.
OGR1 represents one such receptor. Our initial study in human ASM cells demonstrated the capacity of OGR1 to generate signals associated with canonical Gq/Gi and Gs heterotrimeric protein signaling, when cells were subject to modest acute changes in extracellular pH (11). In the present study, we characterized the OGR1-depedendent signaling of several benzodiazepines previously identified as interacting with OGR1 in a yeast-based screen. We found lorazepam capable of activating both Gq and Gs pathways; when tested at basic conditions (medium pH 8.0), lorazepam-induced signaling appeared biased toward Gq, and possibly Gi, as evidenced by robust calcium mobilization and ERK phosphorylation but only a modest increase in intracellular cAMP levels. However, at lower pH levels, Gs signaling by lorazepam was greatly increased, such that signaling is more balanced. These results were evidenced in both HEK293 cells, in which OGR1 is heterologously expressed, and in primary ASM and fibroblast cultures.
Somewhat surprisingly, we found that although the lorazepam-mediated phosphorylation of ERK in HEK293-OGR1 and ASM cells appears totally dependent on Gq, based on inhibitor studies, the OGR1-dependent calcium mobilization was only partially (albeit significantly) inhibited by pharmacologic Gq inhibition. These findings suggest that lorazepam can promote additional signaling (most likely via Gi coupling) along with allosteric modulation of Gq and Gs signaling. Future studies will explore the nature of this signaling and the structural features of OGR1 that enable that bias.
Alternatively, sulazepam fails to stimulate any Gq/Gi-mediated signals in HEK293 cells expressing OGR1, yet stimulates cAMP accumulation and cAMP/PKA-dependent signals, also in a cooperative manner, with reduced pH. Thus, sulazepam exhibits properties of a Gs-biased OGR1 activator. In primary cells types, sulazepam retains its properties as a biased OGR1 activator preferentially activating Gs/PKA signaling, although a variable capacity to activate canonical Gq/Gi signaling may occur in certain cell types.
Previous studies (36) note the ability of G protein α subunits to be modified by pH with an accompanying change in activity. Although that effect could potentially contribute to the cooperativity of (reduced) pH and lorazepam/sulazepam in HEK293 cells, ASM cells, and fibroblasts, reducing extracellular pH failed to increase either isoprenaline (ISO)- or forskolin-stimulated cAMP accumulation, suggesting modification of Gs does not contribute to the observed cooperativity.
The extent to which these bias properties of benzodiazepines can differentially regulate cell, tissue, and organ system functions via OGR1 and be exploited therapeutically remains to be established. Study of OGR1 (as well as GPR4, TDAG8, and G2A) has been confounded to date by the inherent complexity of a receptor whose presumed agonist is a proton. OGR1 has been shown to be expressed in multiple cell types, including vascular and ASM, osteoblasts, myofibroblasts, and undetermined cell types in the cerebellum and hippocampus (13). Gq and Gs signaling tends to regulate specific cellular functions in those cells differently. For example, in smooth muscle, Gq [and for certain select GPCRs, Gi (15, 37)], signaling promotes contraction and growth, whereas Gs signaling antagonizes both functions (28, 31, 38). Consistent with this regulatory paradigm and the differential capacity of certain benzodiazepines to bias OGR1 signaling in ASM (Figs. 4 and 5), we found the Gs-biased agent sulazepam promoted ASM relaxation, whereas the relatively balanced lorazepam did not (Fig. 11). In osteoblasts, Gq signaling promotes bone resorption, whereas Gs signaling is believed to promote bone formation (39). In fibroblasts, Gs/PKA signaling inhibits fibroblast differentiation into myofibroblasts and the associated increase in collagen deposition (19). Thus, in multiple cell types, Gs signaling tends to be therapeutic, whereas Gq or Gi signaling tends to promote disease progression or functions, and tuning a receptor to selectively activate the therapeutic signaling arm is conceptually attractive. Whether sulazepam or a similar Gs-biased, OGR1-activating benzodiazepine can be formulated and delivered to various organ systems in a manner that addresses current regulatory hurdles for various diseases is unknown. Obvious questions relate to whether (therapeutic) signaling potency and efficacy are sufficient, pharmacokinetic/pharmacodynamic/toxicity issues, and side effects (including those related to GABA receptor activation). However, the clear capability to bias OGR1 signaling, combined with current medicinal chemistry capabilities, suggests that biased agonism pharmacology with respect to OGR1 holds great therapeutic potential.
ACKNOWLEDGMENTS
This work was funded by the U.S. National Institutes of Health (NIH), National Heart, Lung, and Blood Institute (Grant P01 HL114471 to R.B.P., R.A.P., J.L.B., and S.S.A.; and Grant HL087560 to D.A.D.) The content is solely the responsibility of the authors and does not necessarily represent the official views of the NIH. The authors declare no conflicts of interest.
Glossary
- AM
acetoxymethyl
- ASM
airway smooth muscle
- CRE
cAMP response element
- DMD
desmethyl–diazepam
- GABA
γ-aminobutyric acid
- HEK
human embryonic kidney
- HLF
human lung fibroblasts
- ISO
isoprenaline
- Luc
luciferase
- MTC
magnetic twisting cytometry
- OGR1
ovarian cancer G protein-coupled receptor 1
- PTH
parathyroid hormone
- p-VASP
phosphorylated vasodilator-stimulated phosphoprotein; SCR, scrambled
- SD
synthetic-defined
- siRNA
small interfering RNA
AUTHOR CONTRIBUTIONS
T. Pera, D. A. Deshpande, and R. B. Penn designed the studies, performed the experiments, analyzed and interpreted the data, and wrote the manuscript; M. Ippolito, B. Wang, A. Gavrila, J. V. Michael, A. P. Nayak, E. Tompkins, E. Farrell, and S. S. An performed experiments and analyzed data; W. K. Kroeze and N. O. Dulin performed experiments, analyzed and interpreted data, and revised the manuscript; B. L. Roth, R. A. Panettieri Jr., J. L. Benovic, and S. S. An helped design the experiments, interpreted the data, and revised the manuscript for important intellectual content.
REFERENCES
- 1.Rajagopal S., Rajagopal K., Lefkowitz R. J. (2010) Teaching old receptors new tricks: biasing seven-transmembrane receptors. Nat. Rev. Drug Discov. 9, 373–386 [DOI] [PMC free article] [PubMed] [Google Scholar]
- 2.Luttrell L. M., Maudsley S., Bohn L. M. (2015) Fulfilling the promise of “biased” G protein-coupled receptor agonism. Mol. Pharmacol. 88, 579–588 [DOI] [PMC free article] [PubMed] [Google Scholar]
- 3.Wisler J. W., Xiao K., Thomsen A. R., Lefkowitz R. J. (2014) Recent developments in biased agonism. Curr. Opin. Cell Biol. 27, 18–24 [DOI] [PMC free article] [PubMed] [Google Scholar]
- 4.Patel C. B., Noor N., Rockman H. A. (2010) Functional selectivity in adrenergic and angiotensin signaling systems. Mol. Pharmacol. 78, 983–992 [DOI] [PMC free article] [PubMed] [Google Scholar]
- 5.Walker J. K., Penn R. B., Hanania N. A., Dickey B. F., Bond R. A. (2011) New perspectives regarding β(2) -adrenoceptor ligands in the treatment of asthma. Br. J. Pharmacol. 163, 18–28 [DOI] [PMC free article] [PubMed] [Google Scholar]
- 6.Gesty-Palmer D., Chen M., Reiter E., Ahn S., Nelson C. D., Wang S., Eckhardt A. E., Cowan C. L., Spurney R. F., Luttrell L. M., Lefkowitz R. J. (2006) Distinct β-arrestin- and G protein-dependent pathways for parathyroid hormone receptor-stimulated ERK1/2 activation. J. Biol. Chem. 281, 10856–10864 [DOI] [PubMed] [Google Scholar]
- 7.Soergel D. G., Subach R. A., Burnham N., Lark M. W., James I. E., Sadler B. M., Skobieranda F., Violin J. D., Webster L. R. (2014) Biased agonism of the μ-opioid receptor by TRV130 increases analgesia and reduces on-target adverse effects versus morphine: a randomized, double-blind, placebo-controlled, crossover study in healthy volunteers. Pain 155, 1829–1835 [DOI] [PubMed] [Google Scholar]
- 8.Pereverzev A., Komarova S. V., Korcok J., Armstrong S., Tremblay G. B., Dixon S. J., Sims S. M. (2008) Extracellular acidification enhances osteoclast survival through an NFAT-independent, protein kinase C-dependent pathway. Bone 42, 150–161 [DOI] [PubMed] [Google Scholar]
- 9.Yang M., Mailhot G., Birnbaum M. J., MacKay C. A., Mason-Savas A., Odgren P. R. (2006) Expression of and role for ovarian cancer G-protein-coupled receptor 1 (OGR1) during osteoclastogenesis. J. Biol. Chem. 281, 23598–23605 [DOI] [PubMed] [Google Scholar]
- 10.Ichimonji I., Tomura H., Mogi C., Sato K., Aoki H., Hisada T., Dobashi K., Ishizuka T., Mori M., Okajima F. (2010) Extracellular acidification stimulates IL-6 production and Ca2+ mobilization through proton-sensing OGR1 receptors in human airway smooth muscle cells. Am. J. Physiol. Lung Cell. Mol. Physiol. 299, L567–L577 [DOI] [PubMed] [Google Scholar]
- 11.Saxena H., Deshpande D. A., Tiegs B. C., Yan H., Battafarano R. J., Burrows W. M., Damera G., Panettieri R. A., Dubose T. D. Jr., An S. S., Penn R. B. (2012) The GPCR OGR1 (GPR68) mediates diverse signalling and contraction of airway smooth muscle in response to small reductions in extracellular pH. Br. J. Pharmacol. 166, 981–990 [DOI] [PMC free article] [PubMed] [Google Scholar]
- 12.Tomura H., Wang J. Q., Komachi M., Damirin A., Mogi C., Tobo M., Kon J., Misawa N., Sato K., Okajima F. (2005) Prostaglandin I(2) production and cAMP accumulation in response to acidic extracellular pH through OGR1 in human aortic smooth muscle cells. J. Biol. Chem. 280, 34458–34464 [DOI] [PubMed] [Google Scholar]
- 13.Huang X. P., Karpiak J., Kroeze W. K., Zhu H., Chen X., Moy S. S., Saddoris K. A., Nikolova V. D., Farrell M. S., Wang S., Mangano T. J., Deshpande D. A., Jiang A., Penn R. B., Jin J., Koller B. H., Kenakin T., Shoichet B. K., Roth B. L. (2015) Allosteric ligands for the pharmacologically dark receptors GPR68 and GPR65. Nature 527, 477–483 [DOI] [PMC free article] [PubMed] [Google Scholar]
- 14.Deshpande D. A., Theriot B. S., Penn R. B., Walker J. K. (2008) β-arrestins specifically constrain β2-adrenergic receptor signaling and function in airway smooth muscle. FASEB J. 22, 2134–2141 [DOI] [PMC free article] [PubMed] [Google Scholar]
- 15.Kong K. C., Gandhi U., Martin T. J., Anz C. B., Yan H., Misior A. M., Pascual R. M., Deshpande D. A., Penn R. B. (2008) Endogenous Gs-coupled receptors in smooth muscle exhibit differential susceptibility to GRK2/3-mediated desensitization. Biochemistry 47, 9279–9288 [DOI] [PMC free article] [PubMed] [Google Scholar]
- 16.Mumberg D., Müller R., Funk M. (1995) Yeast vectors for the controlled expression of heterologous proteins in different genetic backgrounds. Gene 156, 119–122 [DOI] [PubMed] [Google Scholar]
- 17.Erlenbach I., Kostenis E., Schmidt C., Hamdan F. F., Pausch M. H., Wess J. (2001) Functional expression of M1, M3 and M5 muscarinic acetylcholine receptors in yeast. J. Neurochem. 77, 1327–1337 [DOI] [PubMed] [Google Scholar]
- 18.Dong S., Rogan S. C., Roth B. L. (2010) Directed molecular evolution of DREADDs: a generic approach to creating next-generation RASSLs. Nat. Protoc. 5, 561–573 [DOI] [PubMed] [Google Scholar]
- 19.Sandbo N., Kregel S., Taurin S., Bhorade S., Dulin N. O. (2009) Critical role of serum response factor in pulmonary myofibroblast differentiation induced by TGF-β. Am. J. Respir. Cell Mol. Biol. 41, 332–338 [DOI] [PMC free article] [PubMed] [Google Scholar]
- 20.Misior A. M., Yan H., Pascual R. M., Deshpande D. A., Panettieri R. A. Jr., Penn R. B. (2008) Mitogenic effects of cytokines on smooth muscle are critically dependent on protein kinase A and are unmasked by steroids and cyclooxygenase inhibitors. Mol. Pharmacol. 73, 566–574 [DOI] [PubMed] [Google Scholar]
- 21.Gosens R., Stelmack G. L., Dueck G., McNeill K. D., Yamasaki A., Gerthoffer W. T., Unruh H., Gounni A. S., Zaagsma J., Halayko A. J. (2006) Role of caveolin-1 in p42/p44 MAP kinase activation and proliferation of human airway smooth muscle. Am. J. Physiol. Lung Cell. Mol. Physiol. 291, L523–L534 [DOI] [PubMed] [Google Scholar]
- 22.Penn R. B., Panettieri R. A. Jr., Benovic J. L. (1998) Mechanisms of acute desensitization of the β2AR-adenylyl cyclase pathway in human airway smooth muscle. Am. J. Respir. Cell Mol. Biol. 19, 338–348 [DOI] [PubMed] [Google Scholar]
- 23.Disthabanchong S., Martin K. J., McConkey C. L., Gonzalez E. A. (2002) Metabolic acidosis up-regulates PTH/PTHrP receptors in UMR 106-01 osteoblast-like cells. Kidney Int. 62, 1171–1177 [DOI] [PubMed] [Google Scholar]
- 24.Pauwels R. A., Brusselle G. J., Kips J. C. (1997) Cytokine manipulation in animal models of asthma. Am. J. Respir. Crit. Care Med. 156, S78–S81 [DOI] [PubMed] [Google Scholar]
- 25.Deshpande D. A., Wang W. C., McIlmoyle E. L., Robinett K. S., Schillinger R. M., An S. S., Sham J. S., Liggett S. B. (2010) Bitter taste receptors on airway smooth muscle bronchodilate by localized calcium signaling and reverse obstruction. Nat. Med. 16, 1299–1304 [DOI] [PMC free article] [PubMed] [Google Scholar]
- 26.Deshpande D. A., Walseth T. F., Panettieri R. A., Kannan M. S. (2003) CD38/cyclic ADP-ribose-mediated Ca2+ signaling contributes to airway smooth muscle hyper-responsiveness. FASEB J. 17, 452–454 [DOI] [PubMed] [Google Scholar]
- 27.Yang Y., Lei H., Qiang Y. W., Wang B. (2017) Ixazomib enhances parathyroid hormone (PTH)-induced β-catenin/T-cell factor (TCF) signaling by dissociating β-catenin from the PTH receptor. Mol. Biol. Cell 28, 1792–1803 [DOI] [PMC free article] [PubMed] [Google Scholar]
- 28.Yan H., Deshpande D. A., Misior A. M., Miles M. C., Saxena H., Riemer E. C., Pascual R. M., Panettieri R. A., Penn R. B. (2011) Anti-mitogenic effects of β-agonists and PGE2 on airway smooth muscle are PKA dependent. FASEB J. 25, 389–397 [DOI] [PMC free article] [PubMed] [Google Scholar]
- 29.An S. S., Fabry B., Trepat X., Wang N., Fredberg J. J. (2006) Do biophysical properties of the airway smooth muscle in culture predict airway hyperresponsiveness? Am. J. Respir. Cell Mol. Biol. 35, 55–64 [DOI] [PMC free article] [PubMed] [Google Scholar]
- 30.Fabry B., Maksym G. N., Butler J. P., Glogauer M., Navajas D., Fredberg J. J. (2001) Scaling the microrheology of living cells. Phys. Rev. Lett. 87, 148102. [DOI] [PubMed] [Google Scholar]
- 31.Morgan S. J., Deshpande D. A., Tiegs B. C., Misior A. M., Yan H., Hershfeld A. V., Rich T. C., Panettieri R. A., An S. S., Penn R. B. (2014) β-Agonist-mediated relaxation of airway smooth muscle is protein kinase A-dependent. J. Biol. Chem. 289, 23065–23074 [DOI] [PMC free article] [PubMed] [Google Scholar]
- 32.Lefkowitz R. J., Shenoy S. K. (2005) Transduction of receptor signals by β-arrestins. Science 308, 512–517 [DOI] [PubMed] [Google Scholar]
- 33.Carr R. III, Du Y., Quoyer J., Panettieri R. A. Jr., Janz J. M., Bouvier M., Kobilka B. K., Benovic J. L. (2014) Development and characterization of pepducins as Gs-biased allosteric agonists. J. Biol. Chem. 289, 35668–35684 [DOI] [PMC free article] [PubMed] [Google Scholar]
- 34.Dogra S., Sona C., Kumar A., Yadav P. N. (2016) Tango assay for ligand-induced GPCR-β-arrestin2 interaction: application in drug discovery. Methods Cell Biol. 132, 233–254 [DOI] [PubMed] [Google Scholar]
- 35.Forkuo G. S., Kim H., Thanawala V. J., Al-Sawalha N., Valdez D., Joshi R., Parra S., Pera T., Gonnella P. A., Knoll B. J., Walker J. K., Penn R. B., Bond R. A. (2016) Phosphodiesterase 4 inhibitors attenuate the asthma phenotype produced by β2-adrenoceptor agonists in phenylethanolamine N-methyltransferase-knockout mice. Am. J. Respir. Cell Mol. Biol. 55, 234–242 [DOI] [PMC free article] [PubMed] [Google Scholar]
- 36.Isom D. G., Sridharan V., Baker R., Clement S. T., Smalley D. M., Dohlman H. G. (2013) Protons as second messenger regulators of G protein signaling. Mol. Cell 51, 531–538 [DOI] [PMC free article] [PubMed] [Google Scholar]
- 37.Mizuta K., Mizuta F., Xu D., Masaki E., Panettieri R. A. Jr., Emala C. W. (2011) Gi-coupled γ-aminobutyric acid-B receptors cross-regulate phospholipase C and calcium in airway smooth muscle. Am. J. Respir. Cell Mol. Biol. 45, 1232–1238 [DOI] [PMC free article] [PubMed] [Google Scholar]
- 38.Tang D. D. (2015) Critical role of actin-associated proteins in smooth muscle contraction, cell proliferation, airway hyperresponsiveness and airway remodeling. Respir. Res. 16, 134. [DOI] [PMC free article] [PubMed] [Google Scholar]
- 39.Ogata N., Shinoda Y., Wettschureck N., Offermanns S., Takeda S., Nakamura K., Segre G. V., Chung U. I., Kawaguchi H. (2011) G alpha(q) signal in osteoblasts is inhibitory to the osteoanabolic action of parathyroid hormone. J. Biol. Chem. 286, 13733–13740 [DOI] [PMC free article] [PubMed] [Google Scholar]


