

Abstract
Clearance of waste products from the brain is of vital importance. Recent publications suggest a potential clearance mechanism via paravascular channels around blood vessels. Arterial pulsations might provide the driving force for paravascular flow, but its flow pattern remains poorly characterized. In addition, the relationship between paravascular flow around leptomeningeal vessels and penetrating vessels is unclear. In this study, we determined blood flow and diameter pulsations through a thinned-skull cranial window. We observed that microspheres moved preferentially in the paravascular space of arteries rather than in the adjacent subarachnoid space or around veins. Paravascular flow was pulsatile, generated by the cardiac cycle, with net antegrade flow. Confocal imaging showed microspheres distributed along leptomeningeal arteries, while their presence along penetrating arteries was limited to few vessels. These data suggest that paravascular spaces around leptomeningeal arteries form low resistance pathways on the surface of the brain that facilitate cerebrospinal fluid flow.
Keywords: Cerebrospinal fluid, interstitial fluid, subarachnoid space, paravascular space, intracranial pressure, fluid dynamics
Introduction
The cerebrospinal fluid (CSF) is produced mainly by the choroid plexuses, located in the ventricular system. CSF leaves the ventricles via the median and lateral apertures, where it enters the subarachnoid space (SAS). It is subsequently removed via diverse outflow pathways, including arachnoid granulations and the cribriform plate.1,2 Recent work from Iliff et al. suggests that part of the CSF is recirculated into the brain via paravascular spaces around arteries,3 possibly providing interstitial bulk flow that aids the removal of waste products such as amyloid β. This was based on 2-photon microscopy of tracer distribution at the brain surface and confocal imaging of brain sections. In mice, transport of tracers along the vessels at the brain surface has been confirmed with MRI.4–6 In humans, paravascular spaces within the brain parenchyma are detectable with MRI7–10 but their presence and dimensions at the brain surface are relatively unexplored.
As the brain is encapsulated within a rigid skull, pulsations derived from the cardiac cycle, but also from respiration, are transmitted to the brain parenchyma and fluids.4,11 Arterial pulsations are considered as the driving force for paravascular transport along vessels.12,13 However, even though several steps were made in understanding the anatomical structures involved in CSF drainage,3,14,15 quantitative measurements of fluid flows via paravascular pathways are lacking. In particular, pulsatility in the PVS has not been established, while the direction of flow, and differences in flow patterns along arteries and veins, remains equivocal.14,16,17 Therefore, in this study we characterized paravascular flow along leptomeningeal vessels in mice, using fluorescent microspheres that were imaged via a thinned cranial window. As we anticipated previously15 that pulsations might facilitate ISF–CSF exchange through mixing, we imaged the PVS at the brain surface using high-speed imaging of vascular diameter, blood velocity, and microsphere movement, to capture the flow pattern in the PVS in relation to blood vessel pulsatility.
Materials and methods
Reagents
CSF movement along the paravascular space was traced using polystyrene microspheres (1 µm fluoSpheres, Ex. 495/Em. 515), purchased from Molecular Probes-Life Technologies. To prevent aggregation, microspheres were conjugated with albumin (15 mg/ml). Prior to infusion in the cisterna magna, 10 µl of microspheres conjugated with albumin was diluted in 90 µl of artificial CSF (aCSF—135 mM NaCl, 5.4 mM KCl, 1 mM MgCl2, 1.8 mM Cacl2, 5 mM HEPES). To visualize the vasculature in vivo, FITC dextran (Sigma, 10 mg/ml in PBS, 500 kDa, Ex. 494 nm/Em. 521) was infused intravenously.
Animal studies
All animal experiments complied with the ARRIVE guidelines and were carried out in accordance with the UK Animals (Scientific Procedures) Act, 1986 and associated guidelines, and EU Directive 2010/63/EU for animal experiments. Mice were housed in groups under a 12 h light–dark cycle and fed ad libitum with standard laboratory food and free access to water. For this study, 12 male mice (4 months old) were used. Two mice were used for the intracranial pressure (ICP) measurements and 10 for intravital microscopy. Male C57BL/6JOlaHsd mice were obtained from Harlan (the Netherlands). Animals were fed ad libitum with standard laboratory food and had free access to water. They were allowed to acclimatize at least one week before being enrolled in experimental protocols. All experimental protocols were approved by the Committee for Animal Experiments of the Academic Medical Center Amsterdam.
Anesthesia
In all experiments, mice were anesthetized with a mixture of 17% ketamine (Nimatek, Eurovet), 3% medetomidine (Dormitor, Orion Pharma), and 7% atropine (Atropinesulfaat, Eurovet) in phosphate buffered saline (PBS, Lonza) by intraperitoneal injection (75 µl/10 g body weight).
Intracranial pressure
To measure ICP during different rates of microsphere infusion, a 29-gauge needle, connected to a pressure transducer, was inserted into the cisterna magna. To connect the transducer and the needle we used a stiff polyethylene tubing to prevent damping of pulsations. Next, we inserted a second 29-gauge needle into the cisterna magna, which was connected to a polyethylene catheter and a syringe containing microspheres. After recording the baseline ICP, we started to infuse microspheres into the cisterna magna and recorded ICP. Data were recorded with a PowerLab acquisition system and analyzed with Chart data analysis software (AD instruments).
Experimental design
After complete anesthesia (lack of toe pinch reflex), the head and the neck were shaved with an electrical razor. To maintain physiological body temperature, animals were placed on a heating pad. We used an ocular lubricant (DURATEARS, Alcon) to keep the eyes hydrated. The animals were artificially ventilated (Minivent, Harvard Apparatus) with a stroke volume of 8 ml/kg body weight, at a rate of 120 strokes/min. To visualize the cerebral vasculature, 50 µl of fluorescent dye was injected in the dorsal penile vein. During the whole experiment, the heart rate of the animals was monitored (ECG PLUGSYS Minicase Type 609, Harvard Apparatus). Subsequently, the animal was turned in the prone position and fixed to the stereotactic frame (lab standard stereotaxic, Stoelting). To obtain a thinned skull cranial window, we first cut the skin on the head. The window was then positioned over the branches of the middle cerebral artery (MCA). Before scraping the bone away, we applied a local anesthetic (1% xylocaine). The thinned skull technique we used in the current study was based on the model described by Yang et al.18 The selected area of the skull was thinned using a portable micromotor high-speed drill. During this step, the skull was continuously wetted with artificial CSF (aCSF) to prevent overheating of the area and to remove the bone’s dust. We finally used a mini blade with round tip (Synga medical) to gently scrape the skull until ∼20 µm thickness. The cortical vasculature was clearly visible though the thinned window. At this point, we prepared the animal for the injection of microspheres in the cisterna magna as described previously.17 Briefly, we removed the subcutaneous tissue and split the neck muscles. Then, we placed a 29-gauge needle, connected to a polyethylene catheter and a prefilled syringe into the cisterna magna. The needle was fixated with glue. When the animal was in position for imaging we connected the syringe to a pump (Harvard Apparatus) and started infusion of the mixture of aCSF and fluorescent microspheres into the cisterna magna at 0.34 µl/min. Additional control experiments (n = 5) were done using the same experimental procedure. In this set, vessel diameters were measured before and during aCSF infusion to investigate a possible impact of the infusion on blood vessel diameter. In this set, both arterial and venous diameters were measured at three locations along each vessel and at three different time points.
Image acquisition
The custom made intravital fluorescence microscope was equipped with a power LED (Thorlabs M470L2, wavelength 470 nm) for excitation of FITC-dextran to visualize the blood stream and the fluorescent microspheres. The cortical vasculature was visualized through the thinned skull using a 20× magnification water immersion objective (Olympus). The space between the skull surface and the objective was filled with a transparent viscoelastic solution (2% hydroxypropyl methylcellulose solution, Ocucoat). Images were recorded with a high-speed camera (Orca Flash 4.0, Hokawo). Once the videos were acquired, the animals were sacrificed and the brain was rapidly collected for confocal microscopy.
Blood flow dynamics
Blood vessels were visualized using intravenously injected FITC-dextran. Red blood cells (RBC) appeared dark against the bright fluorescent background of plasma. The selected vessels were positioned horizontally in the field of view and 5–10 s videos were acquired at a high frame rate (typically between 200 and 300 frames/s) to measure RBC speed and vessel diameter. The videos were then analyzed with custom made software (see below).
Measurement of CSF dynamics in the paravascular space
The vessels with microspheres in the PVS were further analyzed using ImageJ software.19 Brightness was adjusted and a Gaussian Blur filter was applied prior to tracking of microspheres along the vessels. We tracked the microspheres using the manual tracking plugin. Microspheres that appeared to be stuck were excluded for analysis.
Data analysis
We developed custom made software in MatLab for the analysis of vascular diameter and blood velocity in the cranial window setup. In summary, vascular inner diameter and its pulsatility were estimated from intensity thresholding over a few hundred micrometers of vessel length. RBC velocity was determined from the axial movement of the intensity profile, as imaged by diagonal streaks of displacement–time images. The software estimates the angle of these streaks and converts this to velocity and direction.
Confocal microscopy
Confocal microscopy was performed on frozen brain sections. After sacrifice of the animals, the brains were removed, embedded in Tissue-Tek and immediately frozen in liquid nitrogen prior to storage at −80℃. Samples were cut in two different planes (coronal and sagittal) with a cryomicrotome, and slices were collected (5 µm thickness). For immunostaining, sections were fixed by 3.7% paraformaldehyde and washed three times in PBS. Then, sections were blocked in 3% BSA for 1 h and subsequently incubated overnight with the primary antibody. The day after they were washed three times in PBS and incubated for 1 h with the secondary antibody. Finally, the sections were washed three times in PBS and mounted with DAKO fluorescence mounting medium (Agilent). Sections were stained for laminin (Sigma-Aldrich) or Von Willebrand factor (Abcam). Images were acquired using a Confocal Laser Scanning Microscope (Leica TCS SP8) with 20× oil immersion objective.
Statistics
In all figures, data are expressed as mean ± SEM. Differences in microsphere location were evaluated by one-way ANOVA, followed by Tukey’s post hoc test. To compare changes in diameter prior and during infusion we used a paired t-test. A p value of < 0.05 was considered significant. We used Prism software (Graphpad) to perform statistics.
Results
Impact of infusion rate on ICP
To image paravascular flow dynamics, we infused fluorescently labeled microspheres into the cisterna magna of mice. As a high infusion rate may increase ICP and obscure physiological flow patterns, we tested different infusion rates while measuring the ICP via the cisterna magna. First, we recorded the baseline ICP, which averaged 4.1 ± 0.4 mmHg (SEM, n = 2). We then increased the infusion rate stepwise, while recording pressure. At 0.34 µl/min the ICP rose to 4.2 mmHg, while at 1 µl/min the mean ICP rose to 5.3 mmHg. At higher infusion rates pressure increased without reaching a steady state. The ICP decreased gradually after ending the infusion. Based on these measurements we chose to use a microsphere infusion rate of 0.34 µl/min in the subsequent experiments, as this infusion rate minimally increased ICP.
Impact of infusion on blood volume
As a second control for pumping induced artifacts, we studied the impact of infusion into the CSF on blood vessel diameters. However, neither arteries nor veins showed a significant change in diameter upon pumping (0.34 µl/min). Data are shown in Table 1.
Table 1.
Vessel diameters before and during infusion.
| Arteries (n = 5) | Veins (n = 5) | |
|---|---|---|
| Before infusion (µm) | 45 ± 7 | 66 ± 10 |
| During infusion (µm) | 45 ± 7 | 65 ± 10 |
| t-Test | 0.97 | 0.95 |
No significant differences were observed. Data are expressed as mean ± SEM.
Location of microspheres
The thinned skull cranial window was made on the edge of the dorsal part of the skull (see Figure 1(a)), to image branches arising from the MCA. This location was chosen as previous work15 showed spreading of fluorescent dextrans around the circle of Willis and the larger vessels arising from it, including the MCA, after injection into the CSF. After a delay of approximately 45 min, microspheres appeared around the branches of the MCA (Figure 1(b)). The microspheres traveled mainly in close vicinity of the arterial wall. This was substantiated by a significant difference in microsphere counts between adjacent and more remote areas (Figure 1(c)). Occasionally, we observed microspheres moving further away from vessels. Some microspheres appeared to be stuck. A video with a typical example of microspheres moving along a branch of the MCA is shown in supplementary material 1.
Figure 1.

Microspheres move along arteries. The cranial window (black circle in (a)) was made to image branches of the MCA. (b) A typical image of two microspheres moving close to the vessel wall (indicated by the white lines). A capillary crosses the MCA branch (black lines). The majority of the microspheres were found close to the vessel wall, suggesting that the paravascular space is around 20 µm in width at this level of the vascular tree (c). Only a few microspheres were observed at larger distance, presumably in the subarachnoid space (SAS). Data are mean ± SEM. Scale bar represents 50 µm. *p < 0.05 and **p < 0.01.
Pulsatility in vascular diameter, blood velocity, and microsphere movement
Automated tracking of blood vessel diameter and blood velocity showed a pulsatile pattern, generated by the heartbeat. Microspheres were manually tracked offline. The ensemble average for vascular diameter, blood velocity, and microsphere position illustrates a clear pulsatile pattern for all signals (Figure 2). The microspheres moved forward during systole and the first part of diastole, and moved backward during the second half of diastole.
Figure 2.
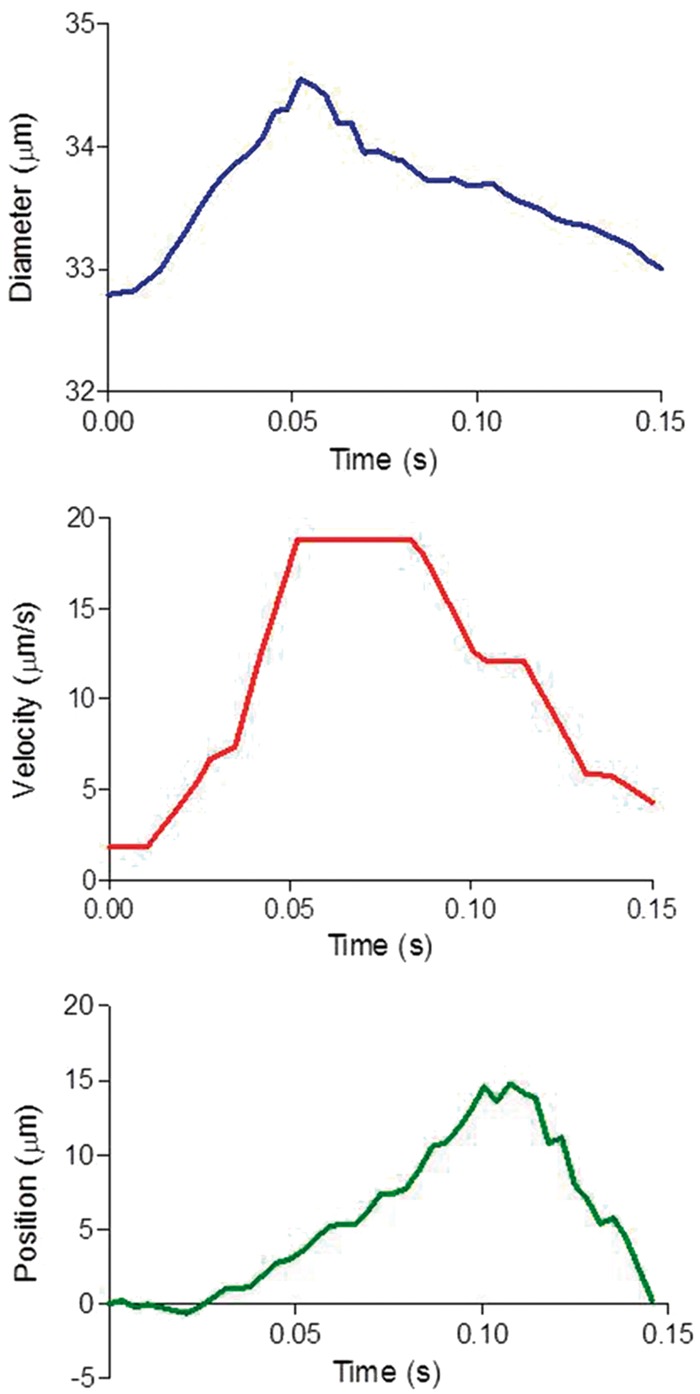
Ensemble average of diameter, blood velocity, and microsphere position. The ensemble average was constructed from a typical recording over 2 s. All parameters showed a pulsatile pattern attributable to the heartbeat. The microspheres showed a to and fro movement during the cardiac cycle. Position of the microsphere indicates the deviation from the net forward trend.
Characterization of microsphere movement
Based on the frequency of the oscillations, the back and forth movement of the microspheres (see supplementary video 1) was attributable to the cardiac cycle. The mean amplitude of the back and forth movement of the microspheres was 14 ± 2 µm (based on six microspheres/animal, with n = 5) per cycle. In all experiments, we observed this oscillatory pattern. Figure 3 shows a typical pattern over 2 s. The net movement of microspheres in the PVS was in the same direction as the blood flow, with an average velocity of 17 ± 2 µm/s (based on six microspheres/animal, with n = 5).
Figure 3.
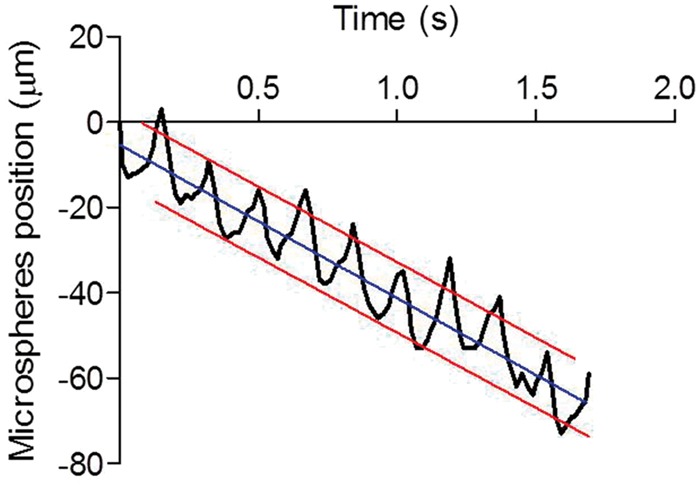
Microspheres oscillate in the paravascular space of leptomeningeal vessels. The microspheres moved along the vessels in an oscillatory manner. The frequency of the oscillations corresponded to the heart rate of the animal.
Blood velocity and diameter pulsatility
Tracking of centerline blood velocity yielded values ranging from 0.9 to 5.5 µm/s. Table 2 shows velocity values for one vessel of each animal. Diameter values ranged from 21 to 39 µm. Oscillations in diameter where relatively small, or even undetectable in some vessels.
Table 2.
Blood speed and diameter parameters.
| Mean V (µm/s) | Median V (µm/s) | Mean D (µm) | Median D (µm) | Relative change D % | |
|---|---|---|---|---|---|
| N1 | 5.5 ± 0.9 | 5.6 ± 0.8 | 33.8 ± 0.2 | 33.8 ± 0.2 | 10.0 ± 3.0 |
| N2 | 3.6 ± 1.0 | 3.9 ± 0.8 | 39.0 ± 2.3 | 39.0 ± 2.3 | 6.0 ± 2.0 |
| N3 | 3.0 ± 0.3 | 3.1 ± 0.2 | 21.1 ± 0.3 | 21.1 ± 0.3 | Not pulsatile |
| N4 | 0.9 ± 0.8 | 0.5 ± 0.5 | 29.2 ± 2.8 | 29.1 ± 2.8 | Not pulsatile |
| N5 | 3.9 ± 0.5 | 4.0 ± 0.4 | 20.6 ± 7.4 | 20.7 ± 7.4 | 1.0 ± 1.0 |
Mean and median blood velocity (V) and diameter (D) values. Diameter oscillations are given as percentage of diameter. All values are expressed as mean ± SEM, derived from multiple recordings of each single vessel. Two out of five vessels did not show pulsatility.
Microsphere localization using confocal microscopy
As the cranial window observations were limited to a particular location and have a limited depth resolution, we further analyzed microsphere distribution using confocal microscopy on brain sections. This showed the presence of microspheres around arteries, veins, and in the SAS around the whole brain. Microspheres were abundant in the big cisterns at the base of the brain. Microspheres were more frequently found around arteries as compared to veins (Figure 4). With few exceptions at the ventral part of the brain (Figure 4(b), green arrow), there was very limited penetration of microspheres along vessels in the parenchyma.
Figure 4.

Microsphere distribution around arteries, veins, and the SAS. (a, b) The SAS with microspheres (green arrows) around arteries (a), veins (v), and in the SAS. Microspheres were present at the surface, but did not follow the PVS along penetrating vessels at the dorsal side of the brain (a). However, they were present in the paravascular space of some parenchymal arteries at the ventral side of the brain (b). In (c), a large paravascular space is evident next to a leptomeningeal artery (white box). (d) Quantification of microspheres. Microspheres were observed more frequently around arteries as compared to veins. Total microsphere numbers were similar around arteries as compared to the SAS, which, however, occupied a much larger surface area. Blue: nuclear stain; green: microspheres; magenta: laminin; and red: Von Willebrand, to identify vessels and pial membranes. (a) Scale bar 200 µm and (b, c) scale bar 50 µm. Data are mean ± SEM; *p < 0.05.
Discussion
In this study, we determined PVS flow dynamics in relation to blood flow and blood vessel diameter in mice, using microspheres. Microspheres appeared in the cranial window with some delay, after injection into the CSF of the cisterna magna. The vast majority of microspheres was observed within a 20 -µm range next to arteries. This corresponds well with data from Iliff et al.3 that were obtained with in vivo two-photon imaging. In the present study, confocal images confirmed the abundant presence of microspheres around arteries. However, microspheres were also found more scattered throughout the much larger surface area of the SAS, and occasionally around the largest veins. In our view, the simplest explanation for this finding is that PVS around arteries and veins are continuous with the SAS, but that the PVS is larger around arteries than veins, and much wider than the SAS. This notion was supported by in vivo optical coherence tomography (OCT) images of both mice and humans (supplementary material 2). In these images the PVS appear to result from a physical distension of the SAS by leptomeningeal blood vessels.
To analyze the flow pattern in the PVS, we traced fluorescent microspheres. These showed a pulsatile to and fro movement, induced by the heartbeat. This movement along arteries correlated with an oscillatory blood velocity pattern and diameter changes. However, diameter oscillations were small and in some cases undetectable at the measurement location. This suggests that diameter oscillations either further upstream or downstream may contribute to fluid displacement in the PVS. Microspheres moved along the PVS with a net component in the same direction as blood flow. It is important to stress that we found bulk flow at the surface of the brain only. We did not observe penetration of microspheres into the brain parenchyma along paravascular spaces at the lateral and dorsal part of the brain. One possibility is that paravascular spaces become very narrow when entering the cortex and do not allow 1 µm microspheres to pass. However, in previous work15 we found that fluorescent dextrans as small as a few nanometers in diameter also poorly penetrate the brain along PVS, with exception of a few arteries at the ventral part of the brain. Therefore, we believe a more likely explanation is that CSF flows along PVS on the brain surface toward the front of the brain, and exits the skull via the cribriform plate, consistent with previous findings from our group and others.17,20,21 We found no evidence for bulk flow entering the tissue along PVS of penetrating arteries and removal via paravenous spaces. Furthermore, our findings suggest a direct connection between PVS around arteries and veins at the level of the SAS. This would eliminate a pressure gradient, which is necessary to sustain glymphatic flow.22
Arterial pulsations have repeatedly been suggested to drive paravascular flow. Indeed, one study showed that altered pulsatility in the cerebral vasculature affected the penetration of tracers along PVS and into the parenchyma.12 In addition, Kiviniemi et al. proposed that CSF propulsion is governed by a fast cardiovascular pulsation, together with the respiratory pulsation and slow vasomotor wave fluctuations.4 However, in the absence of valves, it is difficult to see how pulsations are able to create net flow. Thus, a more simple explanation for the PVS flow we observed is that it originates from the vis a tergo CSF production from the choroid plexus and exits from the cribriform plate and other structures. However, we do believe that pulsatile flow at the brain surface may be important for waste removal from the brain parenchyma. Thus, we speculate that arterial pulsations generate mixing in the PVS of penetrating arteries. In this manner, mixing without bulk flow into or out of the parenchyma, may still increase ISF–CSF exchange in the PVS of penetrating arteries. Via the direct physical connection of these PVS with the PVS of the leptomeningeal vessels, solutes, and waste products may be subsequently swept away by bulk flow of CSF at the brain surface. Recent theoretical work supports this notion.23 Lack of pulsatility, as may be anticipated in conditions associated with vascular stiffening, such as aging and hypertension, therefore might affect brain clearance.
Conclusions
In conclusion, the PVS appears much larger around arteries, but is continuous with the SAS and spaces around veins. The large PVS around arteries creates a low resistance pathway for CSF flow. For branches of the MCA, bulk flow in the PVS is in the same direction as blood flow, and likely caused by CSF production by the choroid plexus and exit via the cribriform plate and other routes. Flow within the PVS around arteries is pulsatile, generated by the heartbeat. While we speculate that pulsatility in itself does not create bulk flow in the PVS, this may be important to facilitate ISF–CSF exchange via PVS that extent into the parenchyma.
Supplementary Material
Acknowledgements
We thank Ir. P. Bloemen, Prof T.G. Van Leeuwen, and Dr M. ter Laan for the acquisition of the human and mice OCT data. The ImageJ manual track plugin was developed by Fabrice Cordelieres.
Funding
The author(s) disclosed receipt of the following financial support for the research, authorship, and/or publication of this article: Internationale Stichting Alzheimer Onderzoek (ISAO) and the European Union’s Seventh Framework Programme for research technological development and demonstration under Grant agreement no. 606998.
Declaration of conflicting interests
The author(s) declared no potential conflicts of interest with respect to the research, authorship, and/or publication of this article.
Authors’ contributions
BB, EvB, and EB designed the study and wrote the manuscript. BB, EB, and JdeV performed animal experiments. MA analyzed OCT images.
Supplementary material
Supplementary material for this paper can be found at the journal website: http://journals.sagepub.com/home/jcb.
References
- 1.Brinker T, Stopa E, Morrison J, et al. A new look at cerebrospinal fluid circulation. Fluids Barriers CNS 2014; 11: 10. [DOI] [PMC free article] [PubMed] [Google Scholar]
- 2.Hladky SB, Barrand MA. Mechanisms of fluid movement into, through and out of the brain: evaluation of the evidence. Fluids Barriers CNS 2014; 11: 26. [DOI] [PMC free article] [PubMed] [Google Scholar]
- 3.Iliff JJ, Wang M, Liao Y, et al. A paravascular pathway facilitates CSF flow through the brain parenchyma and the clearance of interstitial solutes, including amyloid beta. Sci Transl Med 2012; 4: 147ra11. [DOI] [PMC free article] [PubMed] [Google Scholar]
- 4.Kiviniemi V, Wang X, Korhonen V, et al. Ultra-fast magnetic resonance encephalography of physiological brain activity - Glymphatic pulsation mechanisms? J Cereb Blood Flow Metab 2016; 36: 1033–1045. [DOI] [PMC free article] [PubMed] [Google Scholar]
- 5.Gaberel T, Gakuba C, Goulay R, et al. Impaired glymphatic perfusion after strokes revealed by contrast-enhanced MRI: a new target for fibrinolysis? Stroke 2014; 45: 3092–3096. [DOI] [PubMed] [Google Scholar]
- 6.Iliff JJ, Lee H, Yu M, et al. Brain-wide pathway for waste clearance captured by contrast-enhanced MRI. J Clin Invest 2013; 123: 1299–1309. [DOI] [PMC free article] [PubMed] [Google Scholar]
- 7.Bouvy WH, Biessels GJ, Kuijf HJ, et al. Visualization of perivascular spaces and perforating arteries with 7 T magnetic resonance imaging. Invest Radiol 2014; 49: 307–313. [DOI] [PubMed] [Google Scholar]
- 8.Bouvy WH, Zwanenburg JJ, Reinink R, et al. Perivascular spaces on 7 Tesla brain MRI are related to markers of small vessel disease but not to age or cardiovascular risk factors. J Cereb Blood Flow Metab 2016; 36: 1708–1717. [DOI] [PMC free article] [PubMed] [Google Scholar]
- 9.Kilsdonk ID, Steenwijk MD, Pouwels PJ, et al. Perivascular spaces in MS patients at 7 Tesla MRI: a marker of neurodegeneration? Mult Scler 2015; 21: 155–162. [DOI] [PubMed] [Google Scholar]
- 10.van Veluw SJ, Biessels GJ, Bouvy WH, et al. Cerebral amyloid angiopathy severity is linked to dilation of juxtacortical perivascular spaces. J Cereb Blood Flow Metab 2016; 36: 576–580. [DOI] [PMC free article] [PubMed] [Google Scholar]
- 11.Wagshul ME, Eide PK, Madsen JR. The pulsating brain: a review of experimental and clinical studies of intracranial pulsatility. Fluids Barriers CNS 2011; 8: 5. [DOI] [PMC free article] [PubMed] [Google Scholar]
- 12.Iliff JJ, Wang M, Zeppenfeld DM, et al. Cerebral arterial pulsation drives paravascular CSF-interstitial fluid exchange in the murine brain. J Neurosci 2013; 33: 18190–18199. [DOI] [PMC free article] [PubMed] [Google Scholar]
- 13.Sharp MK, Diem AK, Weller RO, et al. Peristalsis with oscillating flow resistance: a mechanism for periarterial clearance of amyloid beta from the brain. Ann Biomed Eng 2016; 44: 1553–1565. [DOI] [PubMed] [Google Scholar]
- 14.Carare RO, Bernardes-Silva M, Newman TA, et al. Solutes, but not cells, drain from the brain parenchyma along basement membranes of capillaries and arteries: significance for cerebral amyloid angiopathy and neuroimmunology. Neuropathol Appl Neurobiol 2008; 34: 131–144. [DOI] [PubMed] [Google Scholar]
- 15.Bedussi B, van der Wel NN, de Vos J, et al. Paravascular channels, cisterns, and the subarachnoid space in the rat brain: a single compartment with preferential pathways. J Cereb Blood Flow Metab 2017; 37: 1374–1385. [DOI] [PMC free article] [PubMed] [Google Scholar]
- 16.Arbel-Ornath M, Hudry E, Eikermann-Haerter K, et al. Interstitial fluid drainage is impaired in ischemic stroke and Alzheimer’s disease mouse models. Acta Neuropathol 2013; 126: 353–364. [DOI] [PMC free article] [PubMed] [Google Scholar]
- 17.Bedussi B, van Lier MG, Bartstra JW, et al. Clearance from the mouse brain by convection of interstitial fluid towards the ventricular system. Fluids Barriers CNS 2015; 12: 23. [DOI] [PMC free article] [PubMed] [Google Scholar]
- 18.Yang G, Pan F, Parkhurst CN, et al. Thinned-skull cranial window technique for long-term imaging of the cortex in live mice. Nat Protoc 2010; 5: 201–208. [DOI] [PMC free article] [PubMed] [Google Scholar]
- 19.Schneider CA, Rasband WS, Eliceiri KW. NIH Image to ImageJ: 25 years of image analysis. Nat Methods 2012; 9: 671–675. [DOI] [PMC free article] [PubMed] [Google Scholar]
- 20.Johnston M, Zakharov A, Papaiconomou C, et al. Evidence of connections between cerebrospinal fluid and nasal lymphatic vessels in humans, non-human primates and other mammalian species. Cerebrospinal Fluid Res 2004; 1: 2. [DOI] [PMC free article] [PubMed] [Google Scholar]
- 21.Nagra G, Koh L, Zakharov A, et al. Quantification of cerebrospinal fluid transport across the cribriform plate into lymphatics in rats. Am J Physiol Regul Integr Comp Physiol 2006; 291: R1383–R1389. [DOI] [PubMed] [Google Scholar]
- 22.Jin BJ, Smith AJ, Verkman AS. Spatial model of convective solute transport in brain extracellular space does not support a “glymphatic” mechanism. J Gen Physiol 2016; 148: 489–501. [DOI] [PMC free article] [PubMed] [Google Scholar]
- 23.Asgari M, de Zelicourt D, Kurtcuoglu V. Glymphatic solute transport does not require bulk flow. Sci Rep 2016; 6: 38635. [DOI] [PMC free article] [PubMed] [Google Scholar]
Associated Data
This section collects any data citations, data availability statements, or supplementary materials included in this article.