Abstract
Background
The efficacy of facial muscle exercises (FMEs) for facial rejuvenation is controversial. In the majority of previous studies, nonquantitative assessment tools were used to assess the benefits of FMEs.
Objectives
This study examined the effectiveness of FMEs using a Pao (MTG, Nagoya, Japan) device to quantify facial rejuvenation.
Methods
Fifty females were asked to perform FMEs using a Pao device for 30 seconds twice a day for 8 weeks. Facial muscle thickness and cross-sectional area were measured sonographically. Facial surface distance, surface area, and volumes were determined using a laser scanning system before and after FME. Facial muscle thickness, cross-sectional area, midfacial surface distances, jawline surface distance, and lower facial surface area and volume were compared bilaterally before and after FME using a paired Student t test.
Results
The cross-sectional areas of the zygomaticus major and digastric muscles increased significantly (right: P < 0.001, left: P = 0.015), while the midfacial surface distances in the middle (right: P = 0.005, left: P = 0.047) and lower (right: P = 0.028, left: P = 0.019) planes as well as the jawline surface distances (right: P = 0.004, left: P = 0.003) decreased significantly after FME using the Pao device. The lower facial surface areas (right: P = 0.005, left: P = 0.006) and volumes (right: P = 0.001, left: P = 0.002) were also significantly reduced after FME using the Pao device.
Conclusions
FME using the Pao device can increase facial muscle thickness and cross-sectional area, thus contributing to facial rejuvenation.
Level of Evidence: 4

An everlasting youthful appearance has been pursued by humans of nearly all cultures for several centuries. Aging is an inescapable part of human life that leaves traces on the face in the form of wrinkles and sagging skin.1,2 As life expectancy increases in many parts of the world, a youthful appearance has become even more highly valued,3-5 and considerable efforts are being devoted to improving and correcting facial aging.
As soft tissue ages, changes involving the nasolabial region are closely associated with changes in the midface. Facial aging is most noticeable in the increased prominence of the nasolabial folds, a function of thinning soft tissues superficial to the levator labii superioris and zygomaticus major muscles, loss of the malar fat, including the medial, middle, and lateral temporal cheek fat, and secondarily, sagging skin above the malar fold.6
Correction of these manifestations of facial aging has long been the exclusive field of plastic surgeons and dermatologists, with interventions including injections with botulinum toxin, chemical peeling, dermal fillers, facelift, laser treatment, browlift, and eyelid surgery.7,8 However, there is increasing interest in reducing facial aging by alternative approaches, such as facial acupressure, facial acupuncture, and, especially, through exercises aimed at strengthening, moving, and manipulating the facial muscles.7 These alternative approaches are less invasive and less expensive, and they can usually be performed by nonmedical specialists.8
However, the efficacy of facial muscle exercises for facial rejuvenation is controversial. Some researchers have concluded that these exercises are an effective way to reduce wrinkles and sagging skin.9,10 For example, van Lieshout et al9 reported a direct correlation between improved skin elasticity in weakened and sagging facial skin and increased facial muscle exercise (FME). The skin may benefit from FME through improved tissue regeneration and enhanced drainage of waste materials via increased lymph and blood circulation.10 Yet, other studies have reported adverse effects of FME.11-14 According to Roizen and Oz,11 wrinkles result from repetitive movements of the skin, specifically, repeated contraction of the facial muscles, combined with the loss of elastin and collagen with aging. FMEs that involve repeated folding of the facial skin might therefore induce or aggravate, rather than lessen, the formation of wrinkles.11 Excessive manipulation or massage of the skin may increase the loss of elasticity, thereby also promoting facial skin wrinkling and sagging.12-14
Previous studies suggested FME reduces vertical wrinkles above the upper lip by training the middle part of the superior orbicularis oris muscle. Other exercises have been aimed at reducing the depth of the nasolabial folds by training the zygomaticus major muscle and at eliminating a double chin while obtaining a more defined jawline by training the suprahyoid muscles.9,10 However, the majority of studies on FME have assessed the outcome nonquantitatively, such as by questionnaire15-17 visual observation,18,19 or self-reported patient satisfaction.20 In the absence of studies showing that FME actually improves facial muscle thickness (FMT), more precise investigation of the potential benefits of FME on the facial muscles are needed.
The Pao device (MTG, Nagoya, Japan) was designed to train the muscles around the mouth (Figure 1). It involves simply holding the device in the mouth and rocking it by nodding the head, such that the bilateral balance weights begin to swing. The Pao device was devised to simplify exercise requirements and to offer a more standardized approach to FME.9 However, very few studies have examined the effectiveness of FME using the Pao device (FMEuP) for facial rejuvenation.
Figure 1.
Facial muscle exercise using the Pao device demonstrated on a 30-year-old woman. (A) The mouthpiece of the Pao device is held in the center of the mouth using the lips; (B) the oscillatory movement of the Pao device resulting from nodding.
The purpose of this study was to evaluate effectiveness of FMEuP on facial rejuvenation. FMT and cross-sectional area (CSA) were measured by sonography; facial surface distances, facial surface areas, and facial volumes using a laser scanning system (LSS), and wrinkles and jawline sagging by the Wrinkle Severity Rating Scale (WSRS) and Face Visual Scale (FVS), respectively. We hypothesized that, after FMEuP, FMT and facial muscle CSA would increase, while facial surface distances, facial surface areas, and lower face volumes would decrease.
METHODS
Subjects
Fifty women who met our inclusion and exclusion criteria were recruited in Korea (Table 1) from those who filled out a questionnaire (Appendix A) and answered positively concerning nasolabial folds or skin sagging around the mouth or jawline. We advertised recruitment of this study for the general public in Wonju city, Korea. We checked whether or not the participants were concerned with nasolabial folds or skin sagging around the mouth or jawline among the general public in Wonju city who volunteered to participate in answer to an advertisement. The exclusion criteria were (1) history of dermatological interventions on or around the mouth or jaw, such as laser treatment, chemical peels, injection of botulinum toxin, and dermal fillers, during the past 3 years; (2) history of plastic surgery on or around the mouth or jaw during the past 3 years; (3) history of cosmetic enhancement through FME; (4) history of smoking; and (5) dimpled face. All participants signed an informed consent form regarding the potential risks and benefits of FMEuP. This study was approved by the Yonsei University Wonju Institutional Review Board. The study protocols were approved by the Yonsei University Wonju Campus Human Studies Committee in February 2016 (1041849-201607-BM-036-02).
Table 1.
Characteristics of the Study Participants
| Characteristic | Mean ± SD (N = 50) | Range |
|---|---|---|
| Age, years | 40.0 ± 10.0 | 30-63 |
| Body height, cm | 160.3 ± 14.6 | 153-170 |
| Body mass, kg | 59.5 ± 8.3 | 44.1-75.7 |
| BMI, kg/m2 | 22.21 ± 2.83 | 1.53-1.7 |
BMI, body mass index; SD, standard deviation.
Instrumentation
Ultrasound Equipment
Ultrasound images of the facial muscles (levator labii superioris, orbicularis oris, zygomaticus major, and, among the suprahyoid muscles, the digastric muscle) were obtained using a diagnostic ultrasound system (A35; Samsung Medison, Seoul, Korea) that included a 3-16 MHZ probe (LA3-16A). The mechanical index was set to 0.73 for the LA3-16A transducer. Sonography was performed at 95 dB using constant time gain compensation, and transmission gel applied to the facial area of interest. The transducer was always held vertically to the skin surface. The ultrasound equipment settings were held constant during the measurements.
Facial Surface Scanning
Facial surface distance, facial surface area, and facial volume were determined by facial surface scanning using the FastSCAN LSS (Polhemus, Colchester, VT), which probe is manually swept over the object by the operator in a manner analogous to spray painting. In this study, a Class A laser line scanner was swept repeatedly over the participant’s face. The FastSCAN laser scanning software system collects data from the hand-held laser scanner and a 3-dimensional position reference transmitter to produce digital surface maps in real time. FastSCAN uses two cameras arranged symmetrically at an offset angle on either side of a centrally mounted laser generator. An electromagnetic tracker measures the position and orientation of the scanner in space, thus removing the need for a rigid mechanical scanning gantry.
Assessment
Quantitative Measurements of Facial Muscle Thickness and CSA
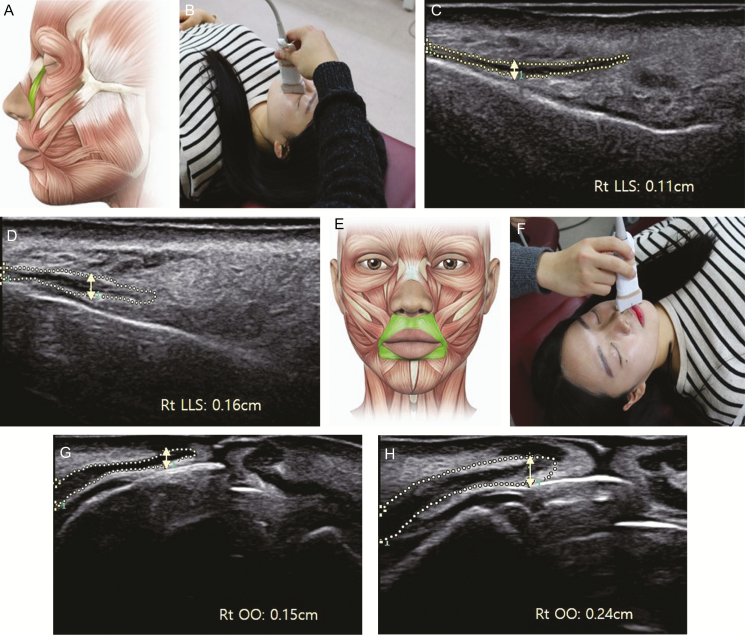
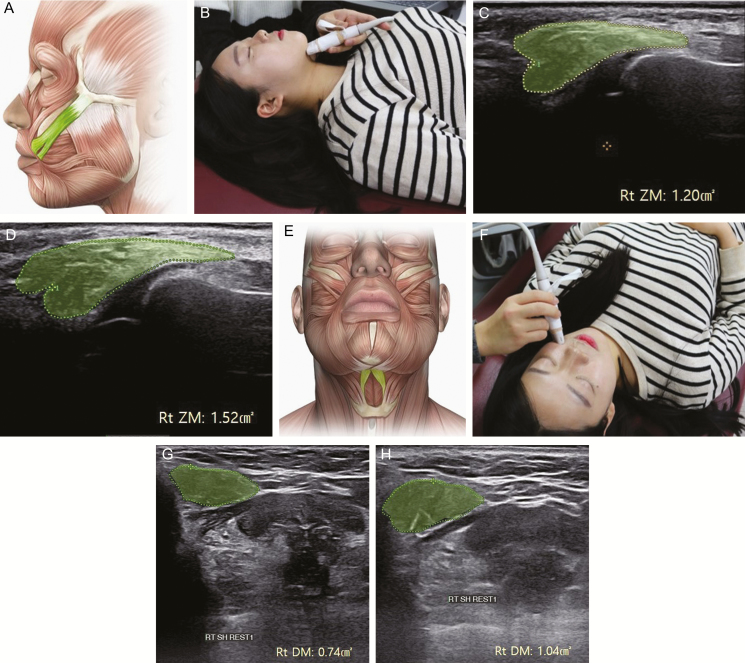
Ultrasonography scans were made of four mimic muscles on each side of the face: the levator labii superioris, orbicularis oris, zygomaticus major, and digastric (suprahyoid) muscles (Figures 2 and 3). Studies have shown that these facial muscles can be identified reliably.21-24 FMT and CSA were quantified using the calculation system of the A35 application (A35; Samsung Medison, Seoul, Korea). The levator labii superioris muscle was scanned by holding the probe in the middle of a line between the corner of the mouth and the medial corner of the eye, beside the alar cartilage of the nose.24 The probe was tilted slightly laterally, and the FMT of the muscle was calculated.24 The orbicularis oris muscle was scanned by holding the probe between the columella and philtrum ridges and on the upper lip.21 It was then positioned sagittally within the philtrum ridges,21 and the FMT of was calculated.22 The zygomaticus major muscle was scanned by holding the probe perpendicular to a line between the corner of the mouth and the zygomatic bone and against the zygomatic bone,24 a position that allowed calculation of the CSA of the zygomaticus major muscle.22 The digastric muscle, one of the suprahyoid muscles, was scanned by holding the probe perpendicular to a line midway between the mandible and the hyoid bone.23 The CSA was then calculated.23
Figure 2.
Measurement of the thickness of the levator labii superioris and orbicularis oris muscles using ultrasound images of a 30-year-old woman. (A) Anatomical position of the levator labii superioris muscle, (B) probe position for the levator labii superioris and muscle thickness of the levator labii superioris (C) initially and (D) after the sessions; (E) anatomical position of the orbicularis oris muscle, (F) probe position for the orbicularis oris and muscle thickness of orbicularis oris (G) initially, and (H) after the sessions.
Figure 3.
Measurement of the cross-sectional area of the zygomaticus major and digastric muscles using ultrasound images of a 30-year-old woman. (A) Anatomical position of the zygomaticus major muscle, (B) probe position for the digastric muscle, cross-sectional area of the digastric muscle, (C) cross-sectional area of the zygomaticus major initially, and (D) after the sessions, (E) anatomical position of the digastric muscle, (F) probe position for the zygomaticus major, (G) initially, and (H) after the sessions.
Quantitative Measurements of Facial Surface Distances, Surface Areas, and Volumes
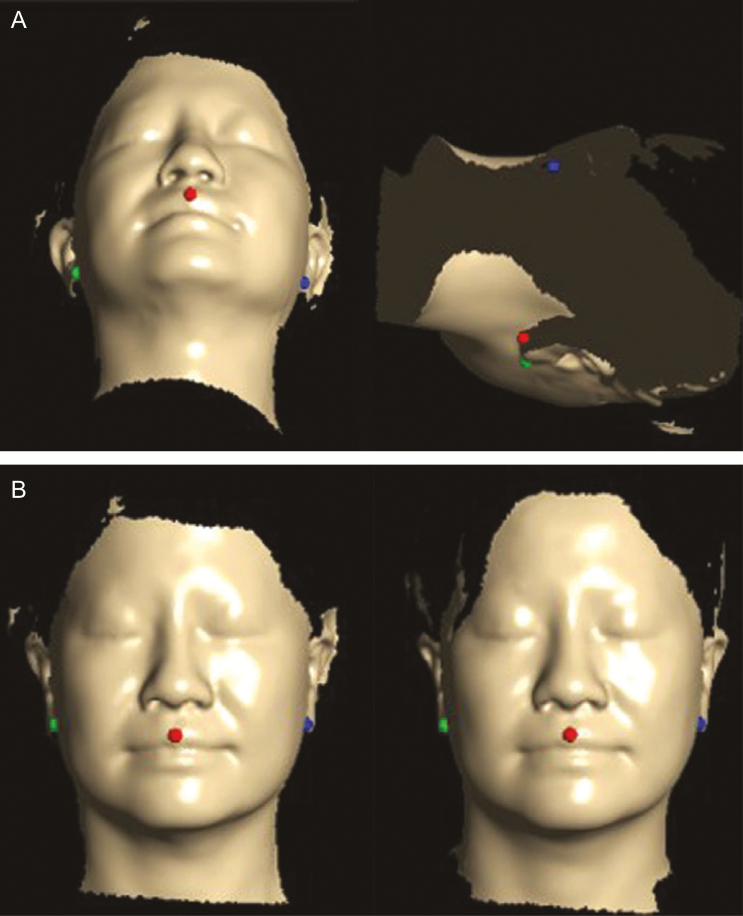
The data collected by laser scanning were viewed and analyzed using Delta software (FarField Technology, Christchurch, New Zealand). Because of differences in the axis and location of the measured structures between before and after FME, both were determined using landmarks based on three points (center of Cupid’s bow of the upper lip, contact spots under the ear lobe on both sides) in the registration process (Figure 4).
Figure 4.
Calibration of the pre- and postsession axes and placement of the face scan data based on three landmark points in the facial registration process (A) before and (B) after calibration, demonstrated on a 44-year-old woman.
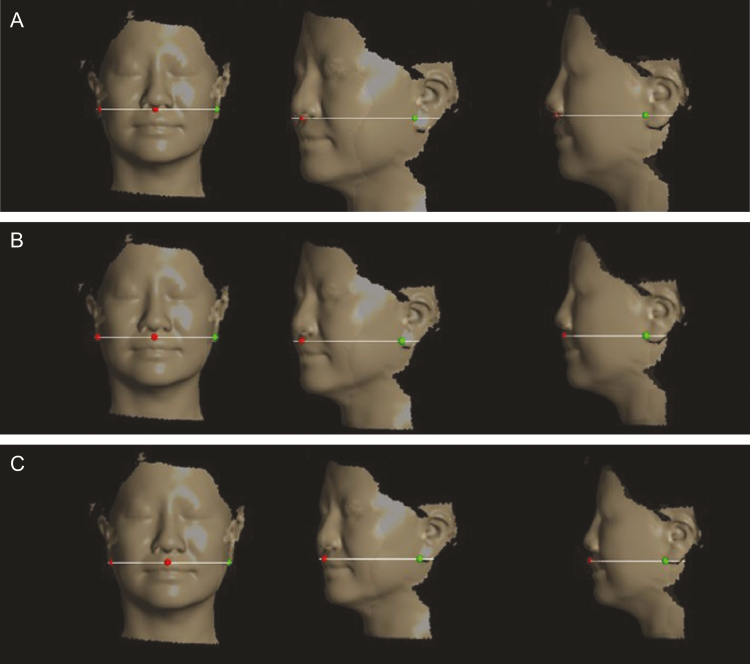
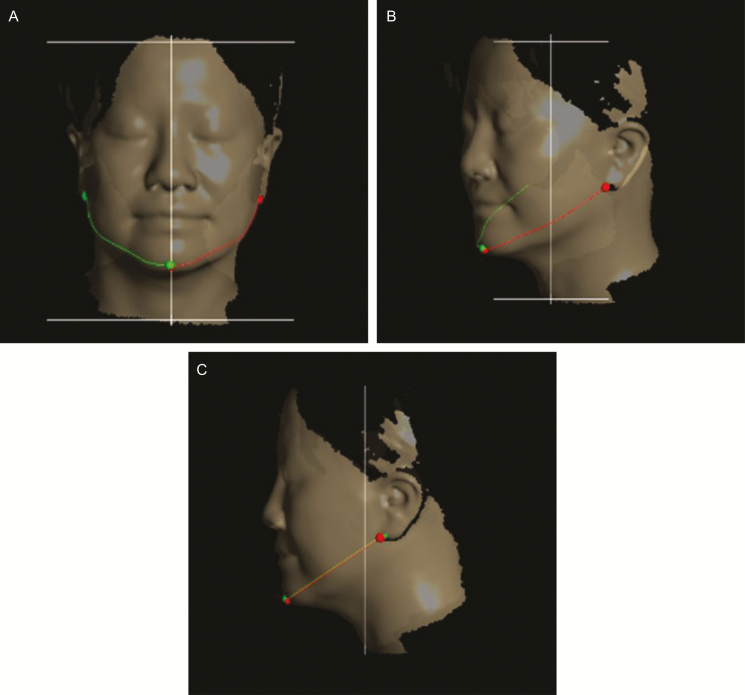
The midfacial surface distances between the sagittal axis of the center of Cupid’s bow of the upper lip and the sagittal axis contact spots with the ear lobe and chin were measured in the upper, middle, and lower transverse planes (upper: contact spot between the columella and philtrum; lower: center of Cupid’s bow of the upper lip; middle: middle of two planes) (Figure 5). The midfacial surface distances were measured bilaterally to confirm improvement of the nasolabial folds. The Delta software could target participants’ facial surfaces with customized axis points using the Contours mode. In addition, a dot was placed at the meeting point between the sagittal axis along the center of Cupid’s bow of the upper lip and the chin in frontal view. The jawline surface distance was measured between the meeting point of the sagittal axis in the center of Cupid’s bow of the upper lip, the chin in frontal view, and the contact spots on the ear lobe and chin to confirm the improvement of jawline sagging (distance measurement of intrareliability: ICC = 0.894) (Figure 6).
Figure 5.
Measurement of midfacial surface distances in the (A) upper, (B) middle, and (C) lower transverse plane using Delta software, demonstrated on a 44-year-old woman.
Figure 6.
Measurement of the jawline surface distance using Delta software demonstrated on a 44-year-old man. (A) Frontal, (B) oblique, and (C) side views.
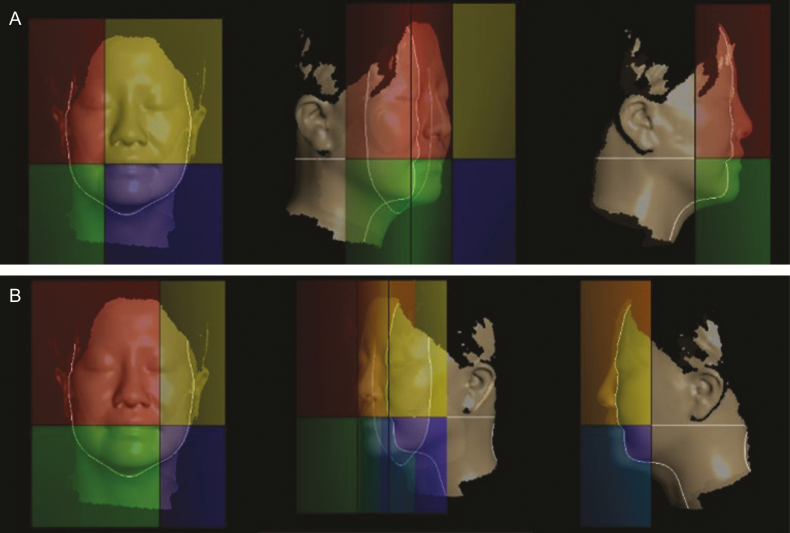
Facial surface area and volume were measured using the quadrants mode to assess changes in jawline sagging (Figure 7). The Delta software divided the laser-scanned face into four quadrants, measuring surface area and volume within each one, based on the corner of the mouth on the right and left sides (intra-reliability of the surface area and volume measurements: ICC = 0.998 and 0.998, respectively).
Figure 7.
Measurement of facial surface area and volume in of the lower quadrants using Delta software demonstrated on a 44-year-old man. (A) Right and (B) left sides.
Wrinkle Severity Rating Scale
The wrinkle severity rating scale (WSRS) is a validated 5-point scale where 1 = absent, 2 = mild, 3 = moderate, 4 = severe, and 5 = extreme wrinkling of the skin (intra-reliability of the WSRS: ICC = 0.840). This scale is based on the current assessment rather than on a comparison with the pretreatment appearance determined from a facial photograph. Scoring is based on visual assessment of the length and apparent depth of the nasolabial folds, without reference to a baseline or to the pretreatment appearance. In the present study, the WSRS was determined by a blinded independent observer asked to judge randomly ordered facial photographs. The independent observer is an office staff member and researcher for facial muscle rehabilitation. The order in which the facial photographs were shown to the independent observer was randomized using a random number table created using a randomization generator (www.randomization.com).
Face Visual Scale: Wrinkles and Jawline Sagging
The face visual scale (FVS) is a subjective instrument measuring patient satisfaction. Six selected studies have shown a significant mean improvement based on a 0 to 10 scale in participants receiving skin treatment such as hyaluronic acid, fractional YAG laser, and intense-pulsed light treatment.25-29 Evaluations in the present study included two self-assessments (jawline sagging and wrinkle satisfaction) and self-rating of jawline sagging and wrinkles. (0 = very good, 10 = very poor) before and after FME.
Procedures
This study was performed as follows for 3 months from June to September 2016. First, during a presession, all participants were asked to assess themselves in front of a mirror, using the FVS to assign a score for wrinkles and jawline sagging. Second, all participants were photographed in a standardized manner in the frontal plane. Illumination was from artificial light and the built-in flash of the Canon 750D camera only. The distance from the tip of the participant’s nose to the lens of the camera was 150 cm. The height of the tripod was adapted to the participant’s height. All participants sat in the same chair in front of the same white background and wore no make-up. They were asked to sit upright with a straight back and to maintain a neutral facial expression. Third, the faces of all participants were scanned using the LSS to measure facial surface distance, surface area, and volume. A standard protocol was implemented to reduce variation and unwanted scan artifacts during laser scanning of the face. During scanning, all overhead lights in the vicinity were turned off to reduce light artifacts (Supplemental Figure 1). Participants were asked to sit on a wooden chair, using its attached wooden plate to support their head and back, and to remain motionless in the sitting position with eyes closed during laser scanning. The LSS transmitter was placed on the wooden plate within 10 cm of the individual’s head. Laser scanning was performed by sweeping the face with the hand piece. Completion of the surface laser scan was confirmed based on the real-time raw facial surface image displayed on the system’s laptop. The laser scan data were saved on the laptop and processed using the Delta software. Fourth, FMT and CSA were measured ultrasonographically. All participants were examined in the supine position and were completely relaxed. During the examination, directed contraction of facial muscles was used to confirm the correct position of the transducer. To reduce systematic error arising from muscle compression, the pressure between the probe and skin was minimized prior to image acquisition. Fifth, the participants were educated about the FMEs, including their correct performance. The participants also received written instructions and a video for each exercise, along with advice on how to incorporate training into their daily routine. Participants were instructed to form an “O” with their mouth and hold the mouthpiece of the Pao device, located in its center, with their lips, making sure that force was evenly applied by the involved facial muscles. Nodding the head up and down causes the weighted ends of the Pao bar to swing. The weights were regulated to 23 g. FMEuP was performed twice a day for 30 seconds for 8 weeks. Adherence to this schedule was confirmed by telephone two times a week and the participants were encouraged to perform FMEuP at least 6 days a week.
The subjects did not undergo dermatological interventions, and plastic surgery on or around the mouth or jaw in the time between when the pre-and postfacial muscle exercise. Before experimental procedures, we notified the subjects to refrain from dermatological interventions and plastic surgery on or around the mouth or jaw. Also, we recruited the subjects who have not experienced dermatological interventions and plastic surgery on or around the mouth or jaw.
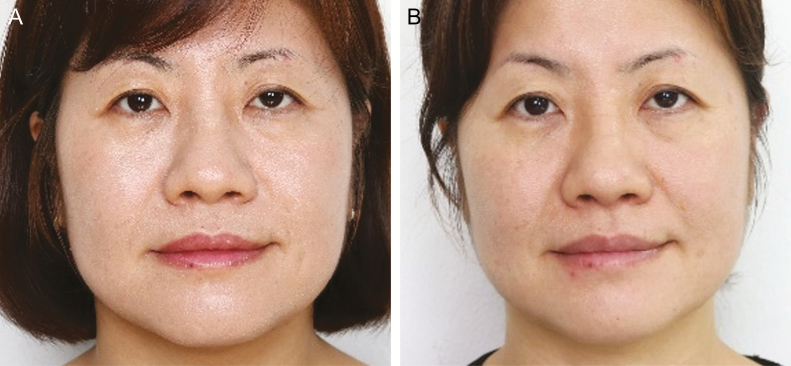
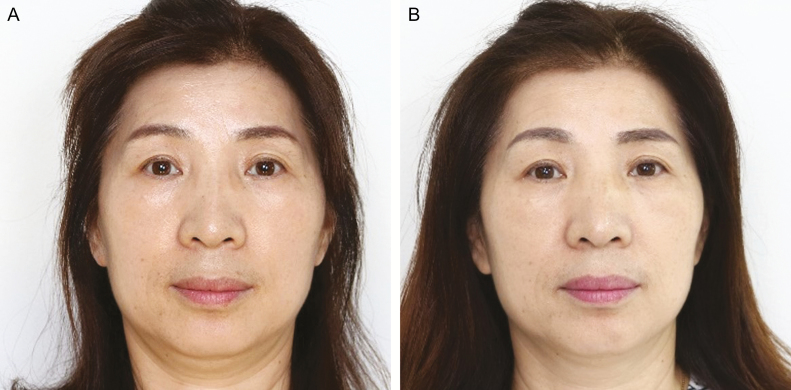
After 8 weeks, the measurements performed as described above were repeated. For each participant, the instrument settings remained the same as during the presession (Figures 8 and 9).
Figure 8.
A 44-year-old woman (A) before and (B) 8 weeks after facial muscle exercise using the Pao device.
Figure 9.
A 51-year-old woman (A) before and (B) 8 weeks after the facial muscle exercise using the Pao device.
Statistical Analysis
All statistical analyses were conducted using SPSS ver. 18.0 software (SPSS, Chicago, IL). A P-value of 0.05 was considered to indicate statistical significance. The Kolmogorov-Smirnov Z-test was used to verify the assumption of distribution normality. Descriptive statistics were used to analyze the sonography and facial laser scanning data, which were normally distributed. The ICC (3, 2) model was used to test intrarater reliability for measurements of surface distance, area, and volume. The WSRS scores based on photos and the FVS (wrinkle and jawline sagging) for self-assessments before and after FME were compared using Wilcoxon signed-rank tests. The quantitative data on levator labii superioris and orbicularis oris muscle thickness and the CSA of the zygomaticus major and digastric muscle values pre- and post-FME were compared for both sides using paired Student t tests. The quantitative data on the midfacial surface distances in a 3-directional transverse plane, consisting of jawline distance, quadrant surface area, and volume based on the corner of the mouth, were compared in paired Student t tests for both sides of the face before and after FME.
RESULTS
The 50 women (mean age, 40.0 ± 10.0 years; range, 30-63 years) completed the protocol and provided data for analysis.
Quantitative Measurements of FMT and CSA
Table 2 shows the mean (standard deviation) of FMT pre- and post-FME. The CSA of the zygomaticus major muscle increased significantly on both sides (right: P < 0.001, left: P = 0.015) after, compared with before, FMEuP. The bilateral increase in the CSA of the digastric muscle was also significant (right: P = 0.003, left: P = 0.001). The FMT of the levator labii superioris increased significantly on the right side (from 0.126 to 0.136cm; P = 0.006) compared with before FME, but not on the left side (from 0.125 to 0.128cm; P = 0.230). The pre- vs post-FMEuP values for the FMT differed significantly on the left (from 0.212 to 0.228 cm; P = 0.019) but not on the right (from 0.227 to 0.235cm; P = 0.183) side of the orbicularis oris muscle.
Table 2.
Comparison of the Thickness and Cross-Sectional Area of the Facial Muscles Before and After Facial Muscle Exercise Using the Pao Device
| Muscle | Side | Before | After | P |
|---|---|---|---|---|
| Mean ± SD | Mean ± SD | |||
| Levator labii superioris, cm | Right | 0.126 ± 0.023 | 0.136 ± 0.026 | 0.006 |
| Left | 0.125 ± 0.019 | 0.128 ± 0.021 | 0.230 | |
| Orbicularis oris, cm | Right | 0.227 ± 0.041 | 0.235 ± 0.041 | 0.183 |
| Left | 0.212 ± 0.042 | 0.228 ± 0.036 | 0.019 | |
| Zygomaticus major, cm2 | Right | 0.772 ± 0.058 | 0.822 ± 0.063 | 0.000 |
| Left | 0.773 ± 0.052 | 0.802 ± 0.064 | 0.015 | |
| Digastric muscle, cm2 | Right | 0.750 ± 0.126 | 0.799 ± 0.130 | 0.003 |
| Left | 0.740 ± 0.123 | 0.797 ± 0.126 | 0.001 |
SD, standard deviation.
Quantitative Measurements of Facial Surface Distances, Facial Surface Areas, and Volumes
Tables 3 and 4 show the mean (standard deviation) facial surface distance, surface area, and volume pre- and post-FME. The midfacial surface distance in the midtransverse plane (midpoint between the contact between the columella and philtrum and the center of Cupid’s bow of the upper lip) was significantly lower on both sides (right: P = 0.005, left: P = 0.047), as were the midfacial surface distance in the lower transverse plane (center of Cupid’s bow of the upper lip; right: P = 0.028, left: P = 0.019) and the jawline surface distance (right: P = 0.004, left: P = 0.003). However, the difference between the pre- and post-FMEuP measurements of the midfacial surface distance in the upper transverse plane (contact spot between the columella and philtrum) was not significant, bilaterally.
Table 3.
Comparison of Facial Surface Distance, Determined Using the Laser Scanning System, Before and After Facial Muscle Exercise Using the Pao Device
| Distance, mm | Side | Before | After | P |
|---|---|---|---|---|
| Mean ± SD | Mean ± SD | |||
| Midfacial surface distances in the upper transverse plane | Right | 130.103 ± 7.040 | 129.564 ± 7.031 | 0.358 |
| Left | 130.131 ± 7.175 | 130.676 ± 7.957 | 0.344 | |
| Midfacial surface distances in the middle transverse plane | Right | 126.717 ± 7.609 | 126.302 ± 7.553 | 0.005 |
| Left | 126.525 ± 7.875 | 126.129 ± 8.000 | 0.047 | |
| Midfacial surface distances in the lower transverse plane | Right | 126.357 ± 6.984 | 125.942 ± 6.947 | 0.028 |
| Left | 125.822 ± 7.510 | 125.323 ± 7.551 | 0.019 | |
| Jawline surface distance | Right | 130.892 ± 7.637 | 129.544 ± 8.404 | 0.004 |
| Left | 130.046 ± 8.242 | 128.671 ± 8.499 | 0.003 |
SD, standard deviation.
Table 4.
Comparison of Facial Surface Area and Volume, Determined Using the Laser Scanning System, Before and After Facial Muscle Exercise Using the Pao Device
| Surface area and volume in the lower facial quadrantsa | Side | Before | After | P |
|---|---|---|---|---|
| Mean ± SD | Mean ± SD | |||
| Surface area, cm2 | Right | 22.615 ± 7.446 | 22.144 ± 6.756 | 0.005 |
| Left | 21.249 ± 8.012 | 20.491 ± 8.011 | 0.006 | |
| Volume, cm3 | Right | 29.887 ± 16.230 | 28.992 ± 16.487 | 0.001 |
| Left | 27.127 ± 15.111 | 26.533 ± 14.760 | 0.002 |
aWith respect to the corner of the mouth.
SD, standard deviation.
The surface areas of the lower quadrants based on the corner of the mouth were significantly lower on both sides (right: P = 0.005, left: P = 0.006), as were the volumes of the same lower quadrants (right: P = 0.001, left: P = 0.002).
Wrinkle Severity Rating Scale
As shown in Table 5, the mean (standard deviation) of the WSRS pre- and post-FME was 2.582 ± 0.629 and 2.370 ± 0.708, respectively. The decrease was significant (P = 0.025).
Table 5.
Wrinkle Severity Rating Scale, and Facial Visual Scale Scores Assessing Wrinkles and Jawline Sagging Before and After Facial Muscle Exercise Using the Pao Device
| Assessment tool | Before | After | P |
|---|---|---|---|
| Mean ± SD | Mean ± SD | ||
| Wrinkle Severity Rating Scale | 2.582 ± 0.629 | 2.370 ± 0.708 | 0.025 |
| Facial Visual Scale: wrinkles | 3.855 ± 1.715 | 5.130 ± 1.493 | <0.001 |
| Facial Visual Scale: jawline sagging | 4.000 ± 2.082 | 5.407 ± 1.666 | <0.001 |
SD, standard deviation.
Face Visual Scale: Wrinkle and Jawline Sagging
Table 5 also shows the mean (standard deviation) FVS values (wrinkle and jawline sagging) as self-reported by the study participants pre- and post-FME (3.855 ± 1.715 and 5.130 ± 1.493 for wrinkles and 4.000 ± 2.082 and 5.407 ± 1.666 for jawline sagging, respectively). The differences in both were significant (both P < 0.001).
DISCUSSION
This study is the first to demonstrate changes in facial surface distances, surface areas, and volumes, as well as in the WSRS and FVS for wrinkle and jawline sagging in women who used the Pao device for 8 weeks by performing FMEuP on at least 6 days a week. Moreover, after FME, the FMT and CSA of the facial muscles increased, while facial surface distances, surface areas, and volumes decreased compared to the pre-FME values. Only the FMT of the left side of the levator labii superioris, the right side of the orbicularis oris, and the midfacial surface distances in the upper transverse plane had not changed significantly by the end of the study.
Previous studies suggested that FME lessens the nasolabial folds and thus contributes to facial rejuvenation.8,17,30,31 The mean baseline length of a straight line measured by caliper between the nasolabial fold and the tragus was reduced after daily isotonic, isometric, and isokinetic FMEs and weekly facial massage and manipulation for 8 weeks, from 92.2 mm to 88.3 mm (P = 0.023) on the right and from 94.1 mm to 88.5 mm (P = 0.001) on the left.31 Our data similarly showed significant bilateral reductions of the midfacial surface distance in the middle (right: P = 0.005, left: P = 0.047) and lower (right: P = 0.028, left: P = 0.019) transverse planes. The reduction in the facial surface distance along the nasolabial folds may reflect flattening of the surface or a decrease in the depth of the nasolabial folds. An increase in zygomaticus major muscle tension may result from the increasing CSA. The lack of a significant reduction of the midfacial surface distance in the upper plane (right: P = 0.358, left: P = 0.344) may have been due to the increased volume of the zygomaticus major, which may have increased the surface distance.
The reduction in the WSRS was significant (P = 0.025), as was the increase in the FVS for wrinkles (P < 0.001). Recently, Shin et al32 and Ascher et al33 had blinded investigators to assess the effect of a dextran filler (mean improvement in WSRS from baseline: 1.50 ± 0.51) and different forms of hyaluronic acid (mean improvement in WSRS from baseline: 1.58 ± 0.89) on the correction of nasolabial folds. In our study, although the WSRS decreased significantly, the difference was small (from 2.592 ± 0.629 to 2.370 ± 0.708). Compared with the previous results, the change in the WSRS score in our study was relatively small. It might be difficult for the independent observer to detect a pronounced difference between the before vs after photographs of a 2-dimensional frontal plane view. There was a significant difference between the before and after LSS data in the 3-dimensional analysis, suggesting that the independent observer did find it hard to detect a difference between the before and after photographs. Improvement in the latter was visually apparent to both the study participants and the independent observer. A direct comparison of the results of our study with those of previous studies is difficult because of the different methods used to measure facial distance with respect to an improvement of the nasolabial folds and the fact that most other studies relied on subjective (mostly descriptive), not quantitative, assessments provided by the study participants themselves.15-20 Therefore, a quantitative measurement is recommended, using more objective methods, to minimize the interrater variability compared with the WSRS.
The present study measured jawline surface distance and the lower quadrant surface area and volume bilaterally based on the corner of the mouth to confirm improvement in jawline sagging after FMEuP. A previous study demonstrated reduced sagging following 10 treatment sessions that included changing posture-lengthening muscles and reducing tension, cervical stretching, relaxation of the muscles, facial stretching, heat, manipulation maneuvers, facial exercises, and general tips related to bilateral chewing and hydration.18 In another study, isotonic and isometric exercises, stretching, and facial and cervical manipulation were performed daily (at home) and in weekly 1 h sessions for 10 weeks; information on facial care was provided as well.16 The improvement in sagging was assessed by the authors (pre- and posttherapy) based on visual observation aided by clinical photographs and videos; thus, the results cannot be readily compared to our own. In the present study, the jawline surface distance (right: P = 0.004, left: P = 0.003), surface areas of the lower facial quadrants (right: P = 0.005, left: P = 0.006), and the volume of these areas (right: P = 0.001, left: P = 0.002) decreased significantly after FME. These changes typically manifested as a reduction in and straightening of the jawline curve compared to before FME. Changes in jowl surface area can be achieved by treatments such as radiofrequency34 and CO2 laser,28 both of which have been used in an attempt to quantify posttherapy differences in the lower part of the face. However, the calculations made use of a photograph and not the actual contour of the jowl. The decrease in 2-dimensional jowl surface area demonstrated in this study is highly consistent with other clinical grading studies showing improvements in the lower part of the face.34-39 By scanning the actual contour of the jowl using LSS, both the surface area and the volume could be quantified. The results showed a reduction in the surface area and volume of the lower part of the face after FMEuP. However, the differences in the surface area and volume of the lower part of the face, before vs after FMEuP, were in the negative range in 15 cases. The variation in individual body fat percentage or total body water, before and after, may have contributed to differences in the surface area and volume of the lower part of the face in response to FME, possibly affecting the results.40 There was no way to know whether the subjects complied with the instructions to perform FMEuP on at least 6 days a week. This might explain the negative range, which could be due to failure to perform FMEuP on at least 6 days a week.
The decreases in facial surface distances, facial surface area, and lower face volumes after FMEuP can be explained as follows. First, increases in the FMT and CSA of the facial muscles after FMEuP contribute to firmer and more elastic facial skin. In our study, increases in the FMT and CSA of tested facial muscles were either significant or showed increasing trends bilaterally following the prescribed exercises, except the levator labii superioris on the left side and the orbicularis oris on the right side (P = 0.183). The levator labii superioris raises and pushes out the upper lip, while the orbicularis oris closes and holds the lip. The zygomaticus major draws the ends of the mouth upward and laterally. Among the suprahyoid muscles, the digastric muscle depresses the mandible and elevates the hyoid bone. The work by van Lieshout et al9 reported that FME for 8 weeks increased facial muscle strength, as measured using the Facial-Flex device with fixed resistance, and decreased the biomechanical extensibility of the facial skin. They also showed that increased facial muscle strength was directly related to improved skin elasticity, as the facial muscles become stronger and shorten, causing the attached skin to become firmer and more elastic.41 A reduction in the function of the mimetic facial muscles was shown to influence sagging.42 Second, FMEuP may confer the proper intensity to the facial muscles through isometric contraction. Repetitive facial movements based on repeated facial muscle contraction with repeated folding of the facial skin leads to the appearance of wrinkles, which become prominent as the skin loses elastin and collagen with aging.11 Isometric contraction of the mouth, as achieved by forming an “O” to hold the mouthpiece of the Pao device, may reduce the adverse effects of FME by regulated, repetitive facial movements. Fourth, the oscillatory movement achieved by nodding the head while holding the Pao device with the mouth may contribute to an increase in the number of motor units of the facial muscles. Previous studies suggested that oscillatory movements increase muscle spindle activity such that there is less muscle fiber disruption of excitation-contraction coupling43 whereas muscle preactivation is enhanced, increasing the number of motor units and muscle fibers recruited.44
FMEuP was performed for 8 weeks. Generally, strength increases are mostly due to neural adaptation that synchronizes firing and increases the recruitment of motor units before the onset of muscle hypertrophy, usually over a period of 8 weeks, or in 2 to 3 weeks with very high-intensity resistance exercise.45-47 Hypertrophy is an increasingly important adaptation that explains the strength increase in muscle.45 Because FMEuP would not be of sufficiently high intensity to produce hypertrophy of the facial muscles, we chose 8 weeks as the duration of the FMEuP regimen.
Previous studies reported that the detraining effect begins within 2 weeks.48,49 Because of the reversibility principle, detraining could begin within 1 to 2 weeks after the cessation of exercise and continue until the training effects disappear.45,49 A further study should examine the detraining effect in facial muscle, which we postulate would show a detraining effect. Therefore, a follow-up session is necessary to determine how long the effect of FMEuP lasts.
Although our study confirmed that FME was effective for reducing the signs of aging, it had several limitations. First, a control group is needed, with random patient assignment, to allow comparison of the results between control and experimental groups. Second, although we confirmed the effect of FMEuP for 8 weeks, by increasing and extending the checkup session, expeditious FME, and retention of the effect of the FMEuP could be detected more precisely. Third, all of the participants were women. Whether the benefits of FME extend to men remains to be determined. Third, we did not measure facial hyaluronic acid levels, facial skin mechanical properties, or facial muscle strength. These are important factors in facial rejuvenation and their evaluation should be included in future studies.
CONCLUSION
We investigated whether FMEuP using the Pao device influenced the FMT and CSA of the facial muscles, facial surface distances, facial surface areas and volumes, and the WSRS and FVS for wrinkles and a sagging jawline. Our results demonstrated beneficial effects of FMEuP on facial rejuvenation.
Supplementary Material
This article contains supplementary material located online at www.aestheticsurgeryjournal.com.
Disclosures
The authors declared no potential conflicts of interest with respect to the research, authorship, and publication of this article.
Funding
The authors received financial and administrative support provided by KOREATECH (grant number: 2016-51-0122). Also, this work was supported by the Yonsei University Research Fund of 2017-51-0018.
Acknowledgments
The authors would like to thank David Lee, CEO of KOREATECH, for providing complimentary Pao devices for this study.
REFERENCES
- 1. Baumann L. Skin ageing and its treatment. J Pathol. 2007;211(2):241-251. [DOI] [PubMed] [Google Scholar]
- 2. Guinot C, Malvy DJ, Ambroisine L et al. . Relative contribution of intrinsic vs extrinsic factors to skin aging as determined by a validated skin age score. Arch Dermatol. 2002;138(11):1454-1460. [DOI] [PubMed] [Google Scholar]
- 3. Atiyeh BS, Rubeiz MT, Hayek SN. Aesthetic/Cosmetic surgery and ethical challenges. Aesthetic Plast Surg. 2008;32(6):829-839; discussion 840. [DOI] [PubMed] [Google Scholar]
- 4. Haboush A, Warren CS, Benuto L. Beauty, ethnicity, and age: does internalization of mainstream media ideals influence attitudes towards older adults?Sex Roles. 2012;66(9-10):668-676. [Google Scholar]
- 5. Noale M, Limongi F, Scafato E, Maggi S, Crepaldi G. Longevity and health expectancy in an ageing society: implications for public health in Italy. Ann Ist Super Sanita. 2012;48(3):292-299. [DOI] [PubMed] [Google Scholar]
- 6. Rohrich RJ, Pessa JE. The fat compartments of the face: anatomy and clinical implications for cosmetic surgery. Plast Reconstr Surg. 2007;119(7):2219-2227; discussion 2228. [DOI] [PubMed] [Google Scholar]
- 7. Van Borsel J, De Vos MC, Bastiaansen K, Welvaert J, Lambert J. The effectiveness of facial exercises for facial rejuvenation: a systematic review. Aesthet Surg J. 2014;34(1):22-27. [DOI] [PubMed] [Google Scholar]
- 8. De Vos MC, Van den Brande H, Boone B, Van Borsel J. Facial exercises for facial rejuvenation: a control group study. Folia Phoniatr Logop. 2013;65(3):117-122. [DOI] [PubMed] [Google Scholar]
- 9. van Lieshout PH, Bose A, Namasivayam AK. Physiological effects of an 8-week mechanically aided resistance facial exercise program. Int J Orofacial Myology. 2002;28:49-73. [PubMed] [Google Scholar]
- 10. Roggen A. Hou je gezicht fit: gelaatsoefeningen voor jong en oud.Antwerpen: Manteau; 2001. [Google Scholar]
- 11. Roizen M, Oz M.. You: Being Beautiful. New York: Free Press; 2008. [Google Scholar]
- 12. Bergfeld WF. A lifetime of healthy skin: implications for women. Int J Fertil Womens Med. 1999;44(2):83-95. [PubMed] [Google Scholar]
- 13. Chieffi M. Cosmetological aspects of ageing: biological and medical aspects. In: Lansing AI. Cowdry’s Problems of Ageing: Biological and Medical Aspects.3rd ed Baltimore: Williams & Wilkins; 1952:909-923. [Google Scholar]
- 14. Bolognia JL. Aging skin. Am J Med. 1995;98(1A):99S-103S. [DOI] [PubMed] [Google Scholar]
- 15. Lana e Silva N, Vieira VS, Motta AR. Eficácia de duas técnicas fonoaudiológicas da estética facial no músculo orbicular dos olhos: Estudo piloto. Revista CEFAC. 2010;12(4):571-578. [Google Scholar]
- 16. Matos KDF, Loreto PM, Nery TCS, Souza VAM, Souza CB. Análise da eficácia de um trabalho fonoaudiológico com enfoque estético. Revista Fragmentos de Cultura (Goiânia). 2010;20(3):413-432. [Google Scholar]
- 17. Takacs AP, Valdrighi V, Assencio-Ferreira VJ. Fonoaudiologia e estética: Unidas a favor da beleza facial. Revista CEFAC. 2002;4(2):111-116. [Google Scholar]
- 18. Mattia FA, Czlusniak G, Ricci CCPP. Contribuição da fonoaudiologia na estética facial: Relato de caso. Revista Salus-Guarapuava-PR. 2008;2(2):15-22. [Google Scholar]
- 19. Santos CCG, Ferraz MJPC. Atuação da fonoaudiologia na estética facial: Relato de caso clínico. Revista CEFAC. 2011;13(4):763-768. [Google Scholar]
- 20. Frazão Y, Manzi S. Eficácia da intervenção fonoaudiológica para atenuar o envelhecimento facial. Revista CEFAC. 2012;14(4):755-762. [Google Scholar]
- 21. Volk GF, Wystub N, Pohlmann M, Finkensieper M, Chalmers HJ, Guntinas-Lichius O. Quantitative ultrasonography of facial muscles. Muscle Nerve. 2013;47(6):878-883. [DOI] [PubMed] [Google Scholar]
- 22. Volk GF, Sauer M, Pohlmann M, Guntinas-Lichius O. Reference values for dynamic facial muscle ultrasonography in adults. Muscle Nerve. 2014;50(3):348-357. [DOI] [PubMed] [Google Scholar]
- 23. Gervasio A, D’Orta G, Mujahed I, Biasio A. Sonographic anatomy of the neck: The suprahyoid region. J Ultrasound. 2011;14(3):130-135. [DOI] [PMC free article] [PubMed] [Google Scholar]
- 24. Alfen NV, Gilhuis HJ, Keijzers JP, Pillen S, Van Dijk JP. Quantitative facial muscle ultrasound: feasibility and reproducibility. Muscle Nerve. 2013;48(3):375-380. [DOI] [PubMed] [Google Scholar]
- 25. Buntrock H, Reuther T, Prager W, Kerscher M. Efficacy, safety, and patient satisfaction of a monophasic cohesive polydensified matrix versus a biphasic nonanimal stabilized hyaluronic acid filler after single injection in nasolabial folds. Dermatol Surg. 2013;39(7):1097-1105. [DOI] [PubMed] [Google Scholar]
- 26. Luebberding S, Krueger N, Kerscher M. Comparison of validated assessment scales and 3D digital fringe projection method to assess lifetime development of wrinkles in men. Skin Res Technol. 2014;20(1):30-36. [DOI] [PubMed] [Google Scholar]
- 27. Ooe M, Seki T, Miura T, Takada A. Comparative evaluation of wrinkle treatments. Aesthetic Plast Surg. 2013;37(2):424-433. [DOI] [PubMed] [Google Scholar]
- 28. Clementoni MT, Lavagno R, Munavalli G. A new multi-modal fractional ablative CO2 laser for wrinkle reduction and skin resurfacing. J Cosmet Laser Ther. 2012;14(6):244-252. [DOI] [PubMed] [Google Scholar]
- 29. Levenberg A, Halachmi S, Arad-Cohen A, Ad-El D, Cassuto D, Lapidoth M. Clinical results of skin remodeling using a novel pneumatic technology. Int J Dermatol. 2010;49(12):1432-1439. [DOI] [PubMed] [Google Scholar]
- 30. Arizola HGA, Brescovici SM, Delgado SE, Ruschel CK. Face changes on patients after aesthetic speech therapy treatment in school-practice of speech therapy. Revista CEFAC. 2012;14(6):1167-1183. [Google Scholar]
- 31. Paes C, Toledo P, Silva H. Fonoaudiologia e estética facial: estudo de casos. Revista CEFAC. 2007;9(2):213-220. [Google Scholar]
- 32. Shin SJ, Her Y, Yu DS, Kim CW, Kim SS. Twenty-four-week multicenter, evaluator-blinded clinical study of the efficacy and safety of a dextran filler in the treatment of nasolabial folds. Dermatol Surg. 2014;40(6):652-657. [DOI] [PubMed] [Google Scholar]
- 33. Ascher B, Bayerl C, Brun P et al. . Efficacy and safety of a new hyaluronic acid dermal filler in the treatment of severe nasolabial lines - 6-month interim results of a randomized, evaluator-blinded, intra-individual comparison study. J Cosmet Dermatol. 2011;10(2):94-98. [DOI] [PubMed] [Google Scholar]
- 34. Nahm WK, Su TT, Rotunda AM, Moy RL. Objective changes in brow position, superior palpebral crease, peak angle of the eyebrow, and jowl surface area after volumetric radiofrequency treatments to half of the face. Dermatol Surg. 2004;30(6):922-928; discussion 928. [DOI] [PubMed] [Google Scholar]
- 35. Ruiz-Esparza J, Gomez JB. The medical face lift: a noninvasive, nonsurgical approach to tissue tightening in facial skin using nonablative radiofrequency. Dermatol Surg. 2003;29(4):325-332; discussion 332. [DOI] [PubMed] [Google Scholar]
- 36. Weiss RA, Weiss MA, Beasley KI. Monopolar radio frequency (RF) mediated skin contraction of the lower face: study of 35 patients. Am Soc for Laser Med Surg. 2003;15(Suppl):120. [Google Scholar]
- 37. Jacobson L, Geronemus R. Treatment of nasolabial folds and jowls were non-invasive radiofrequency device. Am Soc for Laser Med Surg. 2003;15(Suppl):117. [DOI] [PubMed] [Google Scholar]
- 38. Fitzpatrick RE, Iyer S. Collagen and tissue tightening paradigm for treatment of the cheeks and neck using radiofrequency. Am Soc for Laser Med Surg. 2003;15:114. [Google Scholar]
- 39. Alster TS, Tanzi EI. Treatment of prominent nasolabial folds and cheek laxity with a nonablative radiofrequency device. Am Soc for Laser Med Surg. 2003;15(Suppl):112. [Google Scholar]
- 40. Suber JS, Dinh TP, Prince MD, Smith PD. OnabotulinumtoxinA for the treatment of a “gummy smile”. Aesthet Surg J. 2014;34(3):432-437. [DOI] [PubMed] [Google Scholar]
- 41. Kim K, Jeon S, Kim JK, Hwang JS. Effects of Kyunghee Facial Resistance Program (KFRP) on mechanical and elastic properties of skin. J Dermatolog Treat. 2016;27(2): 191-196. [DOI] [PubMed] [Google Scholar]
- 42. Ezure T, Hosoi J, Amano S, Tsuchiya T. Sagging of the cheek is related to skin elasticity, fat mass and mimetic muscle function. Skin Res Technol. 2009;15(3):299-305. [DOI] [PubMed] [Google Scholar]
- 43. Aminian-Far A, Hadian MR, Olyaei G, Talebian S, Bakhtiary AH. Whole-body vibration and the prevention and treatment of delayed-onset muscle soreness. J Athl Train. 2011;46(1):43-49. [DOI] [PMC free article] [PubMed] [Google Scholar]
- 44. Bosco C, Colli R, Introini E et al. . Adaptive responses of human skeletal muscle to vibration exposure. Clin Physiol. 1999;19(2):183-187. [DOI] [PubMed] [Google Scholar]
- 45. Kisner C, Colby LA. Resistance Exercise for Impaired Muscle Performance. In: Therapeutic Exercise: Foundations and Techniques. 6th ed Philadelphia: F.A. Davis Company; 2012:160-161. [Google Scholar]
- 46. Seynnes OR, de Boer M, Narici MV. Early skeletal muscle hypertrophy and architectural changes in response to high-intensity resistance training. J Appl Physiol (1985). 2007;102(1):368-373. [DOI] [PubMed] [Google Scholar]
- 47. Aagaard P, Simonsen EB, Andersen JL, Magnusson P, Dyhre-Poulsen P. Increased rate of force development and neural drive of human skeletal muscle following resistance training. J Appl Physiol (1985). 2002;93(4):1318-1326. [DOI] [PubMed] [Google Scholar]
- 48. Mujika I, Padilla S. Muscular characteristics of detraining in humans. Med Sci Sports Exerc. 2001;33(8):1297-1303. [DOI] [PubMed] [Google Scholar]
- 49. Andersen LL, Andersen JL, Magnusson SP, Aagaard P Neuromuscular adaptations to detraining following resistance training in previously untrained subjects. Eur J Appl Physiol. 2005;93(6):511-518. [DOI] [PubMed] [Google Scholar]
Associated Data
This section collects any data citations, data availability statements, or supplementary materials included in this article.


