

Abstract
Variation in regulatory DNA is thought to drive phenotypic variation, evolution, and disease. Prior studies of regulatory DNA and transcription factors across animal species highlighted a fundamental conundrum: Transcription factor binding domains and cognate binding sites are conserved, while regulatory DNA sequences are not. It remains unclear how conserved transcription factors and dynamic regulatory sites produce conserved expression patterns across species. Here, we explore regulatory DNA variation and its functional consequences within Arabidopsis thaliana, using chromatin accessibility to delineate regulatory DNA genome-wide. Unlike in previous cross-species comparisons, the positional homology of regulatory DNA is maintained among A. thaliana ecotypes and less nucleotide divergence has occurred. Of the ∼50,000 regulatory sites in A. thaliana, we found that 15% varied in accessibility among ecotypes. Some of these accessibility differences were associated with extensive, previously unannotated sequence variation, encompassing many deletions and ancient hypervariable alleles. Unexpectedly, for the majority of such regulatory sites, nearby gene expression was unaffected. Nevertheless, regulatory sites with high levels of sequence variation and differential chromatin accessibility were the most likely to be associated with differential gene expression. Finally, and most surprising, we found that the vast majority of differentially accessible sites show no underlying sequence variation. We argue that these surprising results highlight the necessity to consider higher-order regulatory context in evaluating regulatory variation and predicting its phenotypic consequences.
Keywords: regulatory DNA, chromatin accessibility, intraspecies sequence variation
Introduction
Changes in gene regulation are thought to be important drivers of phenotypic variation, evolution, and disease. This was first postulated over 50 years ago, when it was reasoned that phenotypic variation among organisms “are the result of changes in the patterns of timing and rate of activity of structural genes rather than of changes in functional properties of the polypeptides as a result of changes in amino acid sequence” (Zuckerkandl and Pauling 1965). Similar conclusions were drawn based on diverse evidence, including the presence of different RNAs in different cell types (Britten and Davidson 1969), the discrepancy between genome size and gene number (Ohno 1972), the discrepancy between high mutation rate and phenotypic robustness (Muller 1966; Crow and Kimura 1970), and the striking similarity of human and chimpanzee proteins (King and Wilson 1975).
Tools to examine transcriptional regulation have advanced dramatically in the decades since the importance of regulation was first realized. It was discovered that transcribed regions of chromatin are sensitive to endonuclease cleavage (Gottesfeld et al. 1975; Weintraub and Groudine 1976; Wu et al. 1979; Keene et al. 1981; Feng and Villeponteau 1992), that regions up-and downstream of actively transcribed gene bodies were hypersensitive to endonuclease cleavage (Elgin 1981), and that these hypersensitive sites demarcated cis-regulatory DNA were often bound by transcription factors (TFs) rather than directly reflecting transcriptional activity (Gross and Garrard 1988). With the advent of high-throughput sequencing, endonuclease hypersensitivity and other genome-scale methods have been used to delineate regulatory DNA in hundreds of human cell types and tissues, plants, fungi, and animals (Sabo et al. 2004; Hesselberth et al. 2009; Furey 2012; Buenrostro et al. 2013; Sullivan et al. 2014; Villar et al. 2015; Weber et al. 2016).
These methods have allowed comparisons of regulatory DNA across species on a genome-wide scale. As predicted five decades ago, regulatory DNA generally appears to be under very weak purifying selection—similar to that of four-fold synonymous sites (Stern and Frankel 2013; Vierstra et al. 2014). However, mutation of even a single base pair within a TF-binding site can suffice to disrupt regulation of its target gene (Hattori et al. 2002; Liu et al. 2014; Vierstra et al. 2015). Thus, unlike coding regions where the signature of purifying selection predicts gene structure with considerable success, simple conservation metrics largely fail to predict the base pair-level anatomy of regulatory regions.
Cross-species analyses have revealed that positional conservation of regulatory DNA decays with evolutionary distance, and that, within positionally conserved regulatory sequences, TF-binding sites turn over rapidly (Ludwig et al. 2000; Kim et al. 2009; Shibata et al. 2012; Vierstra et al. 2014; Villar et al. 2015). To make progress towards a base pair-level functional understanding of regulatory regions, we compared the regulatory regions among less diverged genomes, in which most of their positional homology is maintained and less nucleotide divergence has occurred. The Arabidopsis thaliana species offers an excellent set of such genomes: it consists of hundreds of ecotypes that are predominantly self-fertilizing and largely homozygous (Bomblies et al. 2010), with a within-species pairwise divergence similar to the between-species divergence of human and chimpanzee (1001 Genomes Consortium 2016), but with enough outcrossing among ecotypes to avoid the effects of Muller’s ratchet (Felsenstein 1974). Linkage disequilibrium decays at a rate similar to that of African humans (Kim et al. 2007). Thus, by profiling only a small sample of A. thaliana ecotypes, we can capture much of the common within-species variation in regulatory loci and, at the same time, sample many replicate alleles.
Here, we use DNase I-seq (and some ATAC-seq) to map hypersensitive sites (DHSs) for each of five geographically and genetically diverse ecotypes of A. thaliana. We compared 1) chromatin accessibility (DHSs) as an indicator of TF-binding, 2) sequence variation, and 3) expression levels of nearby genes. Among these ecotypes, we find that 15% of the ∼50,000 DHSs were differentially accessible. Surprisingly, only a small minority of these differential DHSs were due to underlying sequence variation, putting into question how often variation in regulatory DNA drives phenotypic variation. At the same time, we find instances of dramatic sequence variation in regulatory regions with little or no effect on chromatin accessibility and gene expression. Although chromatin accessibility change per se is a poor predictor of gene expression changes in nearby genes (Gross and Garrard 1988; Song et al. 2011; Shu et al. 2011; Wang et al. 2012; Sullivan et al. 2015; Blatti et al. 2015), combining changes in chromatin accessibility and underlying DNA sequence variation improved predictions. Taken together, our results illustrate the challenges inherent in understanding regulatory variation and its relationship to phenotypic divergence even in a well-studied model species.
Results
Identification of Regulatory DNA across Five Divergent Ecotypes
For each of five divergent A. thaliana ecotypes (fig. 1A), we created INTACT lines in which nuclei from all cell types expressing the UBQ10 promoter are biotin-tagged to enable capture with streptavidin beads (Deal and Henikoff 2010; Sullivan et al. 2014). Nuclei from 7-day-old whole seedlings were isolated from each ecotype and treated as described (see Materials and Methods) to generate DNase I-seq data. DNase I reads of all ecotypes were aligned to the Col-0 reference genome because the quality of the nonreference genome assemblies was variable. DHSs were called as described (Sullivan et al. 2014) (fig. 1). We and others have found chromatin accessibility profiles to be highly reproducible (Sabo et al. 2006; Sullivan et al. 2014, 2015). Nevertheless, we obtained replicates for two accessions (Col-0, Bur-0), using an alternative method to assess chromatin accessibility, ATAC-seq (Assay for Transposase-Accessible Chromatin using sequencing). As expected, DHSs were highly reproducible across methods (supplementary fig. S1, Supplementary Material online).
Fig. 1.
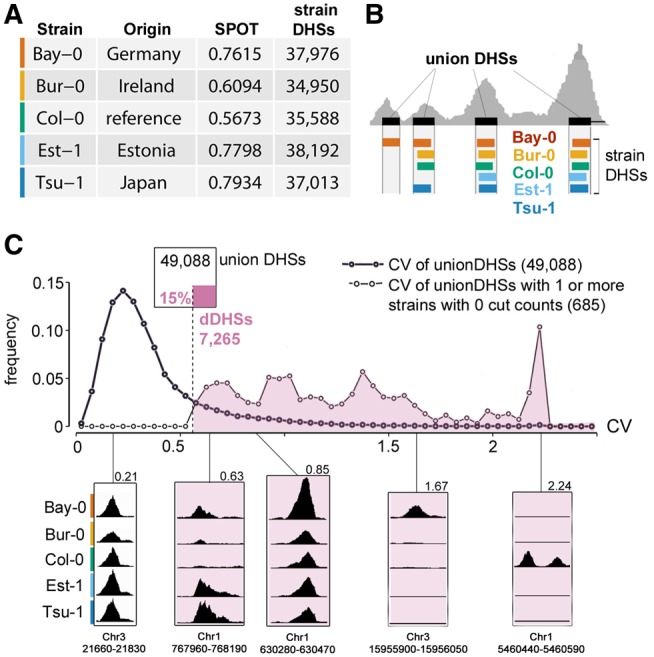
Identifying regions of differential chromatin accessibility among five A. thaliana ecotypes. (A) Data and data quality for the five ecotypes examined. SPOT score, a metric of data quality, describes fraction of cuts within hotspots (Sullivan et al. 2015). Colors indicate specific ecotypes throughout manuscript (palette is colorblind-accessible [Wong 2011]; Bay-0, vermillion; Bur-0, orange; Col-0, bluish green; Est-1, sky blue; Tsu-1, blue). (B) Schematic depiction of deriving uDHSs for subsequent analysis. (C) Distribution of CV among uDHSs (bold line). Distribution of CV among the subset of uDHSs for which at least one ecotype has no cut counts (lighter line). A CV threshold of 0.56 (dashed line) was chosen to include all uDHSs in the latter category. This approach categorized 15% of all uDHSs as differentially accessible (see inset diagram, dDHSs in reddish-purple). See supplementary figure S2, Supplementary Material online, for further details on the rationale for CV as a metric for identifying dDHSs. Examples of individual uDHSs with respective chromosome coordinates and CVs are shown below CV distribution.
We merged DHSs from the five ecotypes to generate a union set of 49,088 DHSs (fig. 1B, supplementary table S1, Supplementary Material online). Most union DHSs were shared among the five ecotypes, providing yet another means of replication; only 8,778 DHSs were private, that is, called in only one ecotype. Private DHSs tended to show comparatively low nuclease cut counts, on the edge of our detection criteria, and therefore were potentially enriched for false positives (supplementary fig. S2A and 2B, Supplementary Material online). For that reason, rather than calling DHS presence or absence across ecotypes, we compared DNase I cut counts within uDHSs to identify differential DHSs among ecotypes. Specifically, because DNase I cut count standard deviation (σ) and mean (µ) showed an approximately linear relationship across the five ecotypes (supplementary fig. S2C, Supplementary Material online), we used a coefficient of variation (CV, σ/µ) threshold to define 7,265 DHSs (15%) as differentially accessible DHSs (differential DHSs, dDHSs, fig. 1C, see Materials and Methods, supplementary table S2, Supplementary Material online).
Structural Variation Contributes Substantially to Differential DHSs among Tested Ecotypes
Differential DHSs among the tested ecotypes can arise in three ways: through 1) ecotype-specific deletions of the sequence underlying a DHS, 2) ecotype-specific variation in the sequence underlying a DHS that affects TF-binding (both cis-effects), and 3) ecotype-specific variation in levels, activity, or DNA-binding preference of TFs (trans-effects). We started by exploring the relative contribution of ecotype-specific deletions to the observed differential DHSs because prior studies estimated that at least ∼4% of any A. thaliana ecotype genome is absent in another ecotype (Clark et al. 2007; Plantegenet et al. 2009). We reasoned that compared with coding DNA, regulatory DNA may be disproportionately affected because it is accessible and less constrained by selection. If this were the case, our method of aligning reads to the Col-0 reference genome, which detects deletions in the other ecotypes but not in Col-0, should yield a set of differential DHSs enriched for loci that are most accessible in Col-0.
Indeed, a majority (62%) of the 7,265 differential DHSs (n = 4,508) were most accessible in the reference ecotype Col-0 (dDHSs-C) (fig. 2A). The remaining differential DHSs (n = 2,757) were most accessible in each of the other four ecotypes at approximately equal numbers (see fig. 2A, inset). Accessibility of differential DHSs tended to show a bimodal distribution (supplementary fig. S2D, Supplementary Material online), and for the differential DHSs in which only one ecotype displayed considerably different cut counts (74%, 3,775 of 5,131 dDHSs), the outlier ecotype was Col-0 with highest accessibility.
Fig. 2.

Structural variation contributes to profound reference bias and explains a sizable minority of differential DHSs. (A) DNase I-cut counts for each of 7,265 dDHS across all five ecotypes (color-coded dots, see inset) are shown. dDHSs are displayed hierarchically clustered with each column representing a given DHS. dDHSs in which the reference Col-0 (green) shows more cut counts than any of the other ecotypes (dDHSs-C) are most common. (B) The reference bias in (A) arises through use of the Col-0 reference genome for DNase I read alignment. Two different reference genomes, Col-0 (green, top) and Bay-0 (vermillion, bottom), were compared for alignment at different stringencies. Replacing the Col-0 reference genome with the Bay-0 draft genome for read alignments, resulted in a Bay-0 specific bias, that is, now the majority of dDHSs was most accessible in Bay-0. The 1000 dDHSs with the highest CV were used for analysis. Requiring perfect alignment (no mismatches) between DNase I read and reference genome enhanced this effect, while relaxing alignment parameters dampened this effect in the Sanger-sequenced Col-0 genome. (see Materials and Methods for details). (C) Schematic outlining the consequences of missing sequence in Col-0, the reference ecotype, versus missing sequence in a nonCol-0 ecotype for bias in calling dDHSs. In our analysis, DNase I reads from each ecotype were aligned to the Col-0 reference sequence (depicted by green horizontal bar). If a Col-0 sequence corresponding to a DHS was missing in Bay-0, this DHS would appear inaccessible in Bay-0 and called as a dDHS-C (i.e., most accessible in Col-0). However if a Bay-0 sequence corresponding to a DHS was missing in Col-0, the DHS would not be included in the uDHS set and not be counted as a dDHS-NC (i.e., most accessible in a nonCol-0 ecotype). (D) Overlap between WGS-called deletions, uDHSs and dDHSs shows that differential DHSs are enriched for ecotype-specific deletions; areas are proportional to the size of each category. (E) Size distribution of WGS sequence-called deletions in each ecotype was similar, with few deletions over 20 kb. Pie charts indicate the fraction of uDHSs overlapping ecotype-specific WGS-called deletions of various minimum sizes that were characterized as differential DHSs (see adjacent key). For comparison, see the fraction of uDHSs overlapping Bay-0 deletions of various minimum sizes called by WGA (whole-genome alignment) of the Bay-0 draft genome to the Col-0 reference genome (see Materials and Methods).
We obtained a de novo Bay-0 genome assembly to test whether its use as a reference genome would yield differential DHSs enriched for loci most accessible in Bay-0. This was the case (fig. 2B and C). To explore sequence divergence at the base pair level, we used three different alignment stringencies, aligning to both the Col-0 and Bay-0 reference genomes. Consistent with the effects of sequence divergence, the reference genome bias was exaggerated when we required perfect alignment between sequence read and reference genome; conversely, the reference genome bias was diminished when the alignment requirements were relaxed (fig. 2B). The reference genome bias was not diminished with relaxed alignment to the Bay-0 genome, presumably because it is not of the same quality as the Col-0 reference genome (fig. 2B). In summary, our analysis demonstrates that there is no excess of differential DHSs that are most accessible in Col-0; rather, due to missing Col-0 deletions by using the Col-0 genome for alignment, we undercount differential DHSs that are accessible in the other ecotypes (false negatives).
In the absence of comparable genome assemblies for the other ecotypes, we used whole-genome shotgun (WGS) read coverage to predict putative deletions of 300 bp or greater in each ecotype with respect to the Col-0 genome (fig. 2E, see Materials and Methods, 1001 Genomes Consortium 2016, supplementary tables S3–S6, Supplementary Material online) to determine the fraction of differential DHSs overlapping predicted deletions. We also conducted this analysis for the Bay-0 short-read data and the novel Bay-0 assembly (fig. 2E). The size distribution of predicted deletions among ecotypes was similar, with some deletions extending over 40 kb. In total, of the 49,088 uDHSs, 1,516 DHSs (3%) overlapped with a predicted deletion by at least one bp; of the 7,265 differential DHSs, 1,144 DHSs (16%) overlapped with a predicted deletion (fig. 2D). However, the overlap of predicted ecotype-specific deletions with ecotype-specific differential DHSs was imperfect (fig. 2E), due to imprecision of deletion and/or differential DHS breakpoints. We assessed the accuracy of our deletion predictions by comparing our results to two independent data sets: the Bay-0 comparative genomic hybridization (CGH) array data (Plantegenet et al. 2009) and the novel Bay-0 genome assembly. We found strong correspondence of our predicted deletions with both data sets (supplementary fig. S4, Supplementary Material online). Moreover, deletions called by whole genome alignment (WGA-called deletions; see Materials and Methods) behaved like deletions called by read coverage for Bay-0 WGS data (fig. 2E).
Having established structural variation as a substantial contribution to differential DHSs, we explored whether they differed in genomic or biological features from uDHSs from which they are drawn. When compared with uDHSs, differential DHSs were more likely to reside in coding regions and less likely to reside in intergenic regions. This effect is largely driven by the differential DHSs that are most accessible in Col-0 (supplementary fig. S3A, Supplementary Material online, dDHSs-C), many of which reflect absence of sequence in one or more ecotype, rather than differential accessibility of sequence that is present in both. Because sequence variation is implicated in generating accessibility difference, we compared recombination rates within uDHSs, differential DHSs, and comparable regions outside of DHSs. Using recombination events imputed from the mosaic genomes of the MAGIC lines (Kover et al. 2009), a higher fraction of DHSs (2.1%) overlapped with a recombination event compared with same-length control regions (DHS coordinates shifted 5 and 10 kb) (1.7%, P < 10−9), consistent with recombination favoring accessible regions in plants (Rodgers-Melnick et al. 2016). Focusing on recurrent recombination events, 9% of differential DHSs overlapped with recombination events in multiple lines compared with only 3.8% of uDHSs. Comparing gene annotations for genes residing either near union or differential DHSs, we found that the latter were enriched for annotations related to programmed cell death (supplementary fig. S3B and C, Supplementary Material online).
The features of differential DHSs (location, elevated recombination rate, proximity to defense- and cell death-related genes, and increased methylation) are consistent with prior work on defense-related genes, recombination, and regulatory sequence variation (Gan et al. 2011; Choi et al. 2016) and our observation that a substantial fraction of differential DHSs is due to the absence of DHS sequence (a local deletion) in one or more ecotype.
Sanger-Sequencing of Wrongly Predicted Deletions Reveals Hypervariable DHS Sequences
To directly assess the accuracy of our predictions, we PCR-amplified regions corresponding to ten WGS-called deleted DHSs that reside near well-annotated genes. Of these ten regions, seven were indeed deleted (fig. 3A, supplementary table S7, Supplementary Material online). For the remaining three, Sanger-sequencing revealed that ecotypes predicted to have deletions carry instead a homozygous DHS allele with dramatically different sequence but of approximately equal length as the Col-0 DHS allele (fig. 3B). We Sanger-sequenced eight additional ecotypes and found that each ecotype was homozygous for one of the two previously identified alleles, consistent with a single mutation event creating the vast majority of the nucleotide differences in each of these regions (fig. 3B, supplementary fig. S5, Supplementary Material online).
Fig. 3.

Hypervariable sequence coinciding with DHSs poses a challenge for sequence alignment but does not significantly contribute to reference bias. (A) PCR confirmed seven out of ten predicted deletions in at least one ecotype through decreased size or absence of diagnostic PCR product. Predicted deletions are denoted as red X. In some instances, ecotypes carried a deletion that was not predicted (black box, DHS9 in Bur-0 and Tsu-1, false negatives). (B) For the three wrongly predicted deletions coinciding with DHS1, DHS3, and DHS5, Sanger-sequenced PCR-products from 12 A. thaliana ecotypes revealed that ecotypes carried either a homozygous Col-like sequence allele or a homozygous nonCol-like allele with dramatically different sequence but approximately equal length. Alignments are represented as thumbnails, Col-like sequence in gray and mismatches to Col-0 in black. Col-0 coordinates for these three hypervariable loci are Chr1: 5,673,357–5,674,171; Chr1: 28,422,395–28,423,622; and Chr2: 15,890,369–15,891,184, respectively. For DHS1, the base pair resolution multiple sequence alignment is shown. For full base pair resolution multiple alignments of DHS1, DHS3 and DHS5, see supplementary figure S5A–C, Supplementary Material online. (C) Scatterplot of Bur-0 DNase I reads aligned to either patched or unpatched Col-0 sequence. The patched Col-0 genome was generated by replacing DHS-sequences with locally-assembled sequence from Bur-0 WGS reads (see Materials and Methods). Dotted lines indicate 2-fold higher cut counts for respective DHSs with either patched or unpatched genome. The majority of DHSs was not affected (orange cloud). At right, an example of false positive differential DHS for which patching resulted in higher numbers of aligned DNase I reads such that “patched” cut count approximated that of the Col-0 DHS. The similarity of DHS pattern between Bur-0, Bay-0 and Tsu-1 suggests that the differential DHS in the two latter ecotypes is also a false positive due to sequence hypervariability.
We refer to DHSs with two highly disparate alleles as hypervariable DHSs (hypDHSs). The existence of hypDHSs suggested that, in addition to undercounting differential DHSs most accessible in nonCol ecotypes (due to the absence of DHS sequences in Col-0), we may be overcounting differential DHS most accessible in Col-0. Neither read-coverage-based detection of deletions nor CGH data can distinguish between true deletions and sequence regions that are diverged to the point of precluding alignment of short reads.
Therefore, we explored the extent of DHS hypervariability by Sanger-sequencing ten additional DHSs with very high CV across the five ecotypes. We found elevated sequence diversity in all ten sequence regions compared with the genome-wide background; the mean number of substitutions, deletions, and insertions (SDIs) was 14.3 across the 150 bp DHS regions. The immediate area surrounding these DHSs (∼800 bp total, including DHS) also showed elevated sequence diversity (supplementary table S8, Supplementary Material online).
Next, we aimed to recover the true sequence of all differential DHSs that were most accessible in Col-0 to determine to which extent hypervariability affected our analysis. We used PHRAP (Phil Green, personal communication) to perform local de novo assemblies of the Bur-0 DHS allele for each of the 4,508 differential DHS most accessible in Col-0, using 1) a Col-0 backbone sequence with per-bp quality set to zero, and 2) all pairs of WGS reads in which at least one read mapped to that DHS region, that is, using one of the paired reads to anchor the other, even if the sequence difference from the Col-0 allele prohibited alignment (see Materials and Methods). We tested this strategy by comparing our local assemblies to the Bur-0 Sanger sequence for the ten DHSs, in addition to available Bur-0 genome sequence (Gan et al. 2011). Comparing patched sequence to respective Sanger-sequence, across the ten DHSs, 83% of SDIs were corrected (120/143); for six DHS, sequences were completely corrected. Eleven of the 23 uncorrected SDIs were indels. Comparing the published Bur-0 assembly to the respective Bur-0 Sanger sequences, only seven of the 143 SDIs were missed, all of which were substitutions clustered within a single DHS (supplementary table S8, Supplementary Material online).
As patching proved effective, we patched the Col-0 genome with the de novo derived Bur-0-like sequences, maintaining genome coordinates, and then re-aligned the Bur-0 DNase I reads. For 122 of the 4,508 differential DHSs-C, we aligned more than twice as many Bur-0 DNase I reads to the patched Col-0 genome compared with the reference Col-0 genome (fig. 3C). However, perhaps surprisingly, the majority of previously called differential DHSs-C loci remained most accessible in Col-0. Moreover, when we recalculated CV across all ecotypes using the newly patched genome for Bur-0, only 100 DHSs out of 4,508 differential DHSs-C fell below the differential DHSs threshold (fig. 1C), with most (84/100) close to the threshold (fig. 1C). In summary, the observed excess of differential DHSs most accessible in Col-0 was largely due to undercounting in other ecotypes (false negatives), and not to poor alignment of ecotype-specific DNase I reads to the Col-0 reference genome (false positives).
Hypervariable Differential DHSs Tend to Reside Near Differentially Expressed Genes
The DHS landscape for a given genotype is largely static, with only 5–10% of DHSs changing in accessibility in pairwise comparisons of conditions (Sullivan et al. 2014) or development stages (Sullivan et al. in review) in spite of widespread changes in gene expression. Static DHS presence is generally not a good predictor of nearby gene expression for multiple reasons; for example, accessibility can be caused not only by activators but also by repressors, and DHS assignment to nearby genes is an oversimplification. However, dynamic DHSs with differential accessibility in response to abiotic treatments more frequently correlates with expression changes in nearby genes (Sullivan et al. 2014, 2015). Here, we compare chromatin accessibility and gene expression for seedlings that have been grown under standard growth conditions, in the absence of such treatments, making it possibly less likely to observe correlations between accessibility and gene expression.
Across genotypes, we had to consider the additional complexity of ecotype-specific sequence variation underlying DHSs. Thus, we explored the relationship of high sequence variation with both DNase I accessibility and expression of nearby genes. As previously observed (Plantegenet et al. 2009), deleted regulatory regions often reside near deleted genes, providing a trivial reason—namely, gene absence—for differential gene expression unrelated to the evolution of regulatory DNA. Therefore, to select for deleted DHSs near nondeleted genes, we used a set of smaller predicted deletions, generated by merging only overlapping 150 bp windows of low WGS coverage and retaining all predicted deletion windows, not only those >300 bp as before (supplementary table S9, Supplementary Material online). Of these smaller predicted deletions (≥150 bp), 308 overlapped with a uDHS but not a gene. Comparable, high-quality expression data were publicly available for Bur-0 and Col-0 ecotypes (Gan et al. 2011); hence, we considered these ecotypes for further analysis. We applied DESeq (Anders and Huber 2010) to these data (Gan et al. 2011) and identified 737 protein-coding genes with differential expression between Bur-0 and Col-0.
We then determined for Col-0 and Bur-0 the proximity of the various DHS sets (Bur-0/Col-0 uDHSs [uDHSs]; Bur-0/Col-0 differential DHSs, dDHSs; deleted DHSs, delDHSs, hypDHSs) to the nearest differentially expressed gene (supplementary table S14, Supplementary Material online), assessing DHSs residing upstream and downstream of transcription start sites. Only a small fraction of Bur-0/Col-0 uDHSs (supplementary table S10, Supplementary Material online) resided near differentially expressed genes (fig. 4A; for specific examples see fig. 5A, top). As expected, this fraction increased, albeit only modestly, when differentially accessible DHSs (supplementary table S11, Supplementary Material online) were considered. HypDHSs (supplementary table S12, Supplementary Material online) were more likely than dDHSs to reside near differentially expressed genes, regardless of whether they differed in accessibility. However, hypDHSs with altered accessibility (supplementary table S13, Supplementary Material online) predicted expression changes in nearby genes almost as well as delDHSs. Taking into account DHSs residing downstream of transcription start sites, delDHSs predicted expression changes for ∼25% of nearby genes.
Fig. 4.

DHSs alleles with high sequence divergence tend to reside near genes with different expression levels. (A) Fraction of DHSs residing within 5 kb of a differentially expressed gene by DHS sets in a pairwise comparison of Col-0 and Bur-0 (deleted DHSs = del DHSs; hypervariable differentially accessible DHSs = hyp/d DHSs; hypervariable nondifferentially accessible DHSs = hyp/nd DHSs; differentially accessible DHSs = d DHSs; Col-0/Bur-0 uDHSs = uCB DHSs). DHSs were subsampled to sets of 50 to allow comparisons among the examined DHSs sets, which occurred at vastly different frequency (see Materials and Methods). (B) For the three previously-identified hypDHSs (DHS1, DHS3, and DHS5, see fig. 3A and B), the DHS-allele (Col-like C-allele in green, nonCol-like NC-allele in black) determined by Sanger-sequencing predicted the expression level of a neighboring gene in eleven ecotypes with publicly available expression data (Lempe et al. 2005) with one exception (Ms-0 in DHS5, red dot). At left, screenshots showing altered DHS accessibility at these sites (see also fig. 3B); at right, gene expression (as log2(intensity ratio), Lempe et al. 2005) for ecotypes carrying either the DHS C-allele (green) or the DHS NC-allele (black). For DHS1 (At1G116590), we also show expression for Bur-0 (orange) compared with Col-0 (green) from Gan et al. (2011).
Fig. 5.

Altered DHS accessibility among ecotypes may have condition-dependent effects on expression of nearby genes. (A, Top) A DHS deletion (black box) in Bur-0 neighbors one gene with similar expression in Bur-0 (orange) and Col-0 (green, expressed in FPKM) (Gan et al. 2011) and one gene with vastly different expressions in Bur-0 and Col-0 (blue shading). (A, Bottom) A DHS deletion in Bur-0 (denoted as above) neighbors two genes with similar expression levels in Bur-0 and Col-0. (B) On average, genes with differential expression in response to heat-shock, dark-to-light transition, brassinosteroid treatment of dark-grown seedlings, and auxin treatment are flanked by significantly more DHSs than all genes (e.g., on average, ∼3 DHSs reside 5 kb upstream of a gene). P values of t-tests comparing (1) mean number of DHSs in specified region for genes with differing expression at test versus control conditions to (2) mean number of DHSs for genes with similar expression at both conditions (a) (5 kb upstream; 1.5 kb downstream), (b) (<2.2e-16; 3.6e-13), (c) (<2.2e-16; <2.2e-16), (d) (<2.2e-16; <2.2e-16), (e) (2.7e-10; 1.6e-09. (C, Left) Gel images confirming DHS deletions near genes annotated as conditionally-expressed. The first example represents an insertion in Bur-0 rather than a deletion. (C, Right) Evidence of ecotype-specific conditional expression (highlighted in blue are the largest significant differences measured, with effect size indicated in bold and P-value of difference [paired t-test] in italics) associated with a DHS deletion or insertion near AT1G50460, AT2G16280, and AT5G54470. cDNA preparations of Bur-0/Col-0 pairs with substantially higher levels of gene expression, presumably due to some batch effect, are given as filled circles. (D, Top Left) DNase I screenshot for the region containing AT5G54470 in Col-0 and Bur-0. (D, Top Right) Schematic alignment of the 2,138-bp region upstream of AT5G54470 (Chr5: 22,115,538–22,117,675). Boxes denote DHSs. (D, Bottom) Base pair alignment of a 348-bp window (Chr5: 22,115,738–22,116,085) containing the second and most accessible DHS upstream of AT5G54470. TF binding motifs are underlined in blue and indels and/or mismatches between Col-0 and Bur-0 (bold letters) are indicated. Various combinations of these motifs are required for response to cold (Mikkelsen and Thomashow 2009). PhastCons scores were taken from (Zheng et al. 2010; Li et al. 2012).
We used total mRNA levels in these analyses; however nascent RNA levels may have yielded a stronger relationship between differential accessibility and expression. We explored this possibility using two other metrics associated with transcription: nuclear mRNAs which may reflect nascent RNAs more closely, and Pol II occupancy (supplementary fig S6, Supplementary Material online). We stratified genes into nine quantiles (from lowest to highest, 1–9) for total mRNA levels, nuclear mRNA and Pol II occupancy, and determined their chromatin accessibility upstream and downstream. For all three measures accessibility was highest upstream of highly expressed (or highly occupied) genes and decreased monotonically with quantile. We conclude that our findings are not affected by the use of different measures of gene expression.
In summary, neither sequence variation nor accessibility variation were good predictors of expression changes in nearby genes; however, combining this information allowed far better predictions than relying on either factor alone (fig. 4A and B). For example, for the three original hypDHSs—originally mistaken for deletions—we found that, for each locus, allele type corresponded to expression level of nearby gene for 11 ecotypes with publicly available expression data (Lempe et al. 2005; Gan et al. 2011) (fig. 4B).
These three hypDHSs reside near well-annotated genes, offering the opportunity to examine whether differential hypDHS alleles are associated with phenotypic variation in addition to expression variation. We focused on the hypDHS upstream of REV7/AT1G16590, a gene associated with UV-tolerance in different organisms (Broomfield et al. 2001). Arabidopsis thaliana rev7 mutants show moderately increased sensitivity to prolonged UV exposures (Takahashi et al. 2005). REV7 is expressed at lower levels in Col-0 than Bur-0 and other ecotypes containing the nonCol-like allele (fig. 4B, top); however, Col-0 and Bur-0 differed only subtly in their growth response to UV exposure (supplementary fig. S7, Supplementary Material online).
Differential DHSs May Be Conditionally Important
Differential DHSs are thought to be most informative for understanding the regulatory dynamics underlying specific conditional responses and developmental trajectories. However, for a single expression data set from 11-day-old seedlings grown in long days (LDs) (Gan et al. 2011), only 25% of delDHSs resided near differentially expressed genes (e.g., fig. 5A, top, fig. 4A). We reasoned that some of the remaining 75% of delDHSs (e.g., fig. 5A, bottom, fig. 4A) may matter for expression under different conditions because accessibility, especially at conditional regulatory sites, often reflects a poised state with bound but not fully activated TFs (Gross and Garrard 1988; Zentner et al. 2011; Nelson and Wardle 2013).
We noted that genes implicated in response to various treatments (cold, growth in the dark, pathogen response) often resided near small deletions affecting one of multiple adjacent DHSs. This observation is consistent with the fact that conditional genes often receive inputs from several pathways, involving multiple TFs causing several DHSs to arise. The presence of multiple DHSs under standard conditions is consistent with poised TFs bound to DNA. Therefore, we systematically examined whether genes that are conditionally expressed in Col-0 tend to reside near multiple DHSs (see Materials and Methods). Indeed, conditionally expressed genes showed significantly more DHSs both 5 kb upstream of their transcription start site and 1.5 kb downstream of their transcription termination site (fig. 5B, supplementary tables S15–S18, Supplementary Material online).
To address whether some of these DHSs mattered for gene expression under nonstandard growth conditions, we selected differential DHSs predicted to be deleted, the most extreme form of sequence divergence, and for which expression of both neighboring genes was the same in Col-0 and Bur-0 in standard growth conditions (Gan et al. 2011). We identified ten such DHSs near genes with prior evidence for conditional expression in cold and/or growth in the dark, but similar expression levels in Bur-0 and Col-0 under standard growth conditions (Gan et al. 2011) (supplementary table S19, Supplementary Material online). These ten genes showed elevated numbers of DHSs up- and/or downstream (supplementary fig S8A, Supplementary Material online). We PCR-confirmed the predicted DHSs deletions; in nine instances a deletion resided in Bur-0, and in one case DHS sequence was absent in Col-0 (fig. 5C). We then examined whether any of these ten genes differed in expression between Bur-0 and Col-0 in response to test conditions (see Materials and Methods, fig. 5C, supplementary fig. S8, Supplementary Material online). We found that all ten genes tested had significantly different levels of expression between Bur-0 and Col-0 in at least one test condition. Analysis of additional in-house qPCR biological replicates; however, indicated that five of the ten genes showed small but significant differences in expression between Bur-0 and Col-0 even in standard conditions (fig. 5C, supplementary fig. S8, Supplementary Material online). The three genes with significant conditional expression differences of largest effect size were AT5G54470, AT2G16280, and AT1G50460 (fig. 5C). For example, AT5G54470, known to be induced by cold (Mikkelsen and Thomashow 2009), showed a significantly greater increase in expression in cold-treated light-grown seedlings in Col-0 than in Bur-0 (fig. 5C, supplementary fig. S7, Supplementary Material online). Almost all cold-responsive motifs (Mikkelsen and Thomashow 2009) are contained within the most accessible DHS in the AT5G54470 regulatory region (fig. 5D, supplementary fig. S8, Supplementary Material online). Several of these motifs (EEL, EE, CBS, and ABRE) reside within a region that is not conserved across plant species; in contrast, motifs that do not affect cold-responsive expression (G-box and ABRE/HY5) reside in a more conserved region (Zheng et al. 2010; Li et al. 2012). To explore possible sequence differences between Bur-0 and Col-0 in the extended AT5G54470 regulatory region, we Sanger-sequenced over 2 kb upstream of AT5G54470, which included four uDHSs and the predicted insertion (fig. 5D, supplementary fig. S8, Supplementary Material online). Within the most accessible DHS, we found five single base pair differences between Col-0 and Bur-0, one of which disrupted a cold-response motif. We also discovered an additional 152 bp insertion in Bur-0 between the second and third DHSs which affects spacing of regulatory motifs, as well as smaller insertions, deletions, and multiple single base pair changes (fig. 5D, supplementary fig. S8, Supplementary Material online). Previous large-scale genomics efforts failed to detect these sequence differences (Gan et al. 2011). Any one of these regulatory sequence variants or combinations thereof may cause the observed differences in conditional expression. For detailed information on the other loci with condition-specific effects see supplementary text, Supplementary Material online.
Most Differences in Accessibility Are Not Associated with Variation in Sequence or Epigenetic Marks
We found a surprisingly large proportion of differential DHSs with little ecotype-specific sequence variation. In the new Bay-0 assembly, 84% and 81% of union and differential DHSs not overlapping predicted deletions, respectively, carry two or fewer SDIs (fig. 6A). The mean SDI per DHS was higher in differential DHSs than uDHSs (2.5 compared with 1.8), but this difference was largely driven by outliers (fig. 6A). For over half of the differential DHSs (1,861/3,363), the underlying sequence was identical between the Col-0 reference genome and the de novo Bay-0 assembly genome.
Fig. 6.

Most differential DHSs are not explained by sequence divergence. (A) Total single nucleotide SDIs per DHS between Bay-0 and Col-0 were derived from whole genome alignment of the Bay-0 draft genome sequence and Col-0 reference genome sequence (see Materials and Methods). The majority of DHSs have zero SDI. Left, comparison between Bay-0 and Col-0, shades of gray, uDHSs; shades of red, differential DHSs; Right, comparison between Bur-0 and Col-0, shades of gray, uDHSs; shades of orange, differential DHSs (B) Histogram of Bay-0 insertion sizes over the entire genome (left), and excluding the centromere (right). (C) The fraction of DHSs of different types that contain at least one meC in the Col-0 genome (left) and Bur-0 genome (right). P-values for important comparisons (a and b) are displayed. (D) The fraction of base pairs within DHSs of different types in chromatin states (CS0-CS6), as defined by Wang et al. (2015). P-values for important comparisons (a–g) are displayed to the right. All P-values in (C) and (D) were calculated using a proportions test (prop.test).
Similarly, in the published Bur-0 sequence, 94% and 92% of union and differential DHSs not overlapping predicted deletions, respectively, carry two or fewer SDIs (fig. 6A). As with the Bay-0 genome, the higher mean SDI in Bur-0 dDHSs compared with uDHSs (3.4 vs. 1.2) was driven by high-SDI outliers (fig. 6A). We re-called single nucleotide variants (SNVs) and small insertions and deletions (indels) with more recent software packages (i.e., GATK 3.6 [McKenna et al. 2010] and freebayes 1.0.2 (Garrison and Marth 2012), generating an independent set of Bur-0/Col-0 sequence variants (see Materials and Methods). Using this new set of variants, 86 and 83% of union and differential DHSs, respectively, carry two or fewer sequence variants, similar to the numbers observed with the Bay-0 draft assembly genome.
We further examined whether dDHSs that appear identical in sequence between Bay-0 and Col-0 show differential accessibility because of undetected Bay-insertions, in particular transposon insertions. Using the Bay-0 draft assembly, we identified 2,026 regions, totaling 12,336,209 bp, which are not present in the Col-0 reference sequence (1,850 regions totaling 8,239,790 bp without centromeres) (fig. 6B, see Materials and Methods). Approximately a quarter of these base pairs are homologous to transposable elements (2,911,130 and 1,956,715 bp, respectively). We conclude that dDHSs without SDIs are unlikely to contain or overlap with undetected Bay-insertions. Given that this is at the upper end of what has been reported for other A. thaliana genome comparisons, we are confident that the vast majority of TE or other sequence insertions has been detected.
Further, we verified the sequence of eight loci encompassing differential DHSs predicted to contain two or fewer SDIs by Sanger-sequencing. In each case, the number of observed variants matched the number of predicted variants; no insertions were detected (supplementary table S20, Supplementary Material online). Taken together, our analyses suggest that the vast majority of differential DHSs indeed carry only few SDIs.
In the absence of genetic variation, variation in chromatin accessibility may arise from epigenetic marks. Therefore, we examined differences in epigenetic marks among uDHSs, differential DHSs with SDIs, differential DHSs without SDIs, and control regions (shift dDHSs). We first compared the amount of 5-methylcytosine between the Col-0 and Bur-0 methylomes (Kawakatsu et al. 2016) within each DHS category because differential DNA methylation can affect TF binding (O’Malley et al. 2016). In both the Col-0 and Bur-0 methylomes, differential DHSs without SDIs were far less likely to contain methylated cytosines (meCs) than control regions; however, they were somewhat more likely to contain meC than differential DHSs with SDIs (fig. 6C, a and b). The latter effect was stronger when tallying meCs for Bur-0, which is consistent with our observation that many Col-0/Bur-0 dDHSs show higher accessibility in Col-0. However, 83.5% of dDHSs without SDIs contained no meC in either the Bur-0 or Col-0 methylomes, strongly indicating that differential methylation does not explain accessibility differences for dDHSs without SDIs.
Next, we compared seven chromatin states (Wang, Liu, et al. 2015), defined by enrichment for different histone marks, for the same DHS categories to determine whether histone composition might be associated with differential chromatin accessibility. Chromatin states 3 and 6 represent classic, transcriptionally silent heterochromatin states; 1 and 5 are transcriptionally active euchromatin; 2 represents transcriptionally repressed euchromatin, 4 shows no enrichment for any marks whereas state 0 has no marks (Wang, Liu, et al. 2015). Differential DHSs without SDIs were less likely than dDHSs with SDIs to occupy regions without histone marks (CS0, fig. 6D, d) and regions without any particular histone mark enrichment (CS4, fig. 6D, e). They were more likely than dDHSs with SDIs to occupy regions enriched for histone marks associated with active transcription (CS5; fig. 6D, f) and regions representing transcriptionally repressed euchromatin (CS2; fig. 6D, g). This chromatin state is also associated with high topological connectivity with other genomic regions. However, these enrichments affected <15% of the base pairs underlying differential DHSs without SDIs; over 40% of base pairs in dDHSs without SDIs showed no histone mark enrichment. Thus, differential histone marks explain at best a minority of chromatin accessibility differences in the absence of genetic variation, which is consistent with a considerable role for trans factors. We do not mean to imply that the observed accessibility differences are caused by fast-evolving, polymorphic TFs; this interpretation is not supported by sequence information for Col-0 and Bur-0 TFs. Rather, we invoke differences in higher-order regulatory control, which results in differential accessibility in the absence of genetic variation at a particular site and in its TF. For example, differential accessibility in the absence of genetic variation may arise through reduced TF levels due to an upstream mutation. This interpretation is supported by the fact that dDHSs without SDIs are enriched for the chromatin state CS2, which is associated with topological connectivity.
Discussion
The current challenge in annotating regulatory regions is connecting specific base pairs with regulatory function. We and others have previously attempted to predict the function of regulatory regions by using TF binding motif content and footprint presence (Segal et al. 2008; Sullivan et al. 2014; Vierstra and Stamatoyannopoulos 2016). Although such approaches can have reasonable success when focused on a few very well known TFs and a well-understood biological process (such as patterning of the early Drosophila embryo), these approaches do have several limitations, including TF-binding site sequence specificity that differs depending on context (Slattery et al. 2011; Jolma et al. 2015), occupancy that is imperfectly gauged by most current footprinting algorithms, particularly those that do not control for nuclease bias and the particular binding tendencies of different TFs (Vierstra and Stamatoyannopoulos 2016), and TF bindings motifs, especially for large TF families, that can be highly similar. Here, we examined the effect of sequence variation within positionally and presumably functionally homologous regulatory sequence (DHSs) of closely related A. thaliana ecotypes to gain insight into regulatory sequence evolution.
As expected, we found that DHSs with changes in both sequence and accessibility across ecotypes are much more likely to reside near genes with different expression than DHSs without these changes. It is well-established that TF-mediated gene regulation is sequence-driven. In addition to the multitude of genetic studies of regulatory regions (Carroll 2008; Wittkopp and Kalay 2011), an elegant large-scale demonstration of this principle comes from a mouse model of Down syndrome in which the extra chromosome 21 copy is a human chromosome 21. The location of TF binding chromosome-wide was primarily determined by the cis-component (regulatory sequence) rather than the trans-component; that is, mouse TFs bound the human chromosome 21 in much the same pattern as the homologous human TFs would in a human cell (Coller and Kruglyak 2008; Wilson et al. 2008).
Perhaps more surprisingly, we found that gene regulation can be remarkably robust to sequence perturbations in DHSs; only a quarter of DHSs with changes in both sequence and accessibility resided near genes with altered expression. Furthermore, the majority (hundreds) of DHSs with high sequence variation displayed neither a change in accessibility nor in nearby gene expression. An obvious caveat, however, is our assumption that a given DHS represents the regulatory region for the closest nearby gene. While certainly not a perfect assumption, there is no obvious analytical alternative for assigning DHSs to target genes (Sullivan et al. 2015); moreover, extensive Drosophila studies suggest that regulatory elements most often target a neighboring gene or, if the regulatory element resides in an intron, the host gene (Kvon et al. 2014). This pattern is also frequently observed for regulatory element-target gene pairs in other organisms (Stern and Frankel 2013; Liu et al. 2014; Vierstra et al. 2015); even when a regulatory element resides very far away from its target gene, in most cases, there are no other genes residing in the intervening sequence (Stam et al. 2002; Clark et al. 2006; Guenther et al. 2014; Kvon et al. 2014).
Assuming correct target gene assignment for the majority of DHSs, the question remains how this regulatory robustness is generated in light of considerable underlying sequence variation. Careful dissections of individual regulatory regions and genome-scale studies implicate several mechanisms for regulatory robustness, including shadow enhancers, TF redundancy and motif redundancy, among others (Payne and Wagner 2015). Nevertheless, the amount of largely unannotated sequence variation in supposedly functional genomic regions among these closely related A. thaliana ecotypes was surprising and calls for future sequencing efforts with longer reads. In particular, we observed hypDHSs that were preserved in length among ecotypes, but highly disparate in sequence, showing either a Col-DHS allele or a nonCol-DHS allele. This observation is consistent with a single mutation event that generated the dramatic nucleotide differences between the allelic forms. DHSs that coincided with hypervariable sequence and changed in accessibility predicted expression changes in nearby genes almost as well as DHSs deletions.
Our assessment of the association between gene expression and DHS changes in sequence and accessibility is limited by the finite number of conditions in which expression data were collected (i.e., association between gene expression and DHS changes may be condition-specific). Accessibility frequently reflects binding of TFs poised for activation rather than actively driving gene expression in a particular condition (Keene et al. 1981; Sullivan et al. 2014). Deletion of a poised accessible site should not affect expression of a neighboring gene; however, expression of the neighboring gene would be affected in conditions in which the TF is driving its expression. Indeed, we discovered conditional effects of deleted DHSs for several genes, supporting the concept of poised TFs. Sequential cooperative binding of TFs, TF oligomerization, activating cofactors, or modifications are necessary to activate poised TFs and drive conditional gene expression (Slattery et al. 2014; Todeschini et al. 2014).
Finally, and perhaps most surprising, we found that the vast majority of DHSs that differ in accessibility across ecotypes show no underlying sequence variation, at least in the available short-read-derived draft genomes. At a first glance, this result suggests a considerable role of the trans-component (trans-acting factors that directly or indirectly regulate gene expression) in diversifying gene regulation and phenotype, seemingly challenging the paradigm that short-term evolution largely acts on regulatory regions rather than coding regions. The prevalence of regulatory over coding evolution over short evolutionary timescales is thought to arise from the reduced pleiotropy of regulatory changes, the phenotypic effects of which are often tissue-or condition-specific and hence less deleterious, as well as the largely additive effects of regulatory changes that increase the efficiency of selection (Wittkopp and Kalay 2011; Meiklejohn et al. 2014). At this point, the empirical evidence supporting this prediction is overwhelming (Carroll 2008; Wittkopp and Kalay 2011).
We speculate that our finding reflects network effects, as previously suggested (MacNeil et al. 2015; Fuxman Bass et al. 2016). The observed changes in chromatin accessibility without underlying sequence variation are highly unlikely to arise through TF-coding changes that alter their DNA binding. Rather, our finding likely reflects the propagation of upstream perturbations in the regulatory network; for example, activity changes in a few upstream “master regulator” TFs may result in lowered abundance or binding of many downstream TFs. This interpretation resonates with the empirical findings of a growing number of studies (Beadle 1972; Doebley and Stec 1991; DeCook et al. 2006; Kliebenstein et al. 2006; Fu et al. 2009; Wang et al. 2010; Holloway et al. 2011; Studer et al. 2011; Lemmon et al. 2014).
In summary, the anatomy of regulatory regions appears to be fundamentally more challenging to elucidate than the anatomy of coding regions, from the simple task of mapping them to pinpointing single base pairs of functional consequence. Our understanding of coding sequence anatomy has advanced to the point where we can computationally predict important domains within proteins; indeed, large-scale cross-species analysis of coevolution allows accurate predictions of protein structures, a prerequisite for fully understanding gene function (Ovchinnikov et al. 2015; Tang et al. 2015; Stein et al. 2015). In contrast, although gene regulation is sequence-driven, sequence conservation in regulatory regions is a much less reliable indicator of functional importance than it is for coding sequence.
However, chromatin accessibility is a reliable metric for potential regulatory function of a locus and offers a means to generate useful shortlists of putative regulatory elements (ENCODE Project Consortium 2012). Sites with different levels of accessibility among ecotypes and species are likely enriched for variation that is important for phenotype. Requiring perfect correlation between chromatin accessibility and expression of nearby genes to conclude that a locus is a functional regulatory element would be analogous to requiring a mutant phenotype before concluding a gene is functional—only a tenth of A. thaliana genes would pass this stringent definition of functionality after decades of classic genetic analysis (Lloyd and Meinke 2012). Determining the anatomy of accessible regulatory regions remains an essential, albeit challenging, task of genome annotation. Several approaches such as deep mutational scanning of specific regulatory elements (Patwardhan et al. 2009; Fowler et al. 2010) or genome-scale enhancer and promoter screens across species (Arnold et al. 2013) hold promise for solving this challenge, as will new technologies yet to emerge.
Materials and Methods
Plant Material
Transgenic INTACT lines harboring the UBQ10: NTF construct (Sullivan et al. 2014) and ACT2: BirA construct (Deal and Henikoff 2010) were created for each genetic background using double Agrobacterium tumefaciens transformation. The UBQ10 promoter drives gene expression in all cell types, organs and tissue layers investigated (Geldner et al. 2009). Transformants were selected on plates containing BASTA (15 µM) and KAN (50 µg/ml for all ecotypes except Ler-1, which received 15 µg/ml). Transgenic lines are available from ABRC under the following accession numbers: CS68650 (Bay-0), CS68651 (Bur-0), CS68652 (Cvi-0), CS68653 (Est-1), CS68654 (Ler-1), CS68655 (Shah), CS68656 (Tsu-1), CS68649 (Col-0). Original seed stocks used to generate these transgenic lines were: CS22676 (Bay-0), CS22679 (Bur-0), CS22614 (Cvi-0), CS22683 (Est-1), CS22686 (Ler-1), CS22652 (Shah), CS22693 (Tsu-1), CS28167 (Col-0).
Sample Preparation for DNase I-Seq and ATAC-Seq
Seeds (0.1 g) were surface sterilized by treating with 70% EtOH with 0.5% Triton for 10 min followed by 5 min in 95% EtOH. Seeds were dried completely on sterile filter paper and plated on 150-mm petri plates containing 50 ml 1XMS with 0.8% agar covered by a sterile no. 1 filter circle cut to size (Whatman, GE Healthcare UK Ltd). Plates were sealed with micropore tape, double wrapped with aluminum foil and stratified for 3 days at 4°C. Stratified plates were unwrapped and moved to LD conditions (16 h light, 22°C; 8 h dark, 20°C) in a growth chamber (Conviron CMP5090, Controlled environment ltd. Winnipeg, Manitoba, Canada) and grown for 7 days. Whole seedlings were harvested at the same time of day for all ecotypes and nuclei were collected and DNase I treated as in Sullivan et al. 2014, Bay-0, Bur-0, Col-0, Est-1, and Tsu-1 DNase I-seq samples were labeled as DS22973, DS23077, DS21094, DS22974, DS22968, respectively. ATAC-seq was performed as in Buenrostro et al. 2013, except transposition of INTACT-purified bead-bound nuclei was performed at 37 C for 30 min.
Preparation of Ecotype Data
Short read WGS data (single and paired-end [PE] reads) for Bay-0, Bur-0, Est-1, Tsu-1, and Col-0 were downloaded from the 1001 Genomes project for A. thaliana (Gan et al. 2011) (http://1001genomes.org/index.html; last accessed January 2, 2018). Single-end DNase I-seq 36 bp reads were aligned to the Col-0 reference genome using bwa version 0.5.6 with default parameters. Read alignments with mapQ of zero were filtered out. ChrC and ChrM reads, and centromeric regions from Clark et al. (2007) (Chr1: 13,698,788–15,897,560; Chr2: 2,450,003–5,500,000; Chr3: 11,298,763–14,289,014; Chr4: 1,800,002–5,150,000; Chr5: 10,999,996–13,332,770) were filtered out, and the remaining reads from each sample (Bay-0 n = 31,756,881; Bur-0: n = 27,556,544; Col-0 n = 43,969,877; Est-1 n = 30,787,644; Tsu-1 n = 17,892,297) were subsampled to 17.5 million reads each. Per-base DNase I cleavages, hotspots (John et al. 2011), and DHSs (peaks) were called on the subsampled data sets as before (Sullivan et al. 2014).
Identification of Differential DHSs
Bay-0, Bur-0, Est-1, Tsu-1, and Col-0 DHSs were merged to create a “union” set of 49,088 DHSs. Per-base DNase I cleavages within each merged DHS were calculated for each ecotype. DNase I cleavages within each DHS were then summed across all five ecotypes. Variable DHSs were then identified based on their CV, which is the standard deviation of DHS accessibility across the five ecotypes divided by the mean in DHS accessibility across the five ecotypes. CV was chosen as a metric because the standard deviation of DNase I cut count is a reasonably linear function of the mean DNase I cut count for 83% of DHSs (those with mean DNase I cut count above 63) (see supplementary fig. S2, Supplementary Material online). The CV threshold (CV = 0.56) was chosen because all DHSs which are predicted to be affected by a deletion (i.e., DHSs with zero per base DNase I cleavages in at least one ecotype) had a CV greater than or equal to the threshold. This CV threshold corresponds to the top 15 percentile of DHS variability.
To identify DHSs that are differential between Bur-0 and Col-0, we first found the set of (42,656) uDHSs between Bur-0 and Col-0, then identified 4,055 dDHSs from our above five-ecotype analysis that overlap the Bur-0/Col-0 union set. We made a histogram of the relative mean differences of DNase I cut count within each of those 4,055 dDHSs between Bur-0 and Col-0. Although the relative difference values ranged from −2 to 1.8, a large fraction (3,283; 80%) of these dDHSs had a relative difference of <−0.3. We therefore defined dDHSs overlapping union Bur-/Col-0 DHSs with a relative difference of <−0.3 as differential (and higher in Col-0) between Bur-0 and Col-0 (supplementary table S11, Supplementary Material online). We used a similar approach to identify DHSs that are differential between Bay-0 and Col-0 (44,148 Bay-0/Col-0 uDHSs; 4,046 dDHSs overlapping; range of relative differences: [−2, 1.9]; 3,363 [83%] differential DHSs between Bay-0 and Col-0).
Browser tracks reflect sliding window histograms of DNase I cut counts with bin size 150 bp and slide size 20 bp. Tracks consist of adjacent nonoverlapping bars, where each bar is 20 bp in width and has a height equal to the total number of DNase I cut counts in the larger 150 bp window in which the 20 bp bar is centered.
Bay-0 Draft Genome Assembly
Bay-0 genomic DNA was isolated from leaf tissue. A PE library was prepared from gDNA sheared to ∼500 bp using an S2 Focused-Ultrasonicator (Covaris Inc., MA), and the TruSeq DNA PCR-Free Library Preparation Kit (Illumina, Inc., San Diego, CA). A mate pair library (MP) was prepared using the Nextera Mate Pair Library Prep Kit (Illumina, Inc.), following the gel-plus protocol with ∼8 kb inserts. The PE library was sequenced on an Illumina MiSeq while the MP library was sequenced on an Illumina HiSeq2000 instrument. The PE data set comprised 28 million read pairs while the MP data set comprised 43 million read pairs after sequencing. Both data sets were adapter and quality trimmed using skewer (version 0.1.124; parameters -Q30 -q30 -l60). PE data was assembled with DISCOVAR de novo (release 52488, default parameters). Contigs were scaffolded with BESST (version 2.2.0; default parameters) using PE and MP data as input. Scaffolds were validation and fixed using REAPR (version 1.0.17; default parameters) again using PE and MP data as input. The final assembly consisted of 59,594 sequences, totaling 138 Mb with a N50 of 1.6 Mb.
Analysis of Reference Bias
Both Bay-0 and Col-0 DNase I reads were aligned to Bay-0 and Col-0 reference genomes using different alignment stringencies, 1) perfect (maximum edit distance between read and reference of 0; maximum number of gap opens of 0), 2) default settings (maximum edit distance between read and reference of 0.04 of read length; gap open penalty of 11), 3) relaxed settings (maximum edit distance between read and reference of 0.06 of read length; gap open penalty of 15). 17.5 M aligning reads were retained for each of these 12 alignments. Hotspots were called for each of the 12 alignments. Six sets of uDHSs were called for pairs of alignments with similar alignment settings (e.g., perfect) and to the same genome (e.g., Bay-0). For example, to obtain one set of uDHSs, we merged the DHSs derived from the default-setting alignment of Bay-0 DNase I reads to Bay-0 and the the DHSs derived from the default-setting alignment of Col-0 DNase I reads to Bay-0. For each of the six sets of uDHSs, we then identified the 1,000 uDHSs in which the number of DNase I cut counts in Bay-0 and Col-0 were most different, using CV as our metric of distances, as above. Within each of these 1,000 most-different uDHSs, we identified whether the uDHS was most open in Bay-0 (orange) or Col-0 (green).
GO Term Enrichments for Genes Residing Near DHSs
GO term enrichments were performed using DAVID (Huang et al. 2009). Fold enrichment and FDR-corrected P-values are presented for those categories enriched with FDR-corrected P-value of < 0.05.
Identification of WGS-Called Deletions >300 bp in Length in the Ecotypes
Deletions were identified by calculating the mean x-coverage in all 150 bp sliding windows (overlap = 20 bp) for each ecotype reference using the 1001 genomes (http://1001genomes.org/; last accessed January 2, 2018) short read data. The x-coverage in each window was normalized by dividing by the x-coverage observed for Col-0 short reads mapped back to the reference, which controls for regions of the genome that are more readily sequenced with short reads. We identified putative deletions by taking the 150 bp windows in the bottom 1% of normalized coverage and merged overlapping windows. We then merged putative deletions from different ecotypes that were within 1 kb of each other, to generate the predicted deletions set used in this analysis. Using this method, we determine that 1,975,980, 1,833,441, 2,002,154, 1,712,785 bps are deleted in Bay-0, Bur-0, Est, and Tsu-1, respectively, relative to the Col-0 reference.
Identification of WGA-Called Deletions
We aligned the Bay-0 draft genome to the Col-0 reference genome using MUMmer (Kurtz et al. 2004), and defined regions of the Col-0 reference genome that did not have an alignment to the Bay-0 draft genome of 1 kb or more as WGA-called deletions.
PHRAP-Based De Novo Assembly
For each of the 4,508 differential DHS most accessible in Col-0 (dDHS-C), we identified a padded window, encompassing the dDHS-C and including 200 bp extra on either side. We then extracted all reads mapping to that padded window, as well as all mates of reads mapping to these padded dDHS-C windows, regardless of whether the mate mapped to the region. Next, we extracted Col-0 sequence for these padded dDHS-C windows and generated a backbone fasta file with accompanying quality file, setting the quality of each base to zero. After converting all the fastq files to pairs of fasta and fasta.qual files, we used PHRAP to assemble the read pairs and the backbone with relaxed settings (gap extension penalty of 0; minscore of 20; minmatch of 6). The longest contig produced is the patched Bur-0 sequence. Ten of these patched Bur-0 sequences are compared with Sanger sequences and to published sequence (Gan et al. 2011) in supplementary table S8, Supplementary Material online. Indicated above each Bur-0/Col-0 alignment is the number of reads used in the PHRAP assembly and the number of reads used to generate the longest contig.
Proximity of Types of DHSs to Differentially Expressed Genes
We used DESeq (Anders and Huber 2010) to the Bur-0 and Col-0 expression data presented in Gan et al. (2011) (two replicates per ecotype) to identify 737 protein-coding genes with differential expression between Bur-0 and Col-0, adjusted P-value < 0.02 (supplementary table S14, Supplementary Material online).
For each type of DHS, 100 subsamples of 50 DHSs each were drawn. Each sample of 50 DHSs created a distribution of distances to the TSS of the nearest gene with differential expression between Col-0 and Bur-0. For each 50-DHS subsample, the fraction of DHSs within 5 kb up- and down-stream of the nearest gene with differential expression was recorded. The average of these fractions over the 100 50-DHS subsamples is displayed in (fig. 4A, top). P-values of the difference between indicated fractions were calculated using a t-test comparing the means of the 100 subsample fractions.
Conditionally Expressed Genes Are Near More DHSs
We aligned RNA-seq reads to the TAIR10 genome using TopHat version 1.4.1 (Trapnell et al. 2009) and used Cuffdiff version 2.0.2 (Trapnell et al. 2013) to identify 1,477, 1,021, 1,312, and 1,365 genes that were differentially expressed (P-value ≤ 0.05) in Col-0 in four different control versus treatment experiments, respectively: 1) dark-grown 7-day-old seedlings compared with dark-grown seven day-old seedlings + 1 day of light exposure (LD, 16-h light/8-h dark); 2) LD-grown 7-day-old seedlings with and without heat-shock (45°C for 30 min) immediately prior to RNA preparation; 3) 7-day-old seedlings without and with auxin treatment (auxin-treated seedlings were sprayed with 750 µl 1 µM IAA made from 100 mM stock in 70% ethanol, diluted in dH2O; no auxin-seedlings were mock sprayed with 750 µl 0.0007% ethanol); 4) dark-grown seven day-old seedlings without and with 5 µM brassinazole (BRZ); 7 days in the dark on plates containing 5 µM BRZ. In each case, total RNA of aerial parts 7 days old, LD grown seedlings of Col-0 was extracted with QIAGEN RNeasy kit. Two RiboMinus treatments (Invitrogen) were performed. Libraries were prepared using the TruSeq kit v2 and submitted to Illumina sequencing (36 bp reads).
Response to Prolonged UV Irradiation
Col-0, Bur-0, rev3 (CS65883) and rev7 (SALK_014571 C) seeds were germinated and grown for six days on MS Basal Salt plates, under white light (16-h light/8-h dark). Seven-day-old seedlings were then transferred to soil and grown an additional five or seven days under UV irradiation (Zilla, 17 W full-spectrum T8 fluorescent bulb). Pools of 32-74 seedlings per genotype were carefully removed from soil and weighed after a total of 12- and 14-days of growth. Fresh weight with and without UV was compared.
Testing for Conditional Expression
Bur-0 and Col-0 seedlings were grown on MS Basal Salt plates for 6 days at 22°C, in either constant darkness or LDs (16 h light/8 h dark). Both dark- and light-grown seedlings were then grown an additional 24 h in 1) LD 22°C, 2) constant darkness 22°C, 3) constant white light 4°C, and 4) constant darkness 4°C. RNA was extracted from these 7-day-old whole seedlings with Trizol (Invitrogen) and oligo-d(T) cDNA generated from 0.2-0.5 µg total RNA with the Revert Aid First Strand cDNA synthesis kit (Thermo Scientific). Relative expression levels were determined using qPCR (see supplementary table S19, Supplementary Material online for primers), with the average between Col-0 LD 22°C replicates used as baseline. AP2M (AT5G46630) was chosen as the reference gene for cDNA input control among several candidates (Wang H, Wang J, et al. 2015) based on its overall low expression level and lowest CV across ecotypes and conditions used (data not shown).
Predicted deletions near these genes were tested using the primers listed in supplementary table S19, Supplementary Material online. Note that we attempted to select primers that flanked the deletion, allowing us to see a shift in band size. This strategy succeeded for six of the ten cases. In the other four cases (AT2G26990, AT5G22510, AT2G16280, AT4G10340) the deletion was too large (>2.5 kb) to reasonably PCR across, so primers are internal to the predicted deletion, hence no band is visible in the Bur-0 sample. See figure 5C for gel results.
Comparison on Total mRNA, Nuclear mRNA, and Pol II Occupancy with Chromatin Accessibility
We used three different transcription metrics, whole mRNA from 7-day-old seedlings (GEO GSM1289364; Sullivan 2014), nuclear (INTACT) mRNA from nonhair root cells of 7-day-old seedlings (GEO GSE19654; Deal 2010 Dev Cell), and Pol II ChIP-seq from aerial portions of 10-day-old seedlings (Liu et al. 2016), to stratify the genes into nine expression quantiles from lowest to highest (1–9). We then identified the average number of DNase I cuts per base pair 800 bps upstream and downstream of genes in each quantile (see supplementary fig. S6, Supplementary Material online) for matching DNase I samples (subsampled to 17.5 M reads (GEO: GSM1289358 (SE) and GSM1289359 (PE, only forward reads used) for whole mRNA and Pol II, 7-day-old seedling samples; GEO: GSM1821072 for nonhair root epidermal cells). We observe a consistent trend across all three metrics: genes in the highest expression quantile are most accessible both upstream and downstream of the gene, with less expressed quantiles decreasing monotonically. One notable exception is the lowest quantile for the Pol II analysis; genes with the lowest Pol II occupancy showed increased accessibility both up- and downstream, compared with genes with intermediate Pol II occupancy, perhaps reflecting accessibility due to binding of repressors. Although nuclear mRNA resulted in the cleanest separation of quantiles by nuclease cut count, the differentiation between peak cut count (at −100 bp) and background cut count (at −500 bp) was highest for whole mRNA.
Calling Col-0/Bay-0 SNVs and Small Indels Using MUMmer (Version 3.23)
The genomes of the two ecotypes were aligned chromosome by chromosome (e.g., nucmer -p chr1 Bay-0.pseudochromosomes_chr1.fasta Col-0_chr1.fsa). The delta file generated by nucmer was then filtered using the many-to-many option (e.g., delta-filter -r -q chr1.delta > chr1.filter). SNPs were then extracted from this filtered file (show-snps -Clr chr1.filter > chr1.snps).
Calling Col-0/Bur-0 SNVs and Small Indels Using GATK and Freebayes
We called variants with GATK 3.6 (McKenna et al. 2010) per chromosome with standard parameters (defaults plus -stand_call_conf 30) and excluded all 500 bp windows (100 bp sliding) with coverage >40 from potential calling intervals. We called variants with freebayes 1.0.2 (Garrison and Marth 2012) per chromosome with custom parameters (–min-repeat-entropy 1 –min-alternate-count 5 –standard-filters –min-coverage 3 –max-coverage 100), filtered output for variant quality >5, and reformatted VCF output for compatibility with GATK for downstream variant merging. Variants from both callers were additionally filtered to require minimum read depth of 3 and maximum depth of 99 and eliminate calls from chloroplast and mitochondria. GATK calls were additionally filtered by mean mapping quality of all reads used (MQ > 25), an annotation that does not have an exact analog in freebayes output (see also: “MQM and MQMR in freebayes output”). Finally, variants from both callers were merged into a single variant call set with GATK’s CombineVariants tool using the UNIQUIFY setting.
Calling Bay-0 Insertion Relative to Col-0 Using MUMmer (Version 3.23)
As with SNP calling, the genomes of the two ecotypes were first aligned chromosome by chromosome (e.g., nucmer -p chr1 Bay-0.pseudochromosomes_chr1.fasta Col-0_chr1.fsa). The delta file generated by nucmer was then filtered using the many-to-many option (e.g., delta-filter -r -q chr1.delta > chr1.filter). To call insertions, the filtered alignment files were then converted to table format (show-coords chr1.filter >hr1.coords), and parsed this file to identify putative Bay-0 insertions as follows.
We first removed all aligned segments that were either <1 kb long or >100 kb away from where their expected position, assuming collinearity. We then calculated the distance between both adjacent Bay-0 aligned chunks and adjacent Col-0 aligned chunks, and discarded regions in which the Bay-0 distance was <15 bp larger than the Col-0 chunk (i.e., regions where there is a similar-sized gap in the alignment for both Col-0 and Bay-0, suggesting the presence of a hypervariable region rather than an insertion or deletion on one ecotype). We also discarded “gaps” between adjacent alignment chunks that were less than zero (i.e., that the adjacent collinear alignments overlapped). The remaining gaps between aligned Bay-0 chunks were identified as putative Bay-0 insertions.
We extracted the sequence in these putative Bay-0 insertions from the de novo Bay-0 assembly and blasted them to a database made from sequence annotated as transposon in Araport11. Regions with over 95% sequence identity to anything in this transposon database were flagged as homologous to transposon sequence.
Data Access
DNase I-seq data are available at http://www.plantregulome.org/data/releases, last accessed January 2, 2018 and at GEO (https://www.ncbi.nlm.nih.gov/geo/; Bay-0: GSM1289371; Bur-0: GSM1289370; last accessed January 2, 2018; Col-0: GSM1289358 and GSM1289359; Est-1: GSM1289372; Tsu-1: GSM1289373).
ATAC-seq data are available at https://www.ncbi.nlm.nih.gov/sra/?term=SRP098594.
RNA-seq data are available at http://www.plantregulome.org/public/rna/ and at GEO (https://www.ncbi.nlm.nih.gov/geo/; dark-grown 7-day-old seedlings: GSM1289365; dark-grown 7-day-old seedlings + 1 day of light exposure: GSM1289368; LD-grown 7-day-old seedlings with 45°C heatshock for 30 min: GSM1289369; LD-grown 7-day-old seedlings (without heatshock): GSM1289364; 7-day-old seedlings without auxin treatment (sprayed with water): GSM2719422; 7-day-old seedlings with auxin treatment: GSM2719421; dark-grown 7-day-old seedlings with 5 µM BRZ: GSM2719420). Cuffdiff results are listed in supplementary tables S15–S18, Supplementary Material online.
Supplementary Material
Supplementary data are available at Molecular Biology and Evolution online.
Supplementary Material
Acknowledgments
This work was supported by grants from the National Science Foundation (MCB1243627 to C.Q. and J.L.N. and MCB1516701 to C.Q.). K.J-B. was supported by a Big Data Training Grant for Genomics and Neuroscience (1T32CA206089-01A1). Generation of the Bay-0 draft genome was supported by DFG SPP1529 ADAPTOMICS (F.B., D.J., D.W.). M.W.D. was supported by an NSF Graduate Research Fellowship. S.F. is an investigator of the Howard Hughes Medical Institute, which supported J.T.C. We thank the Stamatoyannopoulos lab for generously providing sequencing and analysis resources.
Author Contributions
C.M.A., K.L.B., J.L.N., and C.Q. conceived the project. K.L.B., C.M.A., and C.Q. wrote the article. A.M.S., J.L.N., D.W. and S.F. provided comments. K.J-B., J.L.H. and K.L.B. conducted data analysis. C.M.A., J.R.U., M.W.D., J.T.C., A.M.S., A.A.A., A.T. conducted experiments. F.B., D.J., and D.W. provided the Bay-0 draft genome. All authors read and approved the article.
References
- 1001 Genomes Consortium. 2016. 1,135 genomes reveal the global pattern of polymorphism in Arabidopsis thaliana. Cell 1662:481–491. 10.1016/j.cell.2016.05.063 [DOI] [PMC free article] [PubMed] [Google Scholar]
- Anders S, Huber W.. 2010. Differential expression analysis for sequence count data. Genome Biol. 1110:R106.. [DOI] [PMC free article] [PubMed] [Google Scholar]
- Arnold CD, Gerlach D, Stelzer C, Boryń ŁM, Rath M, Stark A.. 2013. Genome-wide quantitative enhancer activity maps identified by STARR-seq. Science 3396123:1074–1077. [DOI] [PubMed] [Google Scholar]
- Beadle George W. 1972. The Mystery of Maize. In Joyce Zibro, editor. Field Museum of Natural History Bulletin, p. 212–221.
- Bläsing OE, Gibon Y, Günther M, Höhne M, Morcuende R, Osuna D, Thimm O, Usadel B, Scheible W-R, Stitt M.. 2005. Sugars and circadian regulation make major contributions to the global regulation of diurnal gene expression in Arabidopsis. Plant Cell 1712:3257–3281. [DOI] [PMC free article] [PubMed] [Google Scholar]
- Blatti C, Kazemian M, Wolfe S, Brodsky M, Sinha S.. 2015. Integrating motif, DNA accessibility and gene expression data to build regulatory maps in an organism. Nucleic Acids Res. 438:3998–4012. [DOI] [PMC free article] [PubMed] [Google Scholar]
- Bomblies K, Yant L, Laitinen RA, Kim S-T, Hollister JD, Warthmann N, Fitz J, Weigel D.. 2010. Local-scale patterns of genetic variability, outcrossing, and spatial structure in natural stands of Arabidopsis thaliana. PLoS Genet. 63:e1000890.. [DOI] [PMC free article] [PubMed] [Google Scholar]
- Britten RJ, Davidson EH.. 1969. Gene regulation for higher cells: a theory. Science 1653891:349–357. 10.1126/science.165.3891.349 [DOI] [PubMed] [Google Scholar]
- Broomfield S, Hryciw T, Xiao W.. 2001. DNA postreplication repair and mutagenesis in Saccharomyces cerevisiae. Mut Res. 4863:167–184. [DOI] [PubMed] [Google Scholar]
- Buchanan-Wollaston V, Page T, Harrison E, Breeze E, Lim PO, Nam HG, Lin J-F, Wu S-H, Swidzinski J, Ishizaki K.. 2005. Comparative transcriptome analysis reveals significant differences in gene expression and signalling pathways between developmental and dark/starvation-induced senescence in Arabidopsis. Plant J Cell Mol Biol. 424:567–585. [DOI] [PubMed] [Google Scholar]
- Buenrostro JD, Giresi PG, Zaba LC, Chang HY, Greenleaf WJ.. 2013. Transposition of native chromatin for fast and sensitive epigenomic profiling of open chromatin, DNA-binding proteins and nucleosome position. Nat Methods 1012:1213–1218. [DOI] [PMC free article] [PubMed] [Google Scholar]
- Carroll SB. 2008. Evo-devo and an expanding evolutionary synthesis: a genetic theory of morphological evolution. Cell 1341:25–36. 10.1016/j.cell.2008.06.030 [DOI] [PubMed] [Google Scholar]
- Choi K, Reinhard C, Serra H, Ziolkowski PA, Underwood CJ, Zhao X, Hardcastle TJ, Yelina NE, Griffin C, Jackson M et al. , 2016. Recombination rate heterogeneity within Arabidopsis disease resistance genes. PLoS Genet. 127:e1006179. [DOI] [PMC free article] [PubMed] [Google Scholar]
- Clark RM, Schweikert G, Toomajian C, Ossowski S, Zeller G, Shinn P, Warthmann N, Hu TT, Fu G, Hinds DA et al. , 2007. Common sequence polymorphisms shaping genetic diversity in Arabidopsis thaliana. Science 3175836:338–342. [DOI] [PubMed] [Google Scholar]
- Clark RM, Wagler TN, Quijada P, Doebley J.. 2006. A Distant upstream enhancer at the maize domestication gene tb1 has pleiotropic effects on plant and inflorescent architecture. Nat Genet. 385:594–597. 10.1038/ng1784 [DOI] [PubMed] [Google Scholar]
- Coller HA, Kruglyak L.. 2008. Genetics. It’s the sequence, stupid! Science 3225900:380–381. [DOI] [PMC free article] [PubMed] [Google Scholar]
- Crow JF, Kimura M.. 1970. An introduction to population genetics theory. New York, Evanston and London: Harper & Row, Publishers; http://www.cabdirect.org/abstracts/19710105376.html. [Google Scholar]
- Deal RB, Henikoff S.. 2010. A simple method for gene expression and chromatin profiling of individual cell types within a tissue. Dev Cell. 186:1030–1040. 10.1016/j.devcel.2010.05.013 [DOI] [PMC free article] [PubMed] [Google Scholar]
- DeCook R, Lall S, Nettleton D, Howell SH.. 2006. Genetic regulation of gene expression during shoot development in Arabidopsis. Genetics 1722:1155–1164. [DOI] [PMC free article] [PubMed] [Google Scholar]
- Doebley J, Stec A.. 1991. Genetic analysis of the morphological differences between maize and teosinte. Genetics 1291:285–295. [DOI] [PMC free article] [PubMed] [Google Scholar]
- Elgin SC. 1981. DNAase I-hypersensitive sites of chromatin. Cell 27(3 Pt 2):413–415. [DOI] [PubMed] [Google Scholar]
- ENCODE Project Consortium. 2012. An integrated encyclopedia of DNA elements in the human genome. Nature 4897414:57–74. 10.1038/nature11247 [DOI] [PMC free article] [PubMed] [Google Scholar]
- Felsenstein J. 1974. The evolutionary advantage of recombination. Genetics 782:737–756. [DOI] [PMC free article] [PubMed] [Google Scholar]
- Feng J, Villeponteau B.. 1992. High-resolution analysis of c-Fos chromatin accessibility using a novel DNase I-PCR assay. Biochim Biophys Acta. 11303:253–258. [DOI] [PubMed] [Google Scholar]
- Fowler DM, Araya CL, Fleishman SJ, Kellogg EH, Stephany JJ, Baker D, Fields S.. 2010. High-resolution mapping of protein sequence-function relationships. Nat Methods. 79:741–746. [DOI] [PMC free article] [PubMed] [Google Scholar]
- Fu J, Keurentjes JJB, Bouwmeester H, America T, Verstappen FWA, Ward JL, Beale MH, de Vos RCH, Dijkstra M, Scheltema RA et al. , 2009. System-wide molecular evidence for phenotypic buffering in Arabidopsis. Nat Genet. 412:166–167. 10.1038/ng.308 [DOI] [PubMed] [Google Scholar]
- Furey TS. 2012. ChIP–seq and beyond: new and improved methodologies to detect and characterize protein–DNA interactions. Nat Rev Genet. 1312:840–852. 10.1038/nrg3306 [DOI] [PMC free article] [PubMed] [Google Scholar]
- Fuxman Bass JI, Pons C, Kozlowski L, Reece-Hoyes JS, Shrestha S, Holdorf AD, Mori A, Myers CL, Walhout AJ.. 2016. A gene-centered C. elegans protein-DNA interaction network provides a framework for functional predictions. Mol Syst Biol. 1210:884.. [DOI] [PMC free article] [PubMed] [Google Scholar]
- Gan X, Stegle O, Behr J, Steffen JG, Drewe P, Hildebrand KL, Lyngsoe R, Schultheiss SJ, Osborne EJ, Sreedharan VT et al. , 2011. Multiple reference genomes and transcriptomes for Arabidopsis thaliana. Nature 4777365:419–423. [DOI] [PMC free article] [PubMed] [Google Scholar]
- Garrison E, Marth G.. 2012. Haplotype-based variant detection from short-read sequencing. arXiv [q-Bio.GN] arXiv. http://arxiv.org/abs/1207.3907. [Google Scholar]
- Geldner N, Dénervaud-Tendon V, Hyman DL, Mayer U, Stierhof Y-D, Chory J.. 2009. Rapid, combinatorial analysis of membrane compartments in intact plants with a multicolor marker set. Plant J Cell Mol Biol. 591:169–178. [DOI] [PMC free article] [PubMed] [Google Scholar]
- Gibon Y, Usadel B, Blaesing OE, Kamlage B, Hoehne M, Trethewey R, Stitt M.. 2006. Integration of metabolite with transcript and enzyme activity profiling during diurnal cycles in Arabidopsis rosettes. Genome Biol. 78:R76.. [DOI] [PMC free article] [PubMed] [Google Scholar]
- Gottesfeld JM, Murphy RF, Bonner J.. 1975. Structure of transcriptionally active chromatin. Proc Natl Acad Sci U S A. 7211:4404–4408. 10.1073/pnas.72.11.4404 [DOI] [PMC free article] [PubMed] [Google Scholar]
- Gross DS, Garrard WT.. 1988. Nuclease hypersensitive sites in chromatin. Annu Rev Biochem. 571:159–197. 10.1146/annurev.bi.57.070188.001111 [DOI] [PubMed] [Google Scholar]
- Guenther CA, Tasic B, Luo L, Bedell MA, Kingsley DM.. 2014. A molecular basis for classic blond hair color in Europeans. Nat Genet. 467:748–752. [DOI] [PMC free article] [PubMed] [Google Scholar]
- Hattori T, Totsuka M, Hobo T, Kagaya Y, Yamamoto-Toyoda A.. 2002. Experimentally determined sequence requirement of ACGT-containing abscisic acid response element. Plant Cell Physiol. 431:136–140. [DOI] [PubMed] [Google Scholar]
- Hesselberth JR, Chen X, Zhang Z, Sabo PJ, Sandstrom R, Reynolds AP, Thurman RE, Neph S, Kuehn MS, Noble WS et al. , 2009. Global mapping of protein-DNA interactions in vivo by digital genomic footprinting. Nat Methods. 64:283–289. [DOI] [PMC free article] [PubMed] [Google Scholar]
- Holloway B, Luck S, Beatty M, Rafalski J-A, Li B.. 2011. Genome-wide expression quantitative trait loci(eQTL) analysis in maize. BMC Genomics 12(June):336.. [DOI] [PMC free article] [PubMed] [Google Scholar]
- Huang DW, Sherman BT, Lempicki RA.. 2009. Systematic and integrative analysis of large gene lists using DAVID bioinformatics resources. Nat Protoc. 41:44–57. [DOI] [PubMed] [Google Scholar]
- John S, Sabo PJ, Thurman RE, Sung M-H, Biddie SC, Johnson TA, Hager GL, Stamatoyannopoulos JA.. 2011. Chromatin accessibility pre-determines glucocorticoid receptor binding patterns. Nat Genet. 433:264–268. [DOI] [PMC free article] [PubMed] [Google Scholar]
- Jolma A, Yin Y, Nitta KR, Dave K, Popov A, Taipale M, Enge M, Kivioja T, Morgunova E, Taipale J.. 2015. DNA-dependent formation of transcription factor pairs alters their binding specificity. Nature 527(November):384–388. [DOI] [PubMed] [Google Scholar]
- Joubès J, Raffaele S, Bourdenx B, Garcia C, Laroche-Traineau J, Moreau P, Domergue F, Lessire R.. 2008. The VLCFA elongase gene family in Arabidopsis thaliana: phylogenetic analysis, 3D modelling and expression profiling. Plant Mol Biol. 675:547–566. [DOI] [PubMed] [Google Scholar]
- Karve A, Moore BD.. 2009. Function of Arabidopsis hexokinase-like1 as a negative regulator of plant growth. J Exp Bot. 6014:4137–4149. 10.1093/jxb/erp252 [DOI] [PMC free article] [PubMed] [Google Scholar]
- Karve A, Xia X, Moore BD.. 2012. Arabidopsis hexokinase-like1 and hexokinase1 form a critical node in mediating plant glucose and ethylene responses. Plant Physiol. 1584:1965–1975. [DOI] [PMC free article] [PubMed] [Google Scholar]
- Kawakatsu T, Huang S-SC, Jupe F, Sasaki E, Schmitz RJ, Urich MA, Castanon R, Nery JR, Barragan C, He Y et al. , 2016. Epigenomic diversity in a global collection of Arabidopsis thaliana accessions. Cell 1662:492–505. [DOI] [PMC free article] [PubMed] [Google Scholar]
- Keene MA, Corces V, Lowenhaupt K, Elgin SC.. 1981. DNase I hypersensitive sites in Drosophila chromatin occur at the 5’ ends of regions of transcription. Proc Natl Acad Sci U S A. 781:143–146. [DOI] [PMC free article] [PubMed] [Google Scholar]
- Kim J, He X, Sinha S.. 2009. Evolution of regulatory sequences in 12 Drosophila species. PLoS Genet. 51:e1000330.. [DOI] [PMC free article] [PubMed] [Google Scholar]
- Kim S, Plagnol V, Hu TT, Toomajian C, Clark RM, Ossowski S, Ecker JR, Weigel D, Nordborg M.. 2007. Recombination and linkage disequilibrium in Arabidopsis thaliana. Nat Genet. 399:1151–1155. [DOI] [PubMed] [Google Scholar]
- King MC, Wilson AC.. 1975. Evolution at two levels in humans and chimpanzees. Science 1884184:107–116. 10.1126/science.1090005 [DOI] [PubMed] [Google Scholar]
- Kliebenstein DJ, West MAL, van Leeuwen H, Loudet O, Doerge RW, St Clair DA.. 2006. Identification of QTLs controlling gene expression networks defined a priori. BMC Bioinformatics 71:308.. 10.1186/1471-2105-7-308 [DOI] [PMC free article] [PubMed] [Google Scholar]
- Kover PX, Valdar W, Trakalo J, Scarcelli N, Ehrenreich IM, Purugganan MD, Durrant C, Mott R.. 2009. A multiparent advanced generation inter-cross to fine-map quantitative traits in Arabidopsis thaliana. PLoS Genet. 57:e1000551.. [DOI] [PMC free article] [PubMed] [Google Scholar]
- Kurtz S, Phillippy A, Delcher AL, Smoot M, Shumway M, Antonescu C, Salzberg SL.. 2004. Versatile and open software for comparing large genomes. Genome Biol. 52:R12.. [DOI] [PMC free article] [PubMed] [Google Scholar]
- Kvon EZ, Kazmar T, Stampfel G, Yáñez-Cuna JO, Pagani M, Schernhuber K, Dickson BJ, Stark A.. 2014. Genome-scale functional characterization of drosophila developmental enhancers in vivo. Nature 5127512:91–95. [DOI] [PubMed] [Google Scholar]
- Lemmon ZH, Bukowski R, Sun Q, Doebley JF.. 2014. The role of cis regulatory evolution in maize domestication. PLoS Genet. 1011:e1004745.. [DOI] [PMC free article] [PubMed] [Google Scholar]
- Lempe J, Balasubramanian S, Sureshkumar S, Singh A, Schmid M, Weigel D.. 2005. Diversity of flowering responses in wild Arabidopsis thaliana strains. PLoS Genet. 11:109–118. [DOI] [PMC free article] [PubMed] [Google Scholar]
- Li F, Zheng Q, Vandivier LE, Willmann MR, Chen Y, Gregory BD.. 2012. Regulatory impact of RNA secondary structure across the Arabidopsis transcriptome. Plant Cell Online 2411: American Society of Plant Biologists:4346–4359. [DOI] [PMC free article] [PubMed] [Google Scholar]
- Liu L, Adrian J, Pankin A, Hu J, Dong X, von Korff M, Turck F.. 2014. Induced and natural variation of promoter length modulates the photoperiodic response of FLOWERING LOCUS T. Nat Commun. 5(August):4558.. [DOI] [PMC free article] [PubMed] [Google Scholar]
- Liu C, Wang C, Wang G, Becker C, Zaidem M, Weigel D.. 2016. Genome-Wide Analysis of Chromatin Packing in Arabidopsis Thaliana at Single-Gene Resolution. Genome Res. 268:1057–1068. [DOI] [PMC free article] [PubMed] [Google Scholar]
- Lloyd J, Meinke D.. 2012. A comprehensive dataset of genes with a loss-of-function mutant phenotype in Arabidopsis. Plant Physiol. 1583:1115–1129. [DOI] [PMC free article] [PubMed] [Google Scholar]
- Ludwig MZ, Bergman C, Patel NH, Kreitman M.. 2000. Evidence for stabilizing selection in a eukaryotic enhancer element. Nature 4036769:564–567. 10.1038/35000615 [DOI] [PubMed] [Google Scholar]
- MacNeil LT, Pons C, Arda HE, Giese GE, Myers CL, Walhout AJM.. 2015. Transcription factor activity mapping of a tissue-specific in vivo gene regulatory network. Cell Syst. 12:152–162. [DOI] [PMC free article] [PubMed] [Google Scholar]
- McKenna A, Hanna M, Banks E, Sivachenko A, Cibulskis K, Kernytsky A, Garimella K, Altshuler D, Gabriel S, Daly M et al. , 2010. The genome analysis toolkit: a mapreduce framework for analyzing next-generation DNA sequencing data. Genome Res. 209:1297–1303. [DOI] [PMC free article] [PubMed] [Google Scholar]
- Meiklejohn CD, Coolon JD, Hartl DL, Wittkopp PJ.. 2014. The roles of cis- and trans-regulation in the evolution of regulatory incompatibilities and sexually dimorphic gene expression. Genome Res. 241:84–95. [DOI] [PMC free article] [PubMed] [Google Scholar]
- Mikkelsen MD, Thomashow MF.. 2009. A role for circadian evening elements in cold-regulated gene expression in Arabidopsis. Plant J Cell Mol Biol. 602:328–339. 10.1111/j.1365-313X.2009.03957.x [DOI] [PubMed] [Google Scholar]
- Muller HJ. 1966. The gene material as the initiator and the organizing basis of life. Am Nat. 100915:493–517. [Google Scholar]
- Nelson AC, Wardle FC.. 2013. Conserved non-coding elements and cis regulation: actions speak louder than words. Development 1407:1385–1395. 10.1242/dev.084459 [DOI] [PubMed] [Google Scholar]
- Ohno S. 1972. An argument for the genetic simplicity of man and other mammals. J Hum Evol. 16:651–662. 10.1016/0047-2484(72)90011-5 [DOI] [Google Scholar]
- O’Malley RC, Huang S-SC, Song L, Lewsey MG, Bartlett A, Nery JR, Galli M, Gallavotti A, Ecker JR.. 2016. Cistrome and epicistrome features shape the regulatory DNA landscape. Cell 1655:1280–1292. [DOI] [PMC free article] [PubMed] [Google Scholar]
- Ovchinnikov S, Kinch L, Park H, Liao Y, Pei J, Kim DE, Kamisetty H, Grishin NV, Baker D.. 2015. Large-scale determination of previously unsolved protein structures using evolutionary information. eLife 4(September):e09248.. [DOI] [PMC free article] [PubMed] [Google Scholar]
- Patwardhan RP, Lee C, Litvin O, Young DL, Pe’er D, Shendure J.. 2009. High-resolution analysis of DNA regulatory elements by synthetic saturation mutagenesis. Nat Biotechnol. 2712:1173–1175. [DOI] [PMC free article] [PubMed] [Google Scholar]
- Payne JL, Wagner A.. 2015. Mechanisms of mutational robustness in transcriptional regulation. Front Genet. 6:322.. [DOI] [PMC free article] [PubMed] [Google Scholar]
- Plantegenet S, Weber J, Goldstein DR, Zeller G, Nussbaumer C, Thomas J, Weigel D, Harshman K, Hardtke CS.. 2009. Comprehensive analysis of Arabidopsis expression level polymorphisms with simple inheritance. Mol Syst Biol. 5:242.. [DOI] [PMC free article] [PubMed] [Google Scholar]
- Rodgers-Melnick E, Vera DL, Bass HW, Buckler ES.. 2016. Open chromatin reveals the functional maize genome. Proc Natl Acad Sci U S A. 11322:E3177–E3184. [DOI] [PMC free article] [PubMed] [Google Scholar]
- Sabo PJ, Hawrylycz M, Wallace JC, Humbert R, Yu M, Shafer A, Kawamoto J, Hall R, Mack J, Dorschner MO et al. , 2004. Discovery of functional noncoding elements by digital analysis of chromatin structure. Proc Natl Acad Sci U S A. 10148:16837–16842. [DOI] [PMC free article] [PubMed] [Google Scholar]
- Sabo PJ, Kuehn MS, Thurman R, Johnson BE, Johnson EM, Cao H, Yu M, Rosenzweig E, Goldy J, Haydock A et al. , 2006. Genome-scale mapping of DNase I sensitivity in vivo using tiling DNA microarrays. Nat Methods. 37:511–518. [DOI] [PubMed] [Google Scholar]
- Segal E, Raveh-Sadka T, Schroeder M, Unnerstall U, Gaul U.. 2008. Predicting expression patterns from regulatory sequence in Drosophila segmentation. Nature 4517178:535–540. [DOI] [PubMed] [Google Scholar]
- Shibata Y, Sheffield NC, Fedrigo O, Babbitt CC, Wortham M, Tewari AK, London D, Song L, Lee B-K, Iyer VR et al. , 2012. Extensive evolutionary changes in regulatory element activity during human origins are associated with altered gene expression and positive selection. PLoS Genet. 86:e1002789.. [DOI] [PMC free article] [PubMed] [Google Scholar]
- Shu W, Chen H, Bo X, Wang S.. 2011. Genome-wide analysis of the relationships between DNaseI HS, histone modifications and gene expression reveals distinct modes of chromatin domains. Nucleic Acids Res. 3917:7428–7443. 10.1093/nar/gkr443 [DOI] [PMC free article] [PubMed] [Google Scholar]
- Sievers F, Wilm A, Dineen D, Gibson TJ, Karplus K, Li W, Lopez R et al. , 2011. Fast, scalable generation of high-quality protein multiple sequence alignments using clustal omega. Mol Syst Biol. 7(October):539. [DOI] [PMC free article] [PubMed] [Google Scholar]
- Slattery M, Riley T, Liu P, Abe N, Gomez-Alcala P, Dror I, Zhou T, Rohs R, Honig B, Bussemaker HJ et al. , 2011. Cofactor binding evokes latent differences in DNA binding specificity between hox proteins. Cell 1476:1270–1282. [DOI] [PMC free article] [PubMed] [Google Scholar]
- Slattery M, Zhou T, Yang L, Dantas Machado AC, Gordân R, Rohs R.. 2014. Absence of a simple code: how transcription factors read the genome. Trends Biochem Sci. 399:381–399. [DOI] [PMC free article] [PubMed] [Google Scholar]
- Song L, Zhang Z, Grasfeder LL, Boyle AP, Giresi PG, Lee B-K, Sheffield NC, Gräf S, Huss M, Keefe D et al. , 2011. Open chromatin defined by DNaseI and FAIRE identifies regulatory elements that shape cell-type identity. Genome Res. 2110:1757–1767. [DOI] [PMC free article] [PubMed] [Google Scholar]
- Stam M, Belele C, Dorweiler JE, Chandler VL.. 2002. Differential chromatin structure within a tandem array 100 kb upstream of the maize b1 locus is associated with paramutation. Genes Dev. 1615:1906–1918. 10.1101/gad.1006702 [DOI] [PMC free article] [PubMed] [Google Scholar]
- Stein RR, Marks DS, Sander C.. 2015. Inferring pairwise interactions from biological data using maximum-entropy probability models. PLoS Comput Biol. 117:e1004182.. [DOI] [PMC free article] [PubMed] [Google Scholar]
- Stern DL, Frankel N.. 2013. The structure and evolution of cis-regulatory regions: the shavenbaby story. Philos Trans R Soc Lond Ser B Biol Sci. 3681632:20130028.. [DOI] [PMC free article] [PubMed] [Google Scholar]
- Studer A, Zhao Q, Ross-Ibarra J, Doebley J.. 2011. Identification of a functional transposon insertion in the maize domestication gene tb1. Nat Genet. 4311:1160–1163. 10.1038/ng.942 [DOI] [PMC free article] [PubMed] [Google Scholar]
- Sullivan AM, Arsovski AA, Lempe J, Bubb KL, Weirauch MT, Sabo PJ, Sandstrom R, Thurman RE, Neph S, Reynolds AP et al. , 2014. Mapping and dynamics of regulatory DNA and transcription factor networks in A. thaliana. Cell Rep. 86:2015–2030. [DOI] [PubMed] [Google Scholar]
- Sullivan AM, Bubb KL, Sandstrom R, Stamatoyannopoulos JA, Queitsch C.. 2015. DNase I hypersensitivity mapping, genomic footprinting, and transcription factor networks in plants. Curr Plant Biol. 3–4:40–47. [Google Scholar]
- Takahashi S, Sakamoto A, Sato S, Kato T, Tabata S, Tanaka A.. 2005. Roles of Arabidopsis AtREV1 and AtREV7 in translesion synthesis. Plant Physiol. 1382:870–881. [DOI] [PMC free article] [PubMed] [Google Scholar]
- Tang Y, Huang YJ, Hopf TA, Sander C, Marks DS, Montelione GT.. 2015. Protein structure determination by combining sparse NMR data with evolutionary couplings. Nat Methods. 128:751–754. [DOI] [PMC free article] [PubMed] [Google Scholar]
- Todeschini A-L, Georges A, Veitia RA.. 2014. Transcription factors: specific DNA binding and specific gene regulation. Trends Genet. 306:211–219. 10.1016/j.tig.2014.04.002 [DOI] [PubMed] [Google Scholar]
- Trapnell C, Hendrickson DG, Sauvageau M, Goff L, Rinn JL, Pachter L.. 2013. Differential analysis of gene regulation at transcript resolution with RNA-seq. Nat Biotechnol. 311:46–53. [DOI] [PMC free article] [PubMed] [Google Scholar]
- Trapnell C, Pachter L, Salzberg SL.. 2009. TopHat: discovering splice junctions with RNA-Seq. Bioinformatics 259:1105–1111. 10.1093/bioinformatics/btp120 [DOI] [PMC free article] [PubMed] [Google Scholar]
- Vierstra J, Reik A, Chang K-H, Stehling-Sun S, Zhou Y, Hinkley SJ, Paschon DE, Zhang L, Psatha N, Bendana YR et al. , 2015. Functional footprinting of regulatory DNA. Nat Methods. 1210:927–930. [DOI] [PMC free article] [PubMed] [Google Scholar]
- Vierstra J, Rynes E, Sandstrom R, Zhang M, Canfield T, Hansen RS, Stehling-Sun S, Sabo PJ, Byron R, Humbert R et al. , 2014. Mouse regulatory DNA landscapes reveal global principles of cis-regulatory evolution. Science 3466212:1007–1012. [DOI] [PMC free article] [PubMed] [Google Scholar]
- Vierstra J, Stamatoyannopoulos JA.. 2016. Genomic footprinting. Nat Methods. 133:213–221. 10.1038/nmeth.3768 [DOI] [PubMed] [Google Scholar]
- Villar D, Berthelot C, Aldridge S, Rayner TF, Lukk M, Pignatelli M, Park TJ, Deaville R, Erichsen JT, Jasinska AJ et al. , 2015. Enhancer evolution across 20 mammalian species. Cell 1603:554–566. [DOI] [PMC free article] [PubMed] [Google Scholar]
- Wang C, Liu C, Roqueiro D, Grimm D, Schwab R, Becker C, Lanz C, Weigel D.. 2015. Genome-wide analysis of local chromatin packing in Arabidopsis thaliana. Genome Res. 252:246–256. [DOI] [PMC free article] [PubMed] [Google Scholar]
- Wang H, Wang J, Jiang J, Chen S, Guan Z, Liao Y, Chen F.. 2015. Reference genes for normalizing transcription in diploid and tetraploid Arabidopsis. Sci Rep. 4(October):6781.. [DOI] [PMC free article] [PubMed] [Google Scholar]
- Wang J, Yu H, Xie W, Xing Y, Yu S, Xu C, Li X, Xiao J, Zhang Q.. 2010. A global analysis of QTLs for expression variations in rice shoots at the early seedling stage. Plant J Cell Mol Biol. 636:1063–1074. [DOI] [PubMed] [Google Scholar]
- Wang Y-M, Zhou P, Wang L-Y, Li Z-H, Zhang Y-N, Zhang Y-X.. 2012. Correlation between DNase I hypersensitive site distribution and gene expression in HeLa S3 cells. PloS One 78:e42414.. [DOI] [PMC free article] [PubMed] [Google Scholar]
- Weber B, Zicola J, Oka R, Stam M.. 2016. Plant enhancers: a call for discovery. Trends Plant Sci. 2111:974–987. 10.1016/j.tplants.2016.07.013 [DOI] [PubMed] [Google Scholar]
- Weintraub H, Groudine M.. 1976. Chromosomal subunits in active genes have an altered conformation. Science 1934256:848–856. 10.1126/science.948749 [DOI] [PubMed] [Google Scholar]
- Wilson MD, Barbosa-Morais NL, Schmidt D, Conboy CM, Vanes L, Tybulewicz VLJ, Fisher EMC, Tavaré S, Odom DT.. 2008. Species-specific transcription in mice carrying human chromosome 21. Science 3225900:434–438. [DOI] [PMC free article] [PubMed] [Google Scholar]
- Wittkopp Patricia J, Kalay GIZEM.. 2011. Cis-regulatory elements: molecular mechanisms and evolutionary processes underlying divergence. Nat Rev Genet. 131:59–69. [DOI] [PubMed] [Google Scholar]
- Wong B. 2011. Points of view: color blindness. Nat Methods. 86:441. 10.1038/nmeth.1618 [DOI] [PubMed] [Google Scholar]
- Wu C, Wong YC, Elgin SC.. 1979. The chromatin structure of specific genes: II. Disruption of chromatin structure during gene activity. Cell 164:807–814. 10.1016/0092-8674(79)90096-5 [DOI] [PubMed] [Google Scholar]
- Zentner GE, Tesar PJ, Scacheri PC.. 2011. Epigenetic signatures distinguish multiple classes of enhancers with distinct cellular functions. Genome Res. 218:1273–1283. 10.1101/gr.122382.111 [DOI] [PMC free article] [PubMed] [Google Scholar]
- Zheng Q, Ryvkin P, Li F, Dragomir I, Valladares O, Yang J, Cao K, Wang L-S, Gregory BD, Copenhaver GP.. 2010. Genome-wide double-stranded RNA sequencing reveals the functional significance of base-paired RNAs in Arabidopsis. PLoS Genet. 69:e1001141.. [DOI] [PMC free article] [PubMed] [Google Scholar]
- Zuckerkandl E, Pauling L.. 1965. Evolutionary divergence and convergence in proteins. Evolving Genes Prot. 97:97–166. [Google Scholar]
Associated Data
This section collects any data citations, data availability statements, or supplementary materials included in this article.