

Summary
Lipid droplets (LDs) store fats and play critical roles in lipid and energy homeostasis. They form between the leaflets of the endoplasmic reticulum (ER) membrane and consist of a neutral lipid core wrapped in a phospholipid monolayer with proteins. Two types of ER-LD architecture are thought to exist and be essential for LD functioning. Maturing LDs either emerge from the ER into the cytoplasm, remaining attached to the ER by a narrow membrane neck, or stay embedded in the ER and are surrounded by ER membrane. Here, we identify a lipid-based mechanism that controls which of these two architectures is favored. Theoretical modeling indicated the intrinsic molecular curvatures of ER phospholipids can determine whether LDs remain embedded in or emerge from the ER; lipids with negative intrinsic curvature such as diacylglycerol (DAG) and phosphatidylethanolamine favor LD embedding, while those with positive intrinsic curvature, like lysolipids, support LD emergence. This prediction was verified by altering the lipid composition of the ER in S. cerevisiae using mutants and the addition of exogenous lipids. We found that fat-storage-inducing transmembrane protein 2 (FIT2) homologues become enriched at sites of LD generation when biogenesis is induced. DAG accumulates at sites of LD biogenesis and FIT2 proteins may promote LD emergence from the ER by reducing DAG levels at these sites. Altogether our findings suggest that cells regulate LD integration in the ER by modulating ER lipid composition, particularly at sites of LD biogenesis and that FIT2 proteins may play a central role in this process.
Keywords: Lipid Droplets, endoplasmic reticulum, membrane curvature, phospholipid intrinsic curvature, fat-storage-inducing transmembrane protein, diacylglycerol
eTOC blurb
Maturing Lipid droplets (LDs) either emerge from the endoplasmic reticulum (ER) into the cytoplasm or stay embedded in the ER. Choudhary, Golani et al. provide theoretical and experimental evidence that ER-LD architecture is controlled by the intrinsic molecular curvatures of phospholipids in the ER membrane, particularly at LD biogenesis sites.
Introduction
Lipid Droplets (LDs) play critical roles in cell physiology. Neutral lipids stored in LDs, triacylglycerols (TAGs) and steryl esters, are used for energy production and lipid metabolism [1]. The neutral lipids in LDs are surrounded by a phospholipid monolayer harboring coat proteins like perilipins and lipid metabolism enzymes [1–6].
LD biogenesis occurs in the endoplasmic reticulum (ER) and is driven by neutral lipid synthesis [1, 5, 7]. Two groups of proteins play important but still poorly understood roles in LD biogenesis: seipins and fat-storage-inducing transmembrane (FIT) proteins. Mammals have two FIT proteins, FIT1, which is muscle specific and FIT2, which is expressed in most other tissues [8]. S. cerevisiae has two FIT2 proteins, called Scs3p and Yft2p but no FIT1. Phospholipids also affect LD biogenesis. It was recently found that the efficiency of the triglyceride (trioleine) partitioning from phospholipid bilayers into the droplets and the roundness of LDs substantially depend on the phospholipid type and can be controlled by the bilayer lateral tension [9]. The dependence of LD biogenesis on phospholipids was also suggested by the experiments showing that a protein complex regulating the production of the TAG precursor diacylglycerol (DAG) localizes to sites of LD formation [10, 11].
LD biogenesis seems to occur largely in the tubular membranes of the peripheral ER, at least in mammalian cells [12]. During the course of maturation, LDs move towards the cell center [12].
After LDs form, they are usually in the cytoplasm and can remain connected to the ER by a membrane neck. This type of LD-ER architecture will be called the emerged state. In cells lacking or depleted of FIT2 proteins most LDs remained embedded in the ER membrane and exposed to the ER lumen [13]. We will refer to this type of LD-ER architecture as the embedded state. Importantly, even in wild-type cells a small fraction of LDs are embedded in the ER [13]. This finding is consistent with a recent study showing that LD-binding proteins normally in the cytoplasm can still bind LDs when expressed in the ER lumen [14], suggesting that LDs can transition between emerged and embedded states.
Here we propose and substantiate experimentally and by modelling a mechanism determining whether LDs emerge from the ER or remain embedded. This mechanism is based on the elastic behavior of phospholipid monolayers and suggests that the architecture of LD-ER connection is controlled by the intrinsic molecular curvatures of the phospholipid molecules composing the membrane monolayers.
The intrinsic molecular curvature of an individual phospholipid,ζ, is an effective value describing the mean curvature of monolayers this phospholipid builds under unconstrained conditions, which will be referred to as the molecular curvature. Curvature is defined as positive if the monolayer bulges towards its polar surface and negative otherwise (Figure 4A). Most phospholipids have a slightly negative molecular curvature such as ζPC ≈−0.1nm−1 for phosphatidylcholine (PC) [15]. Several phospholipids called “non-bilayer lipids” are characterized by large negative molecular curvatures. Examples are diacylglycerol (DAG) with ζDAG ≈ −1 nm−1 [15], cholesterol in small membrane concentration with ζCHOL≈ −0.4 nm−1 [15]. Lyso-lipids such as lysophosphaditic acid (LPA) and lysophosphatidylcholine (LPC) have strongly positive molecular curvatures measured to be, respectively,ζLPA ≈ 0.5 nm−1 [15] and ζLPG ≈ 0.2 nm−1 [15]. The molecular curvatures of phospholipids composing a lipid monolayer determine the tendency of the latter to adopt, spontaneously, a curvature referred to as the monolayer spontaneous curvature, Jsm, and equal, approximately, to the weighted average of the molecular curvatures of the constituent lipids ([16] and Methods).
Figure 4. Modulating ER phospholipid composition affects LD emergence.
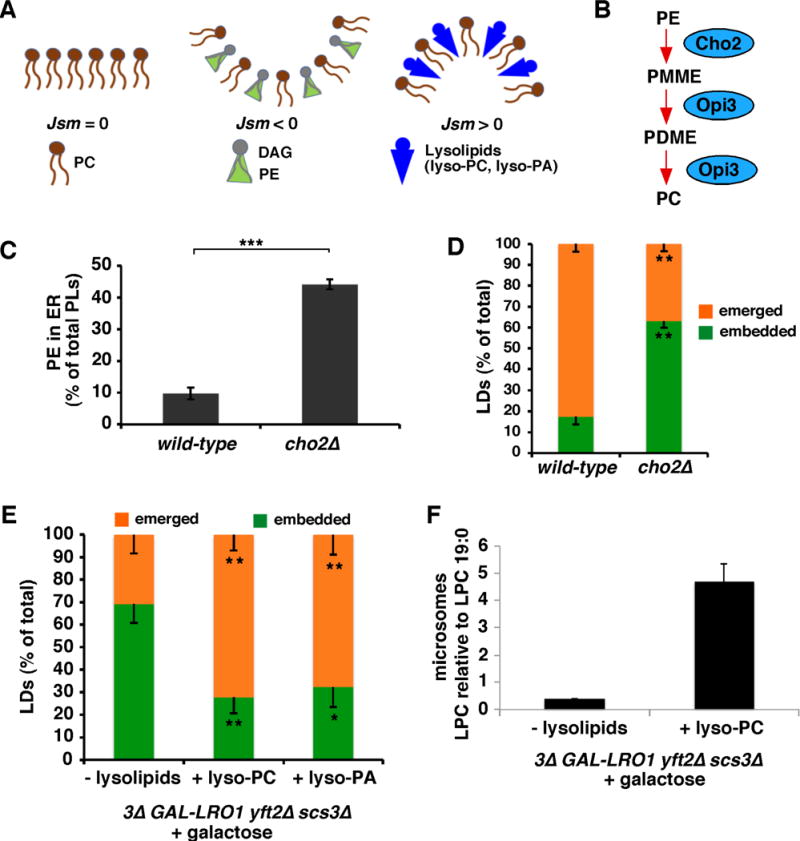
(A) Lipid composition affects monolayer curvature.
(B) Pathway of PE methylation in S. cerevisiae.
(C) PE concentration of immuo-purified ER-derived membranes, differences relative to wt *, p<0.05, ***p<0.005, unpaired student’s t-test (mean ± SD of 3 independent experiments).
(D) Percent emerged or embedded LDs; n = 50 cells, 3 independent experiments, statistics as in Figure 3F.
(E) Galactose and indicated lysolipid added to 3Δ GAL1-LRO1 yft2Δ scs3Δ cells and after 1 hour, percent emerged and embedded LDs determined as in Figure 3F (n = 36 cell, 3 independent experiments).
(F) Amount of lyso-PC (LPC) in microsomes determined using mass spectroscopy, relative to the internal standard LPC 19:0, mean ± SD of 2–3 independent experiments. Effects of exogenous lyso-PC on cell growth rates given in Figure S5.
Here we predict by theoretical modeling and verify experimentally in live cells that non-bilayer phospholipids with negative molecular curvature such as DAG or phosphatidylethanolamine (PE) favor the embedded state of LDs, while phospholipids with large positive molecular curvature, such as lysolipids, stabilize the emerged state.
Results
Theoretical model an ER tubule containing a LD
We developed a theoretical model to recover, computationally, the configurations of ER tubules, which contain LDs growing between their membrane monolayers. We aim to predict how these configurations depend on the molecular curvatures of the phospholipid molecules constituting the membrane and to determine the differences in the membrane phospholipid compositions favoring the embedded or emerged state of the system.
Qualitative essence of the model
We consider the initial ER tubule as a lipid bilayer, which is bent into a shape of a homogeneous cylindrical tube by curvature-generating proteins of reticulon and REEP/DP1/Yop1 families [17, 18] referred in the following to as the reticulons, for simplicity. We analyze, computationally, the transformations of the membrane shape produced by insertion into the bilayer of a LD, while the reticulons tend to preserve the initial shape of the tubule.
Our modeling is based on minimization of the system energy whose major component is the elastic energy of membrane bending [19]. In essence, the model proposes that there are three factors related to generation and growth of a LD within the membrane of an ER tubule, whose interplay determines the architecture of the system.
First, emergence of a LD enables a partial relaxation of the bending elastic energy accumulated, initially, by the monolayers of the tubular membrane. This relaxation drives a reshaping of the membrane in the vicinity of the droplet and determines the final equilibrium configuration of the system. More specifically, upon generation of the tubular membrane shape by the reticulon scaffolds, the membrane monolayers accumulate an elastic energy related to a mismatch between the monolayer spontaneous curvature determined by the constituent phospholipids and the actual curvatures of the monolayers imposed by the reticulons. Obviously, this monolayer elastic energy referred below to as the mismatch energy, Fmis, depends on the monolayer spontaneous curvature and, hence, on the membrane lipid composition. As long as the tubular membrane remains continuous, it stores the mismatch energy. Generation of a LD between the membrane monolayers disrupts the integrity of the membrane bilayer producing a bilayer discontinuity (Figure S1A). The rim of this discontinuity is attached to the LD surface through a transition region, which can be approximated by a line referred to as the membrane-LD contact line (Figure S1A). The presence of the discontinuity provides a way for the membrane to relax, at least partially, the mismatch energy. This relaxation is enabled by repositioning of the contact line along the LD surface accompanied by changes of the tubular membrane shape.
The second factor is the energy of the membrane-LD transition region, Ftrans (Figure S2). This energy can be either positive or negative depending on whether the spontaneous curvatures of the phospholipid monolayers covering the transition region matches the concave shape of the monolayers (Eqs.S10,S16). A positive energy, Ftrans > 0, means that the membrane-LD contact line has a tendency to contract, while in case this energy is negative, Ftrans < 0, elongation of the contact line is favorable, energetically. Hence, the changes of the energy of the transition region, Ftrans can either limit or boost the membrane shape transformations caused by LD insertion.
Finally, the third factor, which counteracts any deviation of the tubular membrane from its initial cylindrical shape including the membrane reshaping by LD is the resistance of the reticulon scaffolds which are persistently dispersed over the membrane surface.
The final equilibrium shape of the tubular membrane harboring a LD is set by the interplay of the three factors above such that the total energy of the system acquires a minimal value.
Importantly, as mentioned above and elucidated in the Methods, the mismatch energy and the energy of the transition region depend on the molecular curvatures and relative amounts of the phospholipids constituting the monolayers of the system. Therefore, the equilibrium configuration of the system depends on the membrane phospholipid composition.
In the Methods we explain in detail the origin of the above-mentioned contributions to the system energy and present the basic formulas used in the computations.
Predicted system configurations
The overall conclusions of our computations are that both the embedded and emerged states of the LD-ER systems are recovered by the model and that the transition between these states can be driven by variations of the spontaneous curvature of the membrane phospholipid monolayers, Jsm, which, in turn, is determined by the composition of the phospholipid monolayers through the molecular curvatures of the monolayer components (Eq.S1). According to the model, the negative values of c produced by relatively large mole fractions within the monolayers of phospholipids with negative molecular curvature, ζ < 0, (e.g. DAG or DOPE), favor the embedded states. Conversely, more positive values of the monolayer spontaneous curvature, Jsm, resulting from elevated mole fractions of phospholipids with positive molecular curvature, ζ > 0, (lysolipids) support the budded state.
These conclusions are illustrated in (Figure 1), which presents a series of the system configurations corresponding to variations of the spontaneous curvature of the membrane monolayers, Jsm, in a simplest case where Jsm is homogeneous throughout the whole system including the transition region. According to (Figure 1), for sufficiently negative values of the monolayer spontaneous curvature, Jsm, the system adopts configurations where the LD is deeply inserted into the tubular lumen and extensively surrounded by the tubular membrane (Figure 1A–C), which corresponds to the embedded state similar to that observed by EM [13]. For slightly negative and positive monolayer spontaneous curvatures, the LD is predicted to be located outside of the tubule and to remain connected to the tubular membrane by a narrow lipid neck (Figure 1F–I). There is some evidence that, at least in yeast, LDs remain attached to the ER by such necks [20]. For moderately negative monolayer spontaneous curvatures, the system conformations are predicted to be intermediate between the embedded and emerged states (Figure 1D–E).
Figure 1. Computed conformations of an ER tubule containing a LD.
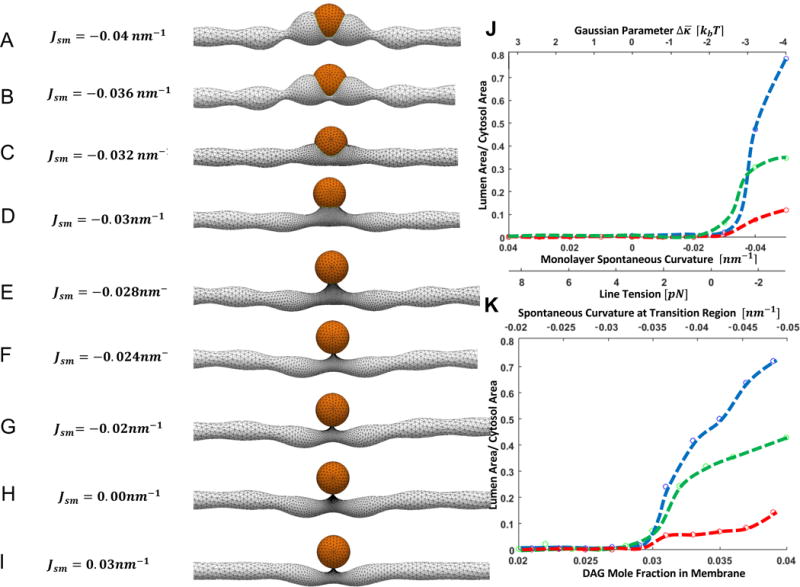
The model used for the computations is illustrated in Figures S1,S2.
(A-C) Embedded states. (D–E) Intermediate states. (F–I) Emerged states. (J) Dependence of the fraction of the droplet surface exposed to the ER lumen, Φ, on the monolayer spontaneous curvature, Jsm, and the line tension, λ, and the Gaussian modulus parameter, . (K) Dependence of Φ on DAG mole fraction in the membrane monolayers, and the corresponding values of the monolayer spontaneous curvature in the transition region upon the assumption that DAG, which freely redistributes along the monolayer including the membrane-LD transition region, is the only factor producing the monolayer spontaneous curvature. The blue, green and red lines represent the results for the LD radii of 25nm, 50nm, and 100nm, respectively. For (A–I) LD radius is 50nm, initial radius of ER tubule is 25nm, lipid monolayer bending modulus is 10kBT.
To quantitatively characterize the extent of the LD embedding into the ER tube we determined the ratio, Φ, between the LD surfaces facing the tubular lumen and the cytosol. The emerged state corresponds to, practically, vanishing Φ, whereas the embedded state corresponds to Φ significantly different from zero.
In (Figure 1J) we present the dependence of Φ on the monolayer spontaneous curvature, Jsm. The blue, green and red lines represent the results for the LD radii of 25nm, 50nm, and 100nm, respectively. Remarkably, the transition between the embedded and the emerged states is predicted to happen almost abruptly within a narrow range of the monolayer spontaneous curvature close to Jsm ≈ −0.031nm−1 (Figure 1J). For small LDs, the values of Φ in the embedded state are close to one, which means that a large fraction of the droplet area faces the ER lumen. For droplets much larger than the tube diameter, even in the embedded state Φ remains considerably smaller than one since, for steric reasons, the lumen cannot accommodate a substantial fraction of the droplet (Figure 1J).
To generalize the understanding of the model predictions, we present in (Figure 1J) also the variations of the line tension, λ (Eqs.S10,S16), and the Gaussian parameter, (Eq.S4), corresponding to the variations of the monolayer spontaneous curvature, Jsm and characterizing, respectively, the energy of the transition region and the mismatch energy (see Materials).
We further computed the system configurations for a more sophisticated case relevant for the experimental verification of the proposed mechanism presented in the next section. Here, we did not assume the homogeneity of the monolayer spontaneous curvature, Jsm, but rather considered Jsm to be generated by molecules of DAG, which undergo free redistribution between the membrane and the transition region to minimize the energy of the latter (Materials). In this case, the lipid monolayers of the transition region are getting enriched in DAG molecules since the negative curvature of these monolayers (Figure S1A) matches the negative molecular curvature of DAG, ζDAG ≈ −1 nm−1 [15]. The degree of LD embedding into ER lumen as a function of the DAG mole fraction in the membrane bulk, , which can be varied experimentally, and of the related monolayer spontaneous curvature on the transition region, , is presented in (Figure 1K). These results demonstrate, quantitatively, that increase of within the experimentally relevant range between 2–4%, promotes formation of the emerged state of the system.
Finally, we analyzed the configurations of an, initially, flat membrane with an embedded LD. The goal of this computation was to model the configurations of ER sheets or the outer nuclear membrane containing LDs. According to our computations, in this case the system can adopt two configurations: in the first, which can be classified as the embedded state, the droplet is inserted into the membrane up to its equator (Figure 2A), and in the second, that corresponds to the emerged state, the droplet is connected to the membrane by a thin neck (Figure 2B). The system undergoes transition between these two states abruptly, at a certain monolayer spontaneous curvature, whose values are presented in (Figure 2C) for different droplet radii.
Figure 2. Computed positioning of LD in flat ER membrane.
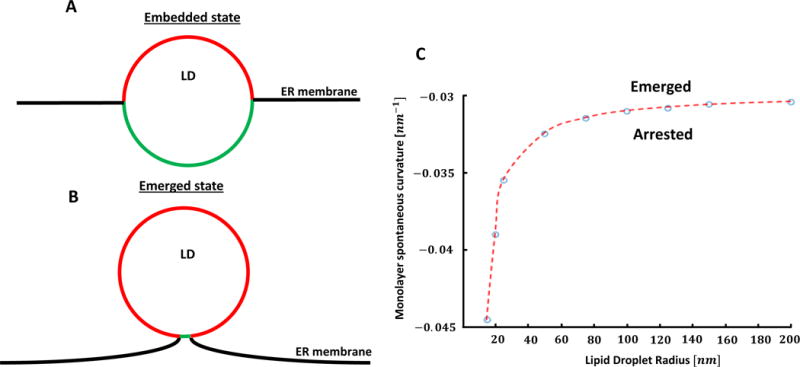
The model used for the computations is illustrated in Figures.S1,S2.
(A) Embedded state. (B) Emerged state. (C) Dependence of the monolayer spontaneous curvature, which causes transition between the embedded and emerged states, on the LD radius. Same parameter values as in Figure 1A-I.
Strategy for verifying the model
Our model predicts that altering the phospholipid composition of the ER will determine whether LDs emerge from the ER membrane or remain embedded. Lipids with negative curvature, such as DAG or PE, are predicted to favor embedded LDs, whereas phospholipids with positive curvature like lysolipids, favor emerged LDs. We tested this prediction by altering the phospholipid composition of the ER in S. cerevisiae.
DAG is elevated in the ER of cells lacking FIT2 proteins
We previously demonstrated that most LDs in S. cerevisiae lacking FIT2 proteins (scs3Δ yft2Δ) remain embedded in the ER membrane [13] (Figure 3A). When visualized by electron microscopy (EM), LDs in scs3Δ yft2Δ cells are frequently wrapped by a membrane. We demonstrated that this membrane is the ER and the space between the LD and the wrapping membrane is the ER lumen. We found that ER-wrapped LDs are embedded in the ER membrane and are not completely inside the ER lumen because they remain accessible to cytoplasmic proteins. For example, all LDs in cells lacking FIT2 proteins contain Erg6p, a peripheral membrane protein that binds the cytoplasmic surface of LDs [21]. Therefore, we used LD wrapping by the ER as an indirect indication of whether LDs emerge from the ER; LDs that are not wrapped have emerged from the ER while membrane-wrapped LDs are ER-embedded.
Figure 3. LDs remain embedded in ER when ER DAG is elevated.
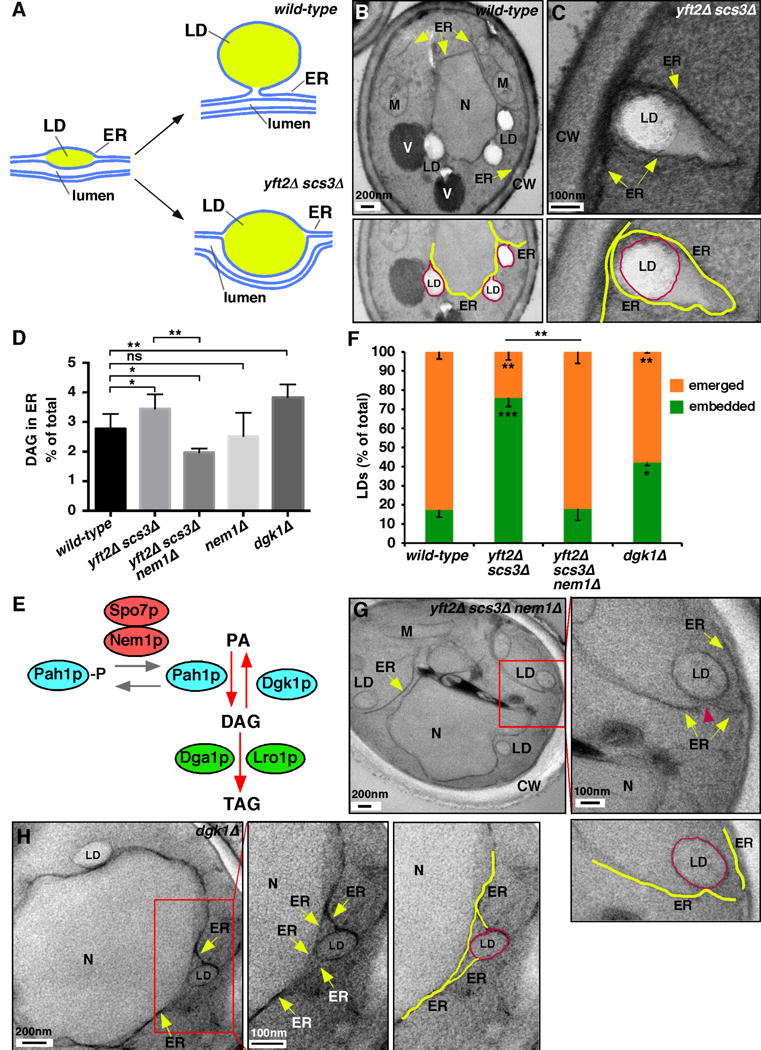
(A) Cartoon of LD formation.
(B) Wild-type and yft2Δ scs3Δ (C) cells visualized by EM. Lower panels show details of upper; ER (yellow) and LDs (red) highlighted; N, nucleus, V, vacuole, M, mitochondria, and CW, cell wall. Fluorescent images of strains in Figure S2A.
(D) DAG concentration of immuno-purifed ER-derived membranes, differences relative to wt *, p<0.05, **p<0.005, one-way ANOVA with Tukey’s multiple comparison (mean ± SD of 3 independent experiments). Whole cell DAG levels and purification controls in Figure S3B,C.
(E) Cartoon of phospholipid metabolism.
(F) Percent emereged and embedded LDs. In all the samples, ~7% of LDs were not clearly embedded in or emerged from ER, these were counted as embedded (n = 50 of 3 independent experiments, *, p<0.05, **p<0.005 relative to wt by one-way ANOVA with Tukey’s multiple comparison).
(G,H) EM of cells lacking Yft2p, Scs3p, and Nem1p (G) or Dgk1p (H). Boxed regions shown at higher magnification; ER (yellow) and LDs (red). LD number and neutral lipid levels of the strains in this figure in Figure S4.
Here we found, consistent with our previous study, that most LDs have emerged from the ER in wild-type cells and are embedded in a FIT2 mutant (Figure 3B,C; Figure S3A).
Since human FIT2 binds DAG [22], we hypothesized that FIT2 proteins affect LD emergence from the ER by modulating DAG levels. We found that DAG levels are indeed significantly higher in immuno-purified ER membranes from cells lacking FIT2 proteins than those from wild-type cells (Figure 3D; Figure S3B,C).
Altering ER DAG levels affects LD emergence from ER
To investigate the role of DAG in LD emergence, we used mutants with altered DAG metabolism. A significant fraction of DAG in S. cerevisiae cells is produced by Pah1p, which dephosphorylates phosphatidic acid (PA). Nem1p and Spo7p form a phosphatase complex that regulates Pah1p (Figure 3E). Since only dephosphorylated Pah1p is active, cells lacking Nem1p or Spo7p have reduced Pah1p activity [23] and could have reduced levels of DAG in the ER. Indeed, we found a significant decrease in DAG levels in the ER of cells lacking the FIT2 proteins and Nem1p (Figure 3D). Remarkably, the defect in LD emergence from the ER in cells lacking FIT2 proteins was reversed when they also lacked Nem1p (Figure 3F,G), consistent with the idea that DAG levels in the ER affect LD emergence. LD emergence in this train was not affected by exogenous oleic acid (not shown), which increases TAG production ([24]; Figure S4).
To obtain further evidence that DAG levels in the ER affect LD budding, we increased DAG in the ER without eliminating FIT2 proteins. DAG kinase (Dgk1p) converts DAG into PA (Figure 3E) and whole cell DAG levels are elevated in strains lacking Dgk1p [10, 25]. We found that DAG levels are significantly higher in the ER of cells lacking Dgk1p (Figure 3D). They also have significantly more ER-embedded LDs than wild-type cells (Figure 3F,H). Thus, loss of Dgk1p increases DAG in the ER and the fraction of LDs that remain embedded in the ER membrane.
Taken together, our findings support the hypothesis that DAG levels in the ER affect LD emergence; elevated DAG increases the fraction of LDs that remain ER-embedded. FIT2 proteins may support LD emergence by reducing DAG levels in the ER.
Increasing ER PE levels inhibits LD emergence from the ER
Since elevated DAG levels in the ER may inhibit LD emergence, we wondered whether increasing levels of another lipid in the ER with a negative molecular curvature, like PE, might do the same (Figure 4A). In S. cerevisiae, PC is generated from PE by two methyltransferases, Cho2p and Opi3p (Figure 4B) and cells lacking Cho2p have high levels of PE [26]. These cells have a ~5-fold increase in PE levels in the ER (Figure 4C). Consistent with our model, we found a significant increase in the fraction of LDs that remain embedded in the ER in cells lacking Cho2p (Figure 4D).
Lipids with positive monolayer spontaneous curvature promote LD emergence
Our model predicts that lipids with a positive molecular curvature promote LD emergence. If this is correct, then increasing the amount of such a lipid in the ER membrane of cells lacking the FIT2 proteins should restore emergence of nascent LDs. To test this, we added lyso-PC, which has positive molecular curvature (Figure 4A), to cells during nascent LDs formation using a strain in which de novo LD biogenesis can be controlled.
Four enzymes produce neutral lipids in S. cerevisiae: Are1p,Are2p, Dga1p, and Lro1p. Cells lacking these enzymes do not produce neutral lipids or contain LDs [27]. We used a strain that lacks Are1p, Are2p, and Dga1p and expresses Lro1p under the galactose regulatable GAL1 promoter (GAL1-LRO1, dga1Δ are1Δ are2Δ; [20]).
To test the effect of lyso-PC on LD budding, we used GAL1-LRO1 dga1Δ are1Δ are2Δ cells that also lacked FIT2 proteins (3Δ GAL-LRO1 yft2Δ scs3Δ). One hour after galactose addition, most of the LDs formed remain embedded in the ER (Figure 4E). However, when 300 μM lyso-PC was added together with galactose, most LDs emerged from the ER (Figure 4E). Addition of lyso-PC to the medium increased ER lyso-PC levels 5-fold (Figure 5F), suggesting that the effect of lyso-PC on LD emergence is caused by increased lyso-PC in the ER membrane. The addition of lyso-PC did not alter growth rate (Figure S5). Therefore, a lipid with a positive molecular curvature, lyso-PC, corrects the LD emergence defect in cells lacking FIT2 proteins. Similar results were found with lyso-PA (Figure 4E).
Figure 5. FIT2 proteins become enriched at sites of LD biogenesis.
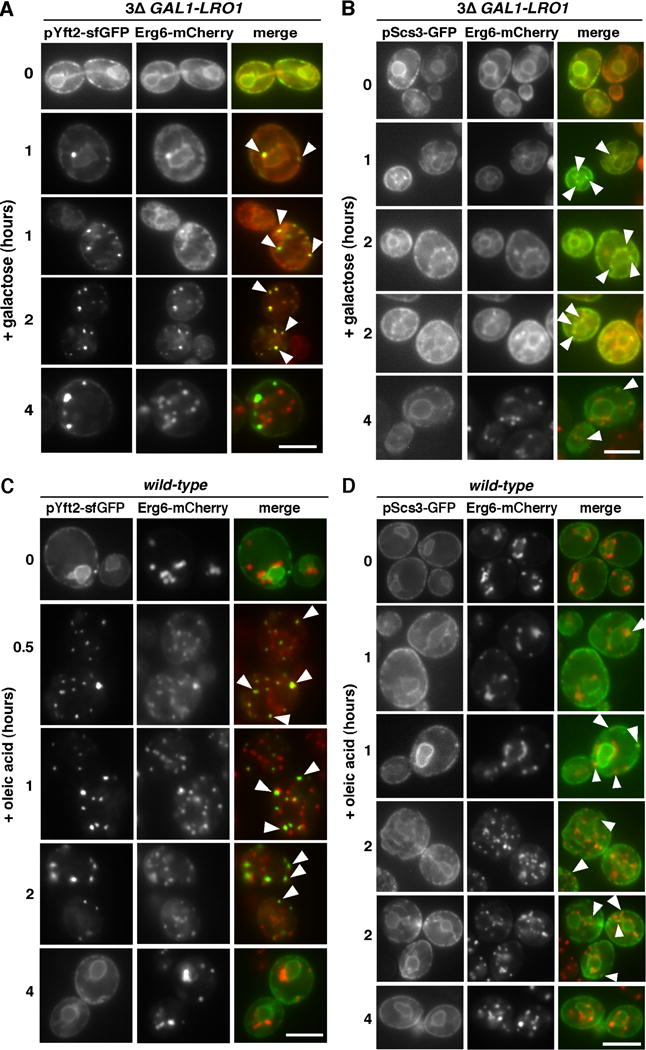
(A), (B) Galactose was added to 3Δ GAL-LRO1 cells expressing chromosomally expressed Erg6-mCherry and plasmids expressing Yft2-sfGFP (A) or Scs3-GFP (B). (C), (D) Oleic acid was added to wild-type cells expressing chromosomally expressed Erg6-mCherry and plasmids expressing Yft2-sfGFP (C) or Scs3-GFP (D). Bars = 5μM. Arrows indicate sites of colocalization of the FIT2 proteins and Erg6-mCherry. Effects of oleic acid addition on abundance of Yft2-sfGFP and Scs3-GFP in Figure S6.
FIT2 proteins are enriched at sites of LD biogenesis
We wondered whether FIT2 proteins might regulate DAG levels at sites of LD biogenesis. The two FIT2 proteins in yeast normally localize throughout the ER; Scs3-GFP and Yft2-sfGFP (sf = super fold) [13]. We visualize the GFP fusions overexpressed from plasmids because endogenously tagged proteins were dim.
To investigate the localization of the FIT2 proteins during de novo LD biogenesis, we used GAL1-LRO1 dga1Δ are1Δ are2Δ cells, which initiate LD production when exogenous galactose is added. The strain also expressed Yft2-sfGFP or Scs3-GFP and chromosomally encoded Erg6-mCherry, a protein that localizes to LDs in cells that contain them but is on the ER in cells that do not [20]. Before galactose addition, the FIT2 proteins and Erg6-mCherry have a typical ER localization (Figure 5A,B). After galactose addition, Erg6-mCherry becomes enriched at sites of LD biogenesis in the ER and by 2–4 hours is found on mature LDs. Remarkably, 1–2 hours after galactose addition Yft2-sfGFP becomes highly enriched in puncta that frequently co-localize with Erg6-mCherry puncta (Figure 5A). Similar results were obtained with Scs3-GFP, though it does not become as enriched in puncta as Yft2-sfGFP.
Comparable results were obtained when de novo LD biogenesis was induced by adding oleic acid to wild-type cells. Before oleic acid addition, Erg6-mCherry is on LDs while the FIT2 protein localizes to the ER (Figure 5C,D). Thirty minutes after oleic acid addition, Yft2-sfGFP is in puncta that frequently co-localize with Erg6-mCherry, probably at sites of LD biogenesis (Figure 5C). Interestingly, oleic acid addition caused levels of Yft2-sfGFP and Scs3-GFP to increase for 1–2 hours and return to normal by 4 hours (Figure S6), indicating that FIT2 levels are upregulated during LD biogenesis.
Oleic acid caused Scs3-GFP to become enriched in regions of the ER that co-localize with Erg6-mCherry but not to the extent that Yft2-sfGFP does (Figure 5D).
To confirm that Yft2-GFP becomes enriched at sites of de novo LD biogenesis, we determined whether it colocalizes with two proteins known to be at these sites: Nem1p and seipin (Sei1p). Oleic acid was added to growing wild-type cells expressing Yft2-sfGFP and endogenously tagged Nem1-mCherry or Sei1-mCherry. One hour after oleic acid addition, Yft2-sfGFP puncta completely co-localized with both proteins (Figure 6A), indicating that Yft2-sfGFP puncta are sites of LD biogenesis. Further evidence that LD-forming sites emerge during de novo LD biogenesis is provided by the finding that the TAG-synthesizing enzyme Lro1p becomes enriched at sites that colocalize with the LD Erg6-mCherry when LD biogenesis is induced (Figure 6B). Collectively, these findings suggest that yeast FIT2s, particularly Yft2p, become enriched at LD biogenesis sites when LD production is induced.
Figure 6. Yft2-sfGFP co-localizes with other LD-biogenesis proteins.
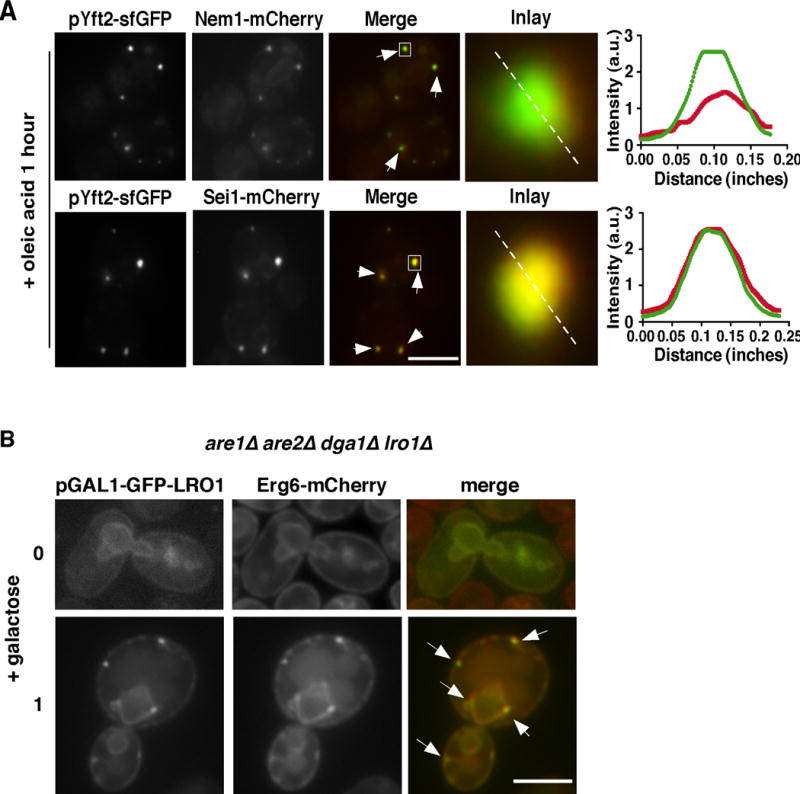
(A) Oleic acid was added to wild-type cells expressing plasmid encoded Yft2-sfGFP and either endogenously tagged Nem1-mCherry or Sei1-mCherry.and visualized after one hour. Inlay shows close-up of boxed region and panel on right shows quantification of the dotted line.
(B) Cultures of are1Δ are2Δ dga1Δ lro1Δ cells expressing Lro1-GFP under the GAL1 promoter and chromosomally Erg6-mCherry visualized before (top) or one hour after galactose addition. Bars = 5μM. Arrows indicate sites of co-localization of GFP-tagged proteins and Erg6-mCherry.
FIT2 reduces DAG accumulation at LD biogenesis sites
Since FIT2 proteins become enriched at LD biogenesis sites, we wondered whether they might regulate DAG levels at these sites. To investigate DAG distribution in the ER, we developed an ER-DAG sensor. The DAG-binding tandem C1 domains of Protein Kinase D (C1a/b-PDK) fused to GFP has been widely used to probe DAG distribution in cells and there is substantial evidence, both in vitro and in cells, that C1a/b-PDK specifically binds DAG [28–30]. We fused C1a/b-PDK to GFP and the transmembrane domain of Ubc6p, a tail-anchored ER protein (ER-DAG sensor). After confirming that the sensor colocalizes with the ER marker RFP-HDEL (Figure S7A), we expressed the sensor in cells that also expressed the Erg6-mCherry. In wild-type cells, the sensor is relatively evenly distributed in the ER (Figure 7A). In cells lacking FIT2 proteins, the sensor forms large puncta, suggesting that DAG accumulates at these sites (Figure 7B). The puncta are frequently closely apposed to LDs. We also expressed the ER-DAG sensor in dgk1Δ cells and found that the distribution of DAG was similar to that of wild-type cells (Figure 7C), despite the fact the levels of DAG are elevated in the ER of dgk1Δ cells (Figure 4D). Therefore ER-DAG sensor puncta in scs3Δ yft2Δ cells are not caused by elevated levels of DAG in the ER.
Figure 7. DAG distribution in ER altered in cells lacking FIT2 proteins and during LD biogenesis.
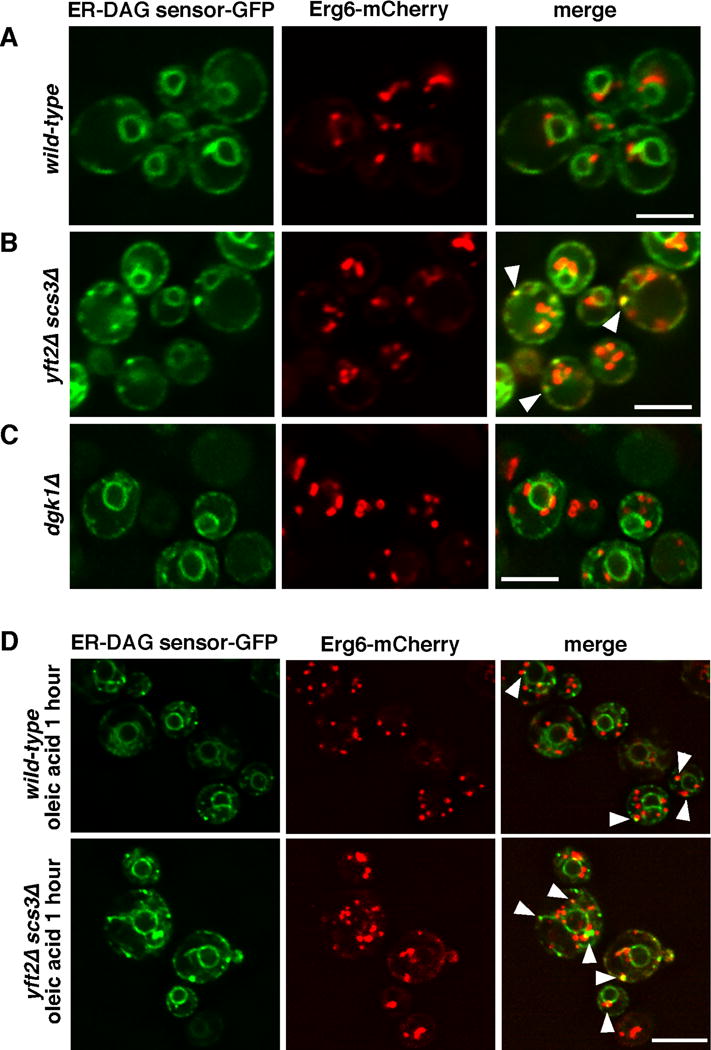
Cells expressing ER-DAG sensor and Erg6-mCherry were visualized after growth in SC medium before (A–C) or 1 hour after addition of oleic acid (D). Stacks of 3 images with a step size of 0.3μ m were taken and deconvolved; images from a single plane shown. Bars = 5μM. Arrows indicate areas of co-localization or close association of proteins. Controls for this figure are in Figure S7.
To obtain evidence that puncta formed by the ER-DAG sensor are LD biogenesis sites we added oleic acid to cells expressing the ER-DAG sensor and the LD marker Erg6-mCherry. One hour after oleic acid addition, the ER-DAG sensor formed puncta that sometimes colocalized with or were close to LDs (Figure 7D). We found that puncta formation by the ER-DAG sensor required DAG binding by using a mutation in C1a/b-PDK previously shown to ablate DAG binding ([28]; Figure S7B). To demonstrate that the puncta formed by the ER-DAG sensor after oleic acid addition are sites of LD biogenesis, we determined whether they colocalize with Yft2-sfGFP. All Yft2-sfGFP puncta that form after oleic acid addition colocalize with puncta formed by the ER-DAG sensor (Figure S7C,D), suggesting that LD biogenesis sites are enriched in DAG. Collectively, these findings suggest that FIT2 proteins modulate DAG levels at LD biogenesis sites, where DAG accumulates during LD biogenesis.
Discussion
Here we address the mechanism determining whether LDs remain embedded in the ER or emerge into the cytoplasm. Our modelling indicates that phospholipids with negative molecular curvature, ζ < 0, promote the embedded state of LDs, while phospholipids with ζ > 0 support the emerged state. The intrinsic molecular curvature of phospholipids in the ER affects LD emergence through two factors: the bending energy of the lipid monolayers covering the transition region between the ER membrane and the LD, and the elastic mismatch energy of ER monolayers. Of these two factors, our model predicts the energy of the transition region to have a dominant influence. This factor depends on the phospholipid composition only of the transition region itself, i.e. of the portion of the ER near a forming LD. Lipids with high negative (e.g., DAG and PE) or positive (e.g., lyso-PC and lysoPA) intrinsic molecular curvature were predicted to have the strongest effects on the architecture of LD-ER membrane connection. Consistent with these predictions, we found that elevating DAG or PE in the ER increased the fraction of LDs embedded in the ER while lyso-PC and lyso-PA had the opposite effect.
Therefore, the production or consumption of phospholipids with high molecular curvature in the ER, particularly at sites of LD biogenesis, is predicted to determine whether LDs remain embedded in the ER membrane or emerge into the cytoplasm. The enrichment of FIT2 at the sites of LD biogenesis, probably, serves to regulate DAG levels in these regions. Our findings with the ER-DAG sensor suggest that, in the absence of FIT2 proteins, DAG accumulates at sites in the ER where LD biogenesis can occur.
Interestingly, the ER-DAG sensor becomes enriched at LD biogenesis sites even in wild-type cells when LD production is induced, suggesting that DAG is normally produced near these sites. One function of FIT2 proteins may be to prevent DAG levels at LD biogenesis sites from becoming high enough to inhibit LD emergence from the ER membrane. How FIT2 protein reduce DAG levels at sites of LD biogenesis remains to be determined. Interestingly, there is recent evidence that FIT2 proteins are related to lipid phosphatases or phosphotrasferases (Hayes et al, Microbial Cell, in press), raising the possibility that they play a role in DAG metabolism, particularly at sites of LD production.
Previously, it was suggested that the intrinsic molecular curvature of phospholipids, ζ, may influence also the LD biogenesis [9, 10, 31]. Specifically, DAG was proposed to enhance the process of LD formation due to its ability to generate high negative curvature of membrane monolayers[10]. Taking together the latter conclusion with our prediction of DAG-based regulation of LD embedding into the ER membrane, it can be expected that an increase in the membrane DAG would facilitate formation of embedded LDs. For transition of the generated LDs to the emerged state, the amount of DAG in the membrane must be decreased.
Our findings suggest that the embedded state of LDs may be an equilibrium configuration rather than an intermediate on the way to LD exposure to the cytoplasm. In the embedded state, LDs are in contact with the ER lumen, where ER proteins with metabolic and signaling functions can access LDs and could regulate the dynamic variations of LD protein and phospholipid compositions. Incorporation or mobilization of neutral lipids from the LDs may occur more efficiently from embedded LDs. The phospholipid-driven transition between the embedded and emerged states of LDs could be used by cells to regulate the homeostasis of neutral lipid storage and other functions of LDs in response to ER stress or lipid-sensing in the ER.
STAR Methods
CONTACT FOR REAGENT AND RESOURCE SHARING
Further information and requests for resources and reagents should be directed to and will be fulfilled by Will Prinz (wp53m@nih.gov).
EXPERIMENTAL MODEL AND SUBJECT DETAILS
S. cerevisiae strains were cultivated at 30°C in YPD medium (1% Bacto yeast extract, 2% Bacto Peptone, 2% glucose or 2% raffinose) or synthetic complete (SC) media containing 6.7g/L yeast nitrogen base without amino acids (USBiologicals), an amino acid mix (USBiologicals), containing either 2% glucose, galactose, or raffinose. To grow cells in the presence of fatty acids, SC media were supplemented with 0.5 mM oleic acid (Sigma aldrich) in the presence of 1% Brij-58 (SigmaAldrich). Where indicated, lysoPC (Avanti Polar Lipids) was added to growth media at 300 μM from a stock prepared with 10 mg/mL defatted BSA (SigmaAldrich).
METHOD DETAILS
Plasmids used in this study
The plasmid encoding ER-DAG sensor was constructed by fusing the portion of the human protein kinase D gene encoding amino acids 136–343 (obtained from Tamas Balla, NIH) to genes encoding GFP and the tail-anchored transmembrane domain of S. cerevisiae Ubc6 under the ADH1 promoter in the plasmid YEplac181. The plasmids encoding Yft2-GFPsf and Scs3-GFP have been described [13] and pRS415-Sec63-HA was a kind gift of Junjie Hu (Chinese Academy of Sciences, Beijing, China). To construct the plasmid pGAL1-GFP-LRO1, LRO1 was amplified by PCR from S. cerevisiae genomic DNA and inserted into the plasmid pRS426 so that it expresses GFP fused to the N-terminus of Lro1p under the GAL1 promoter.
Fluorescence microscopy
Cells were visualized live after washing once with PBS. For (Figures 5, 6, S3), and S7C, cells were imaged with an Olympus BX61 microscope, a UPlanApox100/1.35 lens, a QImaging Retiga EX camera, and processed using IVision software (version v 4.0.5). Images being directly compared were obtained using identical microscope settings. For (Figure 7) and (Figure S7A,B), cells were imaged at 30°C in an Environmental Chamber with a DeltaVision Spectris (Applied Precision Ltd.) comprising a wide-field inverted epifluorescence microscope (IX70; Olympus), a 100×~ NA 1.4 oil immersion objective (UPlanSAPO; Olympus), and a charge-coupled device Cool-Snap HQ camera (Photometrics). Where indicated, images were deconvolved using the conserved ratio method, SoftWorx (Applied Precision Ltd.).
To visualize LDs in yeast, cells were grown in SC media and stained with BODIPY 493/503 (1μg/ml) for 5 min at room temperature.
Labeling with [3H]palmitic acid and quantification of lipids
To quantify neutral lipids and phospholipids, cells were labeled with [3H]palmitic acid as described previously [13]. Cells were grown at 30°C for 16 hours in YPD media supplemented with 10μCi/ml [3H]palmitic acid (American radiolabeled Chemicals, Inc., St Louis, MO). Cells were harvested and lipids were extracted as described [32]. When extracting lipids from immuno-purified ER, 1.5 mL of membranes was added to 6 mL of chloroform:methanol (1:2).
To quantitate TAG, DAG, and SE, the lipids were spotted onto silica gel 60 thin layer chromatography (TLC) plates (Merck, Darmstadt, Germany) and developed with hexane-diethylether-acetic acid (70:30:2). Glycerolphospholipids were separated by TLC as described [33]. Radiolabeled lipids on TLC plates were quantified using a RITA Star Thin Layer Analyzer (Raytest, Germany).
Quantification of LPC in microsomes by mass spectrometry
Lipids were extracted from microsomes corresponding to around 3.5 mg of protein, supplemented with 15 pmol C19-LPC per μg of protein as internal standard (Avanti Polar Lipids), first using chloroform:methanol (17:1; v/v), and then chloroform:methanol (2:1; v/v) [34]. The recovered lipids were pooled, dried and resuspended in chloroform:methanol (1:2; v/v). Before injection, the samples were diluted 1:10 (v/v), and mixed with ammonium formate dissolve in isopropanol to a final solvent composition of 7.5 mM ammonium formate in chloroform:methanol:isopropanol (1:2:4; v/v/v) [35]. LPC were analyzed by direct infusion using ESI-MS, and detected both as protonated LPC [MH]+, and as sodium adduct [M+Na]+. The Thermo LTQ mass spectrometer (Thermo Fisher Scientific) was operated in the positive ion mode using electrospray ionization at a flow rate of 15 μl/min and a spray voltage of 4.8 kV.
Electron Microscopy
Samples were prepared for EM as previously described [13]. Briefly, cells were fixed in the fixative media (1% glutaraldehyde, 0.2% paraformaldehyde, and 40 mM potassium phosphate, pH 7.0) for 10 min at RT followed by incubation on ice for 50 min in fresh fixative media. Cells were washed twice with 0.9% NaCl and once with water. Cells were incubated with 2% solution of KMnO4 for 5 min at RT, centrifuged and again resuspended with fresh solution of 2% KMnO4 for 45 min at RT for en-bloc staining. Subsequently cells were dehydrated using graded series of ethanol, embedded stepwise using Spurr’s low viscosity resin (EMS, Hatfield, PA, USA), and polymerized at 65°C for 48 hr. Semi and ultrathin sections were produced with a diamond knife (Diatome, Biel, Switzerland) on an ultra-microtome (UC7, Leica-Microsystems), collected on 200 mesh copper grids (EMS, Hatfield, PA, USA), post stained with uranyl acetate and lead citrate, and visualized with a Tecnai T12 TEM (FEI), operating at 120 kV. Pictures were recorded on a below mounted Gatan 2k × 2k CCD camera.
Immuno-purification of ER
ER enriched membranes were immuno-purified from cells expressing Sec63-HA. Cells were grown in SC media to late logarithmic growth phase. Where indicated, 10μCi/ml [3H]palmitic acid (American radiolabeled Chemicals, Inc., St Louis, MO) was added to the media. 200 OD600 cells were harvested, washed twice with 50 mM EDTA, and resuspended in 1 mL of ice-cold lysis buffer (600 mM Sorbitol, 10 mM triethanolamine, 150 mM NaCl, 1 mM EDTA, 1 mM PMSF, protease inhibitor cocktail (Roche), pH 8.0). Cells were disrupted by agitation with glass beads at 4°C using a Precellys-24 homogenizer (Bertin Instruments). The homogenate was centrifuged at 1000 g for 5 min at 4°C. The supernatant was centrifuged at 5000 g for 10 min at 4°C. The pellet was discarded and the supernatant was again centrifuged at 12000 g for 15 min, and 16000 g for 15 min at 4°C. The supernatant was incubated for 2 hrs at 4°C with 60 μL of μMACS MicroBeads coated with anti-HA antibodies (Mitenyl Biotec) that had been equilibrated with lysis buffer. The MicroBeads were washed once with 5 mL of lysis buffer, twice with 5 mL of washing buffer (lysis buffer but with 300 mM NaCl), and pelleted at 100,000 g for 30 min at 4°C. Proteins were eluted from the MicroBeads by incubation with SDS-PAGE running buffer.
Isolation of microsomes for lipid analysis
Cells in mid-logarithmic growth phase at 30°C in SC containing raffinose were transferred to SC containing 2% galactose and either 300 μM LPC solubilized with defatted BSA or BSA alone. After growing for one hour, ~2000 OD600 cells were pelleted, washed twice with water, and frozen. The cell pellet was thawed on ice, washed twice with 50 mM EDTA, and resuspended in ice-cold lysis buffer (600 mM Sorbitol, 10 mM triethanolamine, 150 mM NaCl, 1 mM EDTA, 1 mM PMSF, protease inhibitor cocktail (Roche), pH 8.0). Cells were disrupted by agitation with glass beads at 4°C using a Precellys-24 homogenizer (Bertin Instruments). The homogenate was centrifuged at 1000 g for 5 min at 4°C. The supernatant was centrifuged at 5000 g for 10 min at 4°C. The pellet was discarded and the supernatant was centrifuged at 30,000 g for 30 min at 4°C. The supernatant was again centrifuged at 100,000 g for 1 h at 4°C. The pelleted membranes were frozen in liquid N2.
Model used for computations of the energy contributions determining the configuration of a membrane tubule with a LD
As mentioned in the main part, the essential part of the system energy is the elastic energy of bending of membrane monolayers [19], a concept proved successful for understanding the plethora of shapes exhibited by intracellular membranes. A central notion of this concept is that of two principal curvatures of the membrane surface, c1 and c2., which determine the local membrane shape by characterizing the degree of the surface bending in two mutually perpendicular directions called the principal directions (Figure S1A) (see e.g.[36]). For fundamental physical reasons, the model of membrane bending uses two combinations of the principal curvatures, namely their sum, J= c1 + c2., referred to as the mean curvature, and their product, K = c1 · c2., called the Gaussian curvature (see e.g. [36]).
Mismatch energy accumulated by membrane monolayers and the ways of its relaxation
The two phospholipid monolayers constituting the bilayer are assumed to have the same phospholipid composition (see below for discussion). To make clear the origin of the elastic energy stored within the initial ER tubule, we consider an imaginary process of the tubule step-by-step formation from two monolayers.
Each monolayer, taken separately, tends to adopt a shape with the mean curvature equal to the weighted average of the molecular curvatures of the constituting lipids [16] and referred to as the monolayer spontaneous curvature,
| (S1) |
where ζi is the molecular curvature of i-th phospholipid component and ϕi is the mole fraction of this component within the monolayer. For example, in case the monolayer contains an excess of phospholipids with negative molecular curvature such as DAG characterized by ζDAG ≈ −1 nm−1 [15], each monolayer has a negative spontaneous curvature, Jsm < 0, and tends to adopt a concave shape (Figure S1B). In the opposite case of an excess of phospholipids with positive molecular curvature, such as lysoPC described by ζLPG ≈ 0.2 nm−1 [15], the monolayer spontaneous curvature is positive, Jsm > 0, and the preferred monolayer shape is convex.
At the first imaginary step of the tubule formation, the two monolayers get coupled into a bilayer (Figure S1C). Since the monolayers have the same spontaneous curvature, Jsm, for symmetry reasons, the resulting bilayer acquires a flat shape with vanishing mean curvature, JB = 0 (Figure S1C). Hence, each monolayer within the bilayer is forced to be flat, and deviates, therefore, from its preferred curved shape. This mismatch between the nonzero spontaneous curvature of each monolayer and its vanishing actual mean curvature results in accumulation within the monolayer of elastic energy. The sum of the elastic energies of the two monolayers constitutes the mismatch energy of the membrane, Fmis.
At the next step, the reticulons sculpt the bilayer into a cylindrical tube with radius, R, so that the bilayer mid plane acquires a mean curvature, JB = 1/R. As a result, the external and internal monolayers whose surfaces are shifted, respectively, up and down from the bilayer mid surface, by the monolayer thickness, δ, acquire mean curvatures, Jout = 1/(R + δ) and Jin= −1/(R – δ), respectively. Upon this bilayer bending, the elastic energy increases for one monolayer and decreases for the second one, but, in a sufficiently good approximation of small monolayer thickness, δ/R ≪ 1, the changes of the elastic energies of the two monolayers mutually compensate so that the total mismatch energy, Fmis, remains the same as in the flat shape preceding the bending by reticulons. It is important to emphasize that, since the mismatch energy, Fmis, is a direct consequence of a non-vanishing spontaneous curvature of the phospholipid monolayers constituting the ER membrane tubule, Jsm ≠ 0, it depends on the monolayer phospholipid composition through (Eq.S1).
One of the key points of the model is that the membrane tends to relax, as much as possible, the mismatch energy, Fmis, and, at the same time, to keep the mean curvature of its mid surface, JB, as close as possible to the value, JB = 1/R, created by the reticulons.
A relaxation of the mismatch energy, Fmis, is, indeed, possible under certain conditions. To illustrate the geometrical essence of such relaxation, consider again a flat bilayer element (Figure S1C), formed by coupling of two monolayers with negative spontaneous curvature, Jsm < 0, such that each monolayer, if taken separately, tends to adopt a concave shape (Figure S1B). Although not immediately intuitive, the in-depth analysis shows that acquiring by this bilayer element of a saddle-like shape (Figure S1D) enables some decrease of the mismatch energy, Fmis, while keeping the mean curvature of the bilayer mid surface vanishing, JB = 0, like in the initial flat state. Indeed, the saddle-like shape of the bilayer mid surface is convex and concave at the same time (Figure S1D) such that the positive and negative curving mutually compensate and the mean curvature of the mid surface remains vanishing, JB = 0, while the Gaussian curvature becomes negative, K < 0. At the same time, a calculation of the deformations of the planes within the membrane shifted with respect to the mid plane reveals that the surfaces of the external and internal monolayers, which are shifted from the bilayer mid surface, acquire non-zero mean curvatures, Jout and Jin, which are equal for the two monolayers and are negative, Jout = Jin < 0. As a result, the transition from the flat to the saddle-like shape, reduces the differences between the actual monolayer mean vatures, Jout and Jin, and their negative spontaneous curvatures, Jsm < 0, so that the mismatch elastic energy, Fmis, partially relaxes.
An analogous consideration shows that also if the considered bilayer element is bent by reticulons into a cylindrical shape, it can reduce, to some extent, its mismatch energy, Fmis, by acquiring a saddle-like hourglass shape.
Finally, a partial relaxation of the mismatch energy, Fmis, is possible also if the membrane monolayers have a positive spontaneous curvature, Jsm > 0, generated by an excess of phospholipids with a positive molecular curvature, ζ > 0, such as lysolipids. In this case, to reduce Fmis, the bilayer element has to become more convex or more concave.
The qualitative conclusions above have been accounted for by exact considerations based on the theory of membrane bending elasticity, which demonstrated that the mismatch energy is proportional to the Gaussian curvature of the membrane mid plane, K. The expression for the mismatch energy related to the unit area of the membrane mid plane, fmis, which followed from these considerations, is given by
| (S2) |
where, Jsm, is the monolayer spontaneous curvature (Eq.S1), κm is the monolayer bending modulus, δ is the monolayer thickness. The energy (Eq.S2) is determined with respect to the flat reference state of K = 0. For the following, we refer to the product of the system parameters, 4κm ·δ·Jsm, in (Eq.S2) as the Gaussian parameter,
| (S3) |
Up to now, we considered an isolated membrane fragment with free edges. On the other hand, the membranes of ER and other cellular organelles, whose total mismatch energy, Fmis, can be computed by integration of fmis over the total area of the membrane,
| (S4) |
are continuous and do not possess free edges. A geometrical analysis demonstrates that for closed membrane with no free edges the relaxation of the total mismatch energy, Fmis (Eq.S4), is not possible. The reason for this is that favorable deformations in some elements of a continuous membrane are necessarily accompanied by unfavorable deformations in other elements so that the overall change on the total mismatch energy, Fmis, exactly vanishes. Mathematically, this means that the integral representing the mismatch energy (Eq.S4) for a closed surface remains constant independently of the surface deformations (Gauss-Bonett theorem [36]).
At the same time, in case the membrane has a discontinuity, such as the one produced by a LD (Figure S1A), relaxation of the total mismatch energy, Fmis, becomes feasible. The variations of the mismatch energies of the lipid bilayer elements adjacent to the discontinuity rim remain uncompensated due to the absence of the bilayer on the other side of the rim, such that the integral (Eq.S4) decreases for certain membrane shapes. As a result, a repositioning of the discontinuity rim along the LD surface and the related changes of the membrane tubule shape result in partial relaxation of the total mismatch elastic energy of the membrane, Fmis.
Energy of membrane-LD transition region
The transition region is the zone where the cytosolic and luminal monolayers of ER membrane connect smoothly to the corresponding monolayers of the LD (Figure S1A). The gap between the monolayers covering the transition region is filled by the neutral lipids. The energy of the transition region, Ftrans, is the thermodynamic work, which has to be performed to create it out of the initial membrane bilayer. There are two major factors that determine this energy. First, the monolayers attract each other by Van-der-Waals (VdW) force [37]. Separating the monolayers requires a work to be done against VdW forces, which contributes to the energy of the transition region. Second, the phospholipid monolayers of the transition region acquire a strongly concave shape characterized by a negative mean curvature (Figure S1A). The elastic energy of this curvature is another contribution to Ftrans. Importantly, the latter energy contribution essentially depends on the spontaneous curvatures, Jsm, and, hence, the composition of the phospholipid monolayers covering the transition region.
Based on imaging of nascent LDs [12, 13, 38–41], the observations in model systems [9] and our evaluations, the characteristic width of the transition region can be estimated to be a few tens of nanometers. Here, we consider LDs, which are significantly larger than this width having diameters of 100nm and more. As mentioned above, for the sake of semi-quantitative analysis, this enables us to consider the transition region as a width-less line running along the interface between the ER membrane and LD and referred to as the contact line (Figure S1A). The energy of the transition region related to the unit length of the contact line will be called the line tension, λ. The total energy of the transition region is given by integration of the line tension over the contact line.
| (S5) |
The energy, Ftrans, will be computed with respect to the initial non-split state of the monolayers.
To simplify the derivations, we consider the membrane and the LD surface to be flat so that the intercept between their planes is a straight line representing the axis of the transition region (Figure S2A). This approximation is expected to give quantitatively accurate results in cases where the width of the transition region is much smaller than the radii of curvature of the membrane tubule and the LD. Otherwise, our description of the transition region has to be regarded as semi-quantitative. We choose the contact line between the ER membrane and the LD to coincide with the axis of the transition region.
We assume that the two monolayers of the transition region have a shape of quarter cylinder so that the phospholipid monolayers covering the upper and lower faces of the transition are represented by circular arcs of radius R (Figure S1A). This approximation enables an analytical determination of the energy, Ftrans, but the accuracy of the model predictions has to be considered as semi-quantitative.
As mentioned in the main text, we consider two contributions to the energy of the transition region, Ftrans. The first is the energy of Van-der-Waals (VdW) attractive forces, FVdW, which act between the phospholipid monolayers covering the cytosolic and luminal faces of the transition region (Figures S1A, S2A). The second is the energy of bending of the cytosolic and lumenal monolayers of the transition region, FB.
We compute the energy, Ftrans, and the corresponding line tension, λ, by minimizing the sum of FVdW and FB with respect to the curvatures of the cytosolic and luminal monolayers of the transition region and the distribution of the lipid components between the monolayers of the transition region and those of the bilayer membrane.
The computation of FVdW is based on the expression for VdW interaction between two flat parallel lipid monolayers separated by a layer of hydrophobic medium (Figures S1A, S2A). The energy of this interaction related to area element of the monolayer, fVdW, can be presented as [37]
| (S6) |
where AH is the Hamaker constant of the system, lb is twice the monolayer thickness, l is the distance between the monolayers faces across the hydrophobic medium [37].
To compute the energy of interaction between the curved monolayers of the transition region, we use the well-established Derjagin approximation [37], according to which the total energy of VdW interaction is given by integration of fVdW (Eq.S6) over the monolayer surfaces,
| (S7) |
where L is the length of the contact line, and θ is the angular coordinate along the monolayer profile, as illustrated in (Figure S2B). The VdW energy of formation of the transition region out of the initial flat bilayer is given by the difference between the energy, , given by (Eq.S7), and VdW energy of the initial non-split monolayers, , which is given by (Eq. S6) for l = 0. As a result, we obtain for ,
| (S8) |
The bending energy of the two quarter-cylindrical phospholipid monolayers of the transition region related to the energy in the initial flat shape is given within Helfrich model of membrane bending elasticity by [19],
| (S9) |
where κm is the monolayer bending modulus and Jsm is the monolayer spontaneous curvature.
First, we consider a simplest scenario where the monolayer spontaneous curvature, Jsm, is homogeneous all over the system including the membrane and the transition region. The energy of the transition region and the corresponding line tension are obtained by minimization of the sum of VdW and bending energies, FVdW +FB. Assuming that the curvature radius of the monolayers exceeds considerably the bilayer thickness, R ≫ lb, we obtain for the line tension, λ
| (S10) |
Now consider a more sophisticated situation, where lipid molecules undergo partitioning in the monolayer plane, which enables reduction of the bending energy. In this case, in addition to the energies of VdW interaction and the monolayer bending, we have to take into account the contribution to the energy of the entropy of the lipid molecule distribution between the membrane and the monolayers of the transition region. For the sake of this computation we use an explicit relationship between the local spontaneous curvature, Jsm, and the phospholipid composition of a monolayer, which is equivalent to (Eq.S1). It is convenient to consider the monolayer phospholipid mixture as consisting of a background component having a molar ratio in the mixture, ϕ0 and a number of the lipid additions with molar ratios, ϕi, such that ϕi = 1 − Σϕi, where the summation in taken over all lipid additions. In a good approximation, Jsm is a weighted average of the molecular curvatures of all lipid components,
| (S11) |
where ζo is the molecular curvature of the background lipid, and ζi is the molecular curvature of the i-th lipid addition [16]. Eq.(S11) assumes that the molecular areas in the membrane plane are equal for all phospholipid components.
Using (Eqs.S10, S11) and the well-known expression for contribution to the monolayer free energy of the translational entropy of the components, the energy of the transition region formation can be presented as
| (S12) |
where are the mole fractions of the phospholipid additions in the membrane, which plays a role of a lipid reservoir for the transition region, n is the molecular area of phospholipids in the membrane plane, and kBT ≈ 4 10−21 Joule is the product of Boltzmann constant and the absolute temperature. The term in the first square brackets represents the contribution of the bending energy, while the terms in the second square brackets is the translational entropy contribution. The energy (Eq.S12) has to be minimized with respect to the lipid molecular fractions in the transition region, ϕi, and the curvature radius of the lipid monolayers fragments covering the transition region, R. The minimization with respect to ϕi eads to the relationships
| (S13) |
Substituting (Eq.S13) in (Eq. S12), after some simple algebra we get
| (S14) |
and the corresponding line tension is
| (S15) |
We substitute (Eq.S8) for VdW energy in (Eq.S14) and minimize the result with respect to the monolayer curvature radius R. This minimization can be performed analytically if the mole fractions of the lipid additions in the membrane are small, , and the effective molecular bending energy of every addition is smaller than the thermal energy, . In this case, the line tension, λ (Eq.15), is given by
| (S16) |
where a ≈ 0.7nm−2 is lipid molecular in-plane area and, as above, the summations are taken over all lipid additions. Otherwise, the latter minimization needs numerical computations.
For quantitative illustration of the line tension dependence on the lipid composition, we consider a specific case relevant for the experimental verification of the model presented in the main part of the article, where the only phospholipid addition is DAG having the molecular curvature ζD ≈ −1 nm−1 [15] and the molecular curvature of the background lipid vanishes,ζ0= 0. Substituting the typical values for other parameters, AH ≈ 1.5 κBT ≈ 5.2 10−21 Joule [37], κm = 4 10−20Joule [19] and Lb = 3nm [42], we obtain that the line tension, λ, becomes negative for feasible DAG molar ratios of few percent.
Bending energy of ER tubule
The deformation of the membrane tubule in the vicinity of LD resulting from the interplay between the mismatch energy, Fmis, and the energy of the transition region, Ftrans, leads to deviation of the membrane from the initial tubular shape created by the reticulons. This must be accompanied by accumulation of the energy, FT, resulting from the resistance of the reticulons to the changes of membrane curvature. To account for this energy, we describe the effect of the reticulons by a spontaneous curvature, JSB, the reticulons impose on the membrane as a whole. The energy per membrane unit area, fT, related to a deviation of the mean curvature of the bilayer mid plane, JB, from the bilayer spontaneous curvature, JSB, will be assumed to have the generic form [19],
| (S17) |
where κb is the membrane bending modulus accounting for the contributions of both the phospholipid bilayers and the reticulon scaffolds. The total bending energy of the membrane is given by integration of fT over the membrane surface,
| (S18) |
It has to be added for completeness that the phospholipid monolayers, constituting the membrane, are characterized also by the moduli of Gaussian curvature, , and the corresponding energy of Gaussian curvature, K [19]. In general, this energy has to be added to the mismatch energy (Eq. S4). Here we assume that the monolayer moduli, , are homogeneous throughout the tubular membrane, the transition region and the monolayers covering the LD. In this case, for the mentioned above geometrical reasons (Gauss-Bonnet theorem) the monolayer energy of Gaussian curvature remains constant independently of the system shape and, therefore, does not influence the membrane configurations induced by LD insertion. As a result, the only relevant energy contribution related to Gaussian curvature, is that of the mismatch energy (Eq.S4).
Computations
We computed the configurations of a membrane tubule containing a LD by numerical minimization of the total energy of the system, which includes the mentioned above contributions from the mismatch (Eq.S4) and bending (Eq.S18) energies of the ER tubular membrane and the energy of the transition region (Eq.S5).
The LD was considered to remain spherical irrespectively of the membrane configurations. The reason for that is the finite surface tension of the LD, which favors the spherical shape of the droplet and is not counteracted by any tension in the loose tension-free membrane. To simplify the calculations, we assumed that the membrane is perpendicular to the LD surface at the contact line.
In computations accounting for DAG redistribution between the membrane and the transition region we made the simplest assumption that the contributions to and of all phospholipids but DAG mutually compensate so that deviations of the spontaneous curvatures, and , from zero is produced, solely, by DAG.
The energy minimization was performed numerically by using Brakke’s “Surface Evolver” program[43].
Assumptions of the model
One important assumption of our model is that there is a vanishing lateral tension in the ER bilayer containing LDs. We also assume that there is sufficient surface tension on LDs for them to be spherical and that this tension is equal for the cytosolic and luminal sides of LDs. The interplay between ER bilayer tension and the LD shape has been recently considered in great detail [9]. It was shown that bilayer tensions of more than 0.1 mN/m can prevent LDs from rounding, while lower tensions do not interfere with formation of spherical LDs [9].
There is little reason to suspect that the ER membranes are exposed to significant tensions exceeding 0.1 mN/m. Indeed, the ER tubular network can be formed in vitro through fusion of ER derived vesicles in the absence of cytoskeleton and molecular motors [44]. In cells, ER tubules are not aligned with the cytoskeleton [45], suggesting that the ER is not anchored to or stretched between the cytoskeleton elements. Consistent with this, depolymerization of cytoskeletal filaments does not result in ER networks collapse in yeast [46] and causes only gradual retraction of the peripheral ER network in mammalian cells [47]. Finally, observation of the ER by fluorescence and electron microscopy does not suggest the ER tubules to be is stretched (see e.g. [45]).
Concerning a non-vanishing surface tension on LDs, there are two major arguments in favor of this assumption. First, a practically ideally spherical shape of mature LDs could not be observed in case the droplets had a vanishing surface tension since strong shape fluctuations would result in substantial deviations of the LD shape from the spherical one. Second, according to the fundamental knowledge achieved by Physical Chemistry of emulsions and microemulsions, there are no surfactants, which would be able to completely abolish the surface tension of an interface between a hydrophobic substance and the aqueous solution. Therefore, it is implausible that a phospholipid monolayer can entirely eliminate the LD surface tension equal zero. The specific value of the LD surface tension is irrelevant for the model since the vanishing lateral tension of the membrane cannot counteract any finite tension of the LD.
Therefore, our assumptions of zero lateral tension in ER membranes and non-vanishing LD surface tension in LD are consistent with the observations of ER shape dynamics, the results of physico-chemical studies of behavior of artificial hydrophobic droplets in lipid bilayers [9], and the round shape of LDs in cells.
Our model also makes important assumptions about phospholipid distribution in the ER, we assume there is no difference in composition between the ER membrane leaflets and between the ER membrane and the surface of LDs. There is, however, some evidence for minor differences [1, 48, 49]. These differences are probably not big enough to significantly affect LD emergence. It has been suggested that the asymmetric distribution of phospholipids between ER leaflets could influence whether LDs emerge into the cytoplasm or ER lumen [50] but our model suggests that the direction of emergence could be solely determined by the positive curvature of the ER tubular membrane.
Finally, to facilitate the numerical calculations we required the membrane to remain oriented perpendicularly to the LD surface along the contact line. Our computations for several specific parameter sets confirmed that lifting this constraint influences to small extent the membrane shape in the vicinity of LD but does not affect the qualitative and quantitative conclusions of the model.
QUANTIFICATION AND STATISTICAL ANALYSIS
In Figures 3D, 3F, 4D, 4E, S3B, and S4B statistical significance was assessed using one-way ANOVA with Tukey’s multiple comparison from at least three independent experiments. A p value of < 0.05 was considered significant. In Figure 4C, statistical significance was assessed using a two-tailed unpaired student’s t-test and a p value of < 0.05 was considered significant.
Supplementary Material
Highlights.
Nascent lipid droplets emerge from or remain embedded in the ER membrane
Lipid droplet emergence is controlled by ER phospholipid intrinsic curvature
FIT2 proteins control lipid droplet emergence by reducing ER diacylglycerol levels
During lipid droplet production, FIT2 proteins become enriched at biogenesis sites
Acknowledgments
W.A.P., V.C., and A.S.J. were supported by the Intramural Research Program of the National Institute of Diabetes and Digestive and Kidney Diseases. M.M.K. was supported by Israel Science Foundation grant 1066/15, and EU consortium InCeM. R.S. was supported by The Swiss National Science Foundation, (Projects 31003A_153416 and 31003A_173003). We thank Junjie Hu (Beijing University, China) and Tamas Balla (NIH, USA) for providing a plasmids and helpful discussions.
Footnotes
Publisher's Disclaimer: This is a PDF file of an unedited manuscript that has been accepted for publication. As a service to our customers we are providing this early version of the manuscript. The manuscript will undergo copyediting, typesetting, and review of the resulting proof before it is published in its final citable form. Please note that during the production process errors may be discovered which could affect the content, and all legal disclaimers that apply to the journal pertain.
Author contributions
Conceptualization, W.A.P. and M.M.K; Methodology experiment, V.C., A.S.J., and W.A.P; Methodology theory and computation, G.G. and M.M.K; Investigation experiment, V.C., A.S.J., and W.A.P.; Investigation theory and computation, G.G. and M.M.K; Mass spectrometry, S.C. and R.S; Writing, W.A.P. and M.M.K; Supervision experiment, W.A.P.; Supervision theory and computation, M.M.K.
Declaration of interests
The authors declare no competing financial interests.
References
- 1.Hashemi HF, Goodman JM. The life cycle of lipid droplets. Curr Opin Cell Biol. 2015;33:119–124. doi: 10.1016/j.ceb.2015.02.002. [DOI] [PMC free article] [PubMed] [Google Scholar]
- 2.Barbosa AD, Savage DB, Siniossoglou S. Lipid droplet-organelle interactions: emerging roles in lipid metabolism. Curr Opin Cell Biol. 2015;35:91–97. doi: 10.1016/j.ceb.2015.04.017. [DOI] [PubMed] [Google Scholar]
- 3.Barneda D, Christian M. Lipid droplet growth: regulation of a dynamic organelle. Curr Opin Cell Biol. 2017;47:9–15. doi: 10.1016/j.ceb.2017.02.002. [DOI] [PubMed] [Google Scholar]
- 4.Thiam AR, Beller M. The why, when and how of lipid droplet diversity. J Cell Sci. 2017;130:315–324. doi: 10.1242/jcs.192021. [DOI] [PubMed] [Google Scholar]
- 5.Wilfling F, Haas JT, Walther TC, Farese RV., Jr Lipid droplet biogenesis. Curr Opin Cell Biol. 2014;29:39–45. doi: 10.1016/j.ceb.2014.03.008. [DOI] [PMC free article] [PubMed] [Google Scholar]
- 6.Pol A, Gross SP, Parton RG. Review: biogenesis of the multifunctional lipid droplet: lipids, proteins, and sites. J Cell Biol. 2014;204:635–646. doi: 10.1083/jcb.201311051. [DOI] [PMC free article] [PubMed] [Google Scholar]
- 7.Martin S, Parton RG. Lipid droplets: a unified view of a dynamic organelle. Nat Rev Mol Cell Biol. 2006;7:373–378. doi: 10.1038/nrm1912. [DOI] [PubMed] [Google Scholar]
- 8.Kadereit B, Kumar P, Wang WJ, Miranda D, Snapp EL, Severina N, Torregroza I, Evans T, Silver DL. Evolutionarily conserved gene family important for fat storage. Proc Natl Acad Sci U S A. 2008;105:94–99. doi: 10.1073/pnas.0708579105. [DOI] [PMC free article] [PubMed] [Google Scholar]
- 9.Ben M’barek K, Ajjaji D, Chorlay A, Vanni S, Foret L, Thiam AR. ER Membrane Phospholipids and Surface Tension Control Cellular Lipid Droplet Formation. Dev Cell. 2017 doi: 10.1016/j.devcel.2017.05.012. [DOI] [PubMed] [Google Scholar]
- 10.Adeyo O, Horn PJ, Lee S, Binns DD, Chandrahas A, Chapman KD, Goodman JM. The yeast lipin orthologue Pah1p is important for biogenesis of lipid droplets. J Cell Biol. 2011;192:1043–1055. doi: 10.1083/jcb.201010111. [DOI] [PMC free article] [PubMed] [Google Scholar]
- 11.Skinner JR, Shew TM, Schwartz DM, Tzekov A, Lepus CM, Abumrad NA, Wolins NE. Diacylglycerol enrichment of endoplasmic reticulum or lipid droplets recruits perilipin 3/TIP47 during lipid storage and mobilization. J Biol Chem. 2009;284:30941–30948. doi: 10.1074/jbc.M109.013995. [DOI] [PMC free article] [PubMed] [Google Scholar]
- 12.Kassan A, Herms A, Fernandez-Vidal A, Bosch M, Schieber NL, Reddy BJ, Fajardo A, Gelabert-Baldrich M, Tebar F, Enrich C, et al. Acyl-CoA synthetase 3 promotes lipid droplet biogenesis in ER microdomains. J Cell Biol. 2013;203:985–1001. doi: 10.1083/jcb.201305142. [DOI] [PMC free article] [PubMed] [Google Scholar]
- 13.Choudhary V, Ojha N, Golden A, Prinz WA. A conserved family of proteins facilitates nascent lipid droplet budding from the ER. J Cell Biol. 2015;211:261–271. doi: 10.1083/jcb.201505067. [DOI] [PMC free article] [PubMed] [Google Scholar]
- 14.Mishra S, Khaddaj R, Cottier S, Stradalova V, Jacob C, Schneiter R. Mature lipid droplets are accessible to ER luminal proteins. J Cell Sci. 2016;129:3803–3815. doi: 10.1242/jcs.189191. [DOI] [PubMed] [Google Scholar]
- 15.Zimmerberg J, Kozlov MM. How proteins produce cellular membrane curvature. Nat Rev Mol Cell Biol. 2006;7:9–19. doi: 10.1038/nrm1784. [DOI] [PubMed] [Google Scholar]
- 16.Markin VS. Lateral organization of membranes and cell shapes. Biophys J. 1981;36:1–19. doi: 10.1016/S0006-3495(81)84713-3. [DOI] [PMC free article] [PubMed] [Google Scholar]
- 17.Goyal U, Blackstone C. Untangling the web: mechanisms underlying ER network formation. Biochim Biophys Acta. 2013;1833:2492–2498. doi: 10.1016/j.bbamcr.2013.04.009. [DOI] [PMC free article] [PubMed] [Google Scholar]
- 18.Westrate LM, Lee JE, Prinz WA, Voeltz GK. Form follows function: the importance of endoplasmic reticulum shape. Annu Rev Biochem. 2015;84:791–811. doi: 10.1146/annurev-biochem-072711-163501. [DOI] [PubMed] [Google Scholar]
- 19.Helfrich W. Elastic Properties of Lipid Bilayers: Theory and Possible Experiments. Z Naturforsch. 1973;28c:693–703. doi: 10.1515/znc-1973-11-1209. [DOI] [PubMed] [Google Scholar]
- 20.Jacquier N, Choudhary V, Mari M, Toulmay A, Reggiori F, Schneiter R. Lipid droplets are functionally connected to the endoplasmic reticulum in Saccharomyces cerevisiae. J Cell Sci. 2011;124:2424–2437. doi: 10.1242/jcs.076836. [DOI] [PubMed] [Google Scholar]
- 21.Yang L, Ding Y, Chen Y, Zhang S, Huo C, Wang Y, Yu J, Zhang P, Na H, Zhang H, et al. The proteomics of lipid droplets: structure, dynamics, and functions of the organelle conserved from bacteria to humans. J Lipid Res. 2012;53:1245–1253. doi: 10.1194/jlr.R024117. [DOI] [PMC free article] [PubMed] [Google Scholar]
- 22.Gross DA, Zhan CY, Silver DL. Direct binding of triglyceride to fat storage-inducing transmembrane proteins 1 and 2 is important for lipid droplet formation. Proceedings of the National Academy of Sciences of the United States of America. 2011;108:19581–19586. doi: 10.1073/pnas.1110817108. [DOI] [PMC free article] [PubMed] [Google Scholar]
- 23.Santos-Rosa H, Leung J, Grimsey N, Peak-Chew S, Siniossoglou S. The yeast lipin Smp2 couples phospholipid biosynthesis to nuclear membrane growth. Embo Journal. 2005;24:1931–1941. doi: 10.1038/sj.emboj.7600672. [DOI] [PMC free article] [PubMed] [Google Scholar]
- 24.Grillitsch K, Connerth M, Kofeler H, Arrey TN, Rietschel B, Wagner B, Karas M, Daum G. Lipid particles/droplets of the yeast Saccharomyces cerevisiae revisited: Lipidome meets Proteome. Biochimica Et Biophysica Acta-Molecular and Cell Biology of Lipids. 2011;1811:1165–1176. doi: 10.1016/j.bbalip.2011.07.015. [DOI] [PMC free article] [PubMed] [Google Scholar]
- 25.Han GS, O’Hara L, Carman GM, Siniossoglou S. An unconventional diacylglycerol kinase that regulates phospholipid synthesis and nuclear membrane growth. Journal of Biological Chemistry. 2008;283:20433–20442. doi: 10.1074/jbc.M802903200. [DOI] [PMC free article] [PubMed] [Google Scholar]
- 26.Kodaki T, Yamashita S. Characterization of the methyltransferases in the yeast phosphatidylethanolamine methylation pathway by selective gene disruption. Eur J Biochem. 1989;185:243–251. doi: 10.1111/j.1432-1033.1989.tb15109.x. [DOI] [PubMed] [Google Scholar]
- 27.Sandager L, Gustavsson MH, Stahl U, Dahlqvist A, Wiberg E, Banas A, Lenman M, Ronne H, Stymne S. Storage lipid synthesis is non-essential in yeast. J Biol Chem. 2002;277:6478–6482. doi: 10.1074/jbc.M109109200. [DOI] [PubMed] [Google Scholar]
- 28.Baron CL, Malhotra V. Role of diacylglycerol in PKD recruitment to the TGN and protein transport to the plasma membrane. Science. 2002;295:325–328. doi: 10.1126/science.1066759. [DOI] [PubMed] [Google Scholar]
- 29.Kim YJ, Guzman-Hernandez ML, Balla T. A highly dynamic ER-derived phosphatidylinositol-synthesizing organelle supplies phosphoinositides to cellular membranes. Dev Cell. 2011;21:813–824. doi: 10.1016/j.devcel.2011.09.005. [DOI] [PMC free article] [PubMed] [Google Scholar]
- 30.Maeda Y, Beznoussenko GV, Van Lint J, Mironov AA, Malhotra V. Recruitment of protein kinase D to the trans-Golgi network via the first cysteine-rich domain. EMBO J. 2001;20:5982–5990. doi: 10.1093/emboj/20.21.5982. [DOI] [PMC free article] [PubMed] [Google Scholar]
- 31.Zanghellini J, Wodlei F, von Grunberg HH. Phospholipid demixing and the birth of a lipid droplet. J Theor Biol. 2010;264:952–961. doi: 10.1016/j.jtbi.2010.02.025. [DOI] [PubMed] [Google Scholar]
- 32.Parks LW, Bottema CD, Rodriguez RJ, Lewis TA. Yeast sterols: yeast mutants as tools for the study of sterol metabolism. Methods Enzymol. 1985;111:333–346. doi: 10.1016/s0076-6879(85)11020-7. [DOI] [PubMed] [Google Scholar]
- 33.Vaden DL, Gohil VM, Gu Z, Greenberg ML. Separation of yeast phospholipids using one-dimensional thin-layer chromatography. Anal Biochem. 2005;338:162–164. doi: 10.1016/j.ab.2004.11.020. [DOI] [PubMed] [Google Scholar]
- 34.Ejsing CS, Sampaio JL, Surendranath V, Duchoslav E, Ekroos K, Klemm RW, Simons K, Shevchenko A. Global analysis of the yeast lipidome by quantitative shotgun mass spectrometry. Proc Natl Acad Sci U S A. 2009;106:2136–2141. doi: 10.1073/pnas.0811700106. [DOI] [PMC free article] [PubMed] [Google Scholar]
- 35.Teixeira V, Johnsen L, Martinez-Montanes F, Grippa A, Buxo L, Idrissi FZ, Ejsing CS, Carvalho P. Regulation of lipid droplets by metabolically controlled Ldo isoforms. J Cell Biol. 2018;217:127–138. doi: 10.1083/jcb.201704115. [DOI] [PMC free article] [PubMed] [Google Scholar]
- 36.Spivak M. A comprehensive introduction to differential geometry. Brandeis University; 1970. [Google Scholar]
- 37.Parsegian VA. Van der Waals forces. Cambridge: Cambridge University Press; 2006. [Google Scholar]
- 38.Wilfling F, Wang H, Haas JT, Krahmer N, Gould TJ, Uchida A, Cheng JX, Graham M, Christiano R, Frohlich F, et al. Triacylglycerol synthesis enzymes mediate lipid droplet growth by relocalizing from the ER to lipid droplets. Dev Cell. 2013;24:384–399. doi: 10.1016/j.devcel.2013.01.013. [DOI] [PMC free article] [PubMed] [Google Scholar]
- 39.Wang CW, Miao YH, Chang YS. Control of lipid droplet size in budding yeast requires the collaboration between Fld1 and Ldb16. J Cell Sci. 2014;127:1214–1228. doi: 10.1242/jcs.137737. [DOI] [PubMed] [Google Scholar]
- 40.Khandelia H, Duelund L, Pakkanen KI, Ipsen JH. Triglyceride blisters in lipid bilayers: implications for lipid droplet biogenesis and the mobile lipid signal in cancer cell membranes. PLoS One. 2010;5:e12811. doi: 10.1371/journal.pone.0012811. [DOI] [PMC free article] [PubMed] [Google Scholar]
- 41.Long AP, Manneschmidt AK, VerBrugge B, Dortch MR, Minkin SC, Prater KE, Biggerstaff JP, Dunlap JR, Dalhaimer P. Lipid droplet de novo formation and fission are linked to the cell cycle in fission yeast. Traffic. 2012;13:705–714. doi: 10.1111/j.1600-0854.2012.01339.x. [DOI] [PubMed] [Google Scholar]
- 42.Rand RP, Fuller NL. Structural dimensions and their changes in a reentrant hexagonal-lamellar transition of phospholipids. Biophys J. 1994;66:2127–2138. doi: 10.1016/S0006-3495(94)81008-2. [DOI] [PMC free article] [PubMed] [Google Scholar]
- 43.Brakke KA. The Surface Evolver. Experimental Mathematics. 1992;1:141–165. [Google Scholar]
- 44.Dreier L, Rapoport TA. In vitro formation of the endoplasmic reticulum occurs independently of microtubules by a controlled fusion reaction. J Cell Biol. 2000;148:883–898. doi: 10.1083/jcb.148.5.883. [DOI] [PMC free article] [PubMed] [Google Scholar]
- 45.Shibata Y, Hu J, Kozlov MM, Rapoport TA. Mechanisms shaping the membranes of cellular organelles. Annu Rev Cell Dev Biol. 2009;25:329–354. doi: 10.1146/annurev.cellbio.042308.113324. [DOI] [PubMed] [Google Scholar]
- 46.Prinz WA, Grzyb L, Veenhuis M, Kahana JA, Silver PA, Rapoport TA. Mutants affecting the structure of the cortical endoplasmic reticulum in Saccharomyces cerevisiae. J Cell Biol. 2000;150:461–474. doi: 10.1083/jcb.150.3.461. [DOI] [PMC free article] [PubMed] [Google Scholar]
- 47.Terasaki M, Chen LB, Fujiwara K. Microtubules and the endoplasmic reticulum are highly interdependent structures. J Cell Biol. 1986;103:1557–1568. doi: 10.1083/jcb.103.4.1557. [DOI] [PMC free article] [PubMed] [Google Scholar]
- 48.Fairn GD, Schieber NL, Ariotti N, Murphy S, Kuerschner L, Webb RI, Grinstein S, Parton RG. High-resolution mapping reveals topologically distinct cellular pools of phosphatidylserine. J Cell Biol. 2011;194:257–275. doi: 10.1083/jcb.201012028. [DOI] [PMC free article] [PubMed] [Google Scholar]
- 49.Wilfling F, Thiam AR, Olarte MJ, Wang J, Beck R, Gould TJ, Allgeyer ES, Pincet F, Bewersdorf J, Farese RV, Jr, et al. Arf1/COPI machinery acts directly on lipid droplets and enables their connection to the ER for protein targeting. Elife. 2014;3:e01607. doi: 10.7554/eLife.01607. [DOI] [PMC free article] [PubMed] [Google Scholar]
- 50.Thiam AR, Foret L. The physics of lipid droplet nucleation, growth and budding. Biochim Biophys Acta. 2016;1861:715–722. doi: 10.1016/j.bbalip.2016.04.018. [DOI] [PubMed] [Google Scholar]
Associated Data
This section collects any data citations, data availability statements, or supplementary materials included in this article.