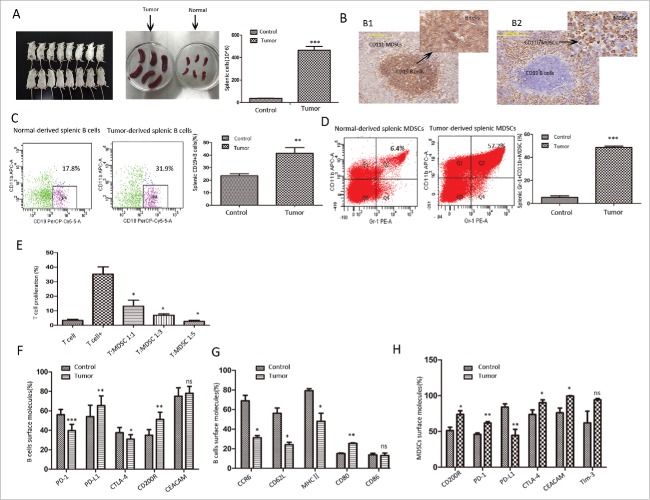
Figure 1.
The concurrent increases of MDSCs and B cells in breast cancer mice and surface molecules of splenic B cells and MDSCs in tumor or normal mice. Wide-type BALB/c mice were injected subcutaneously with 1 × 10⁶ 4T1 murine breast cancer cells, and were sacrificed at day 21 after tumor inoculation. (A) The brief descriptions of tumor-bearing status were shown in the left and middle panel. The overall splenic cells were analyzed from tumor-bearing and tumor-free mice (right panel). (B) Paraffin-embedded spleen tissues were collected from tumor-bearing mice to detect CD19+B cells (left panel) and CD11b+ MDSCs (right panel) by IHC staining (original magnification × 200 and × 400). (C) The percentage of B cells was detected using anti-CD19 Ab from tumor and normal splenic cells. (D) Splenic MDSCs were stained for CD11b and Gr-1, and detected by FC (right panel). The percentages are indicated in the representative dot plots (left two panels). (E) Isolated splenic MDSCs were assessed for their ability to suppress CD3+ T-cell proliferation at a 1:1, 3:1 or 5:1 of Gr-1+CD11b+cell: T-cell ratio. (F) FC analysis of immune checkpoint molecules including PD-1, PD-L1, CTLA-4, Tim-3, CD200R and CEACAM showing their expression frequencies in B cells. (G) Expression of the co-stimulatory molecules and activation markers including CD80, CD86, MHC II, CCR6 and CD62L on the surface of splenic CD19+ B cells from 4T1 tumor-bearing and control mice. (H) Immune checkpoint molecules on MDSCs were measured by FC from normal and tumor-bearing mice. The results are shown as the mean±SEM from five independent experiments with 8 mice per group per experiment. The t test or One-way ANOVA analysis were used for statistical analysis.* = P < 0.05, ** = P < 0.01, *** = P < 0.001, ns = not significant. FC, flow cytometry; MDSC, Myeloid-derived suppressor cells; IHC, immunohistochemistry.

