Figure 3.

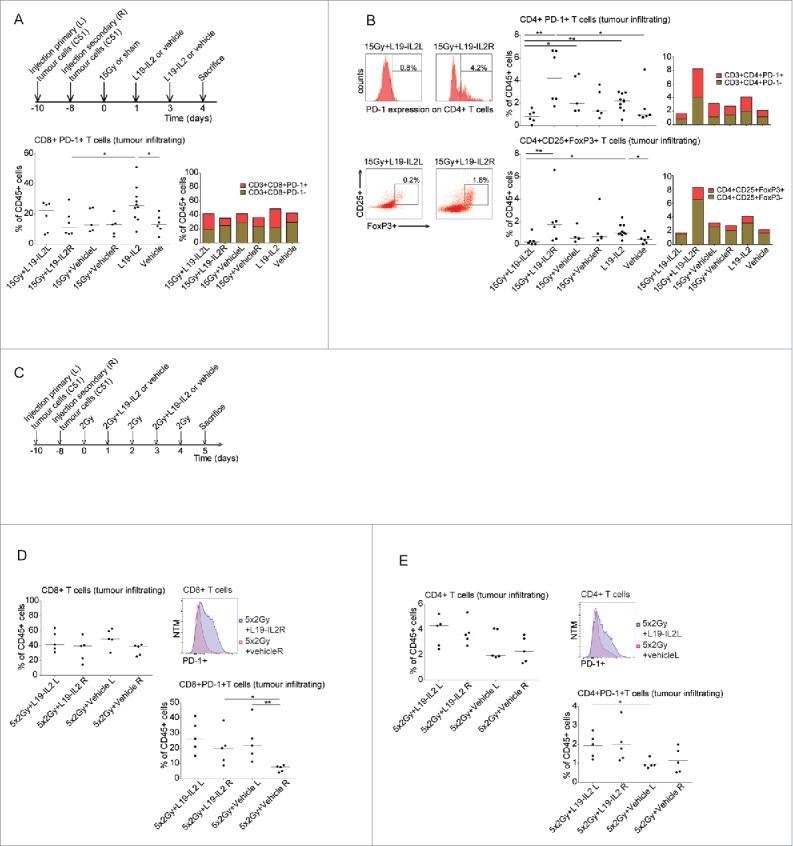
Co-expression of immune suppressive receptors on T cells. (A) Treatment schedule for the evaluation of immunological parameters in single dose irradiation experiments, percentage of intratumoural CD8+PD-1+ cells of the CD45+ cells and median percentages of PD-1+ and PD-1− within the CD8+ T cell population. (B) Representative FACS histogram and dotplot, percentage of intratumoural CD4+PD-1+ cells and CD4+CD25+FoxP3+ T cells of CD45+ cells in different treatment groups and median percentages of PD-1+ and PD-1− or CD25+FoxP3+ and CD25+FoxP3− within the CD4+ T cell population. (C) Treatment schedule for the evaluation of immunological parameters in fractionated irradiation experiments. (D) Quantification of CD8+ T cells of gated CD45+ tumour infiltrating cells, FACS histogram of PD-1 expression on tumour infiltrating CD8+ T cells and quantification of CD8+PD-1+ cells. (E) Quantification of CD4+ T cells of gated CD45+ tumour infiltrating cells, FACS histogram of PD-1 expression on tumour infiltrating CD4+ T cells and quantification of CD4+PD-1+ cells. NTM: Normalized to Mode. *p<0.05, **p<0.01. Bars represent median.
