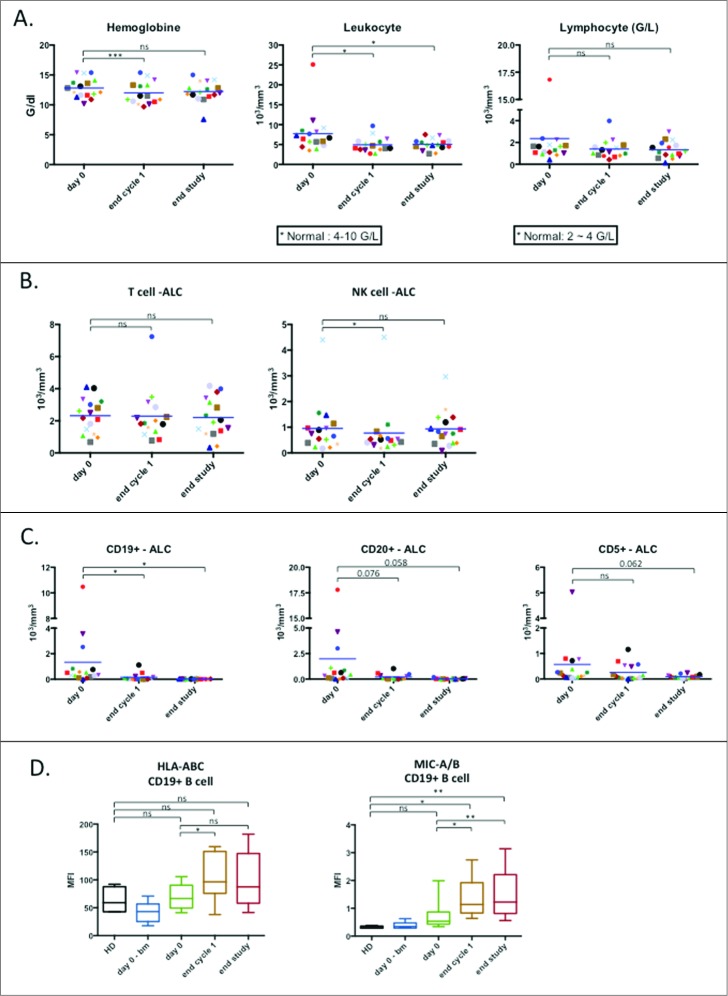
Figure 1.
Effect of treatment on lymphocyte populations. (A) Absolute values of hemoglobin (left), total leukocyte count (middle) and total lymphocyte count (right) are reported as before the first induction (day 0), after first round of treatment (end cycle 1) and after the final round of treatment (end study) respectively (n = 16). (B) Absolute count of T lymphocyte (CD3+CD56-) population and NK cell (CD3-CD56+) populations from total PBMC (n = 16). (C) Absolute count of lymphocyte populations carrying specific markers associated with B-cell lymphoma (n = 16). (D) Expression of HLA and the stress ligands MIC-A and MIC-B on CD19+ population in term of mean fluorescence intensity (HD: n = 4; patients: n = 10). Significance was determined by paired t-test between day 0 versus following time-points, and one-way ANOVA between HD and patients at every time-points with * p ≤ 0.05, ** p ≤ 0.01 and *** p ≤ 0.001.

