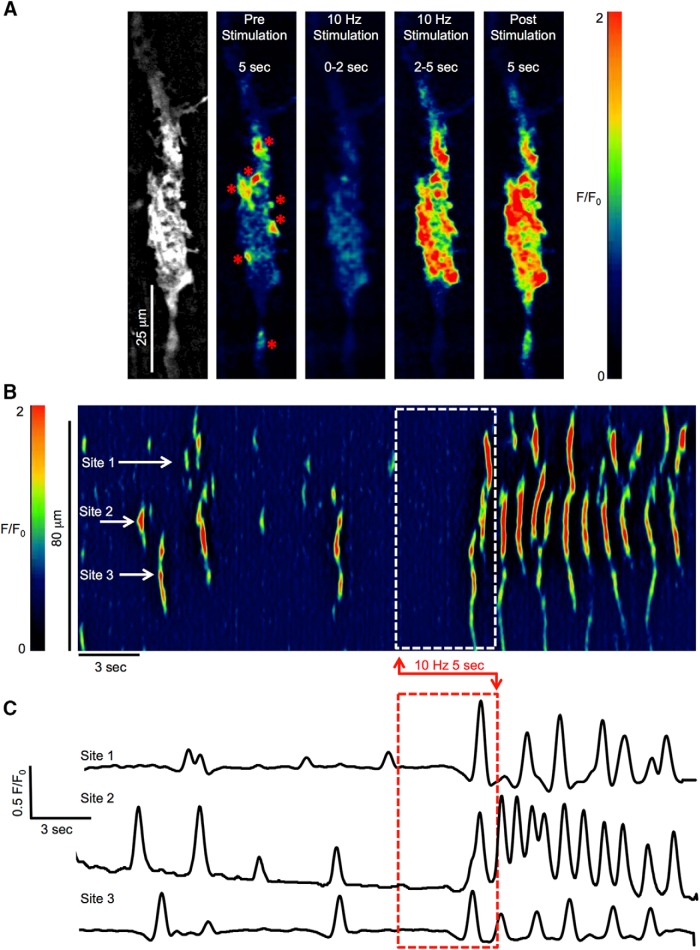
Figure 1.
ICC-DMP Ca2+ transient responses to nerve stimulation. A, Time-lapse montage showing postjunctional Ca2+ responses to EFS (10 Hz; 0.5-ms duration; 5 s) on an ICC-DMP in situ. An image of the GCaMP3 signal in the cell is shown in the leftmost panel. Scale bar for all panels: 25 μm. A color-coded overlay and calibration scale was imported to depict fluorescence intensity (F/F0) and enhance visualization of Ca2+ sites. Low fluorescence areas are indicated in dark blue or black. High-intensity fluorescence areas are indicated in red and orange. The “pre stimulation” panel shows a summed image of Ca2+ activity within the cell for 5 s before the onset of EFS, Ca2+ firing sites are marked with red asterisks. Panels showing the summed Ca2+ activity for the initial 2 s of EFS, the final 3 s of EFS and 5-s post-EFS are also shown. B, Representative ST map of Ca2+ transients in ICC-DMP shown in A. EFS duration is indicated by the dashed white box. The firing activities of three sites highlighted on the ST map are plotted in C, and the timing of EFS is indicated by the dashed red box.

