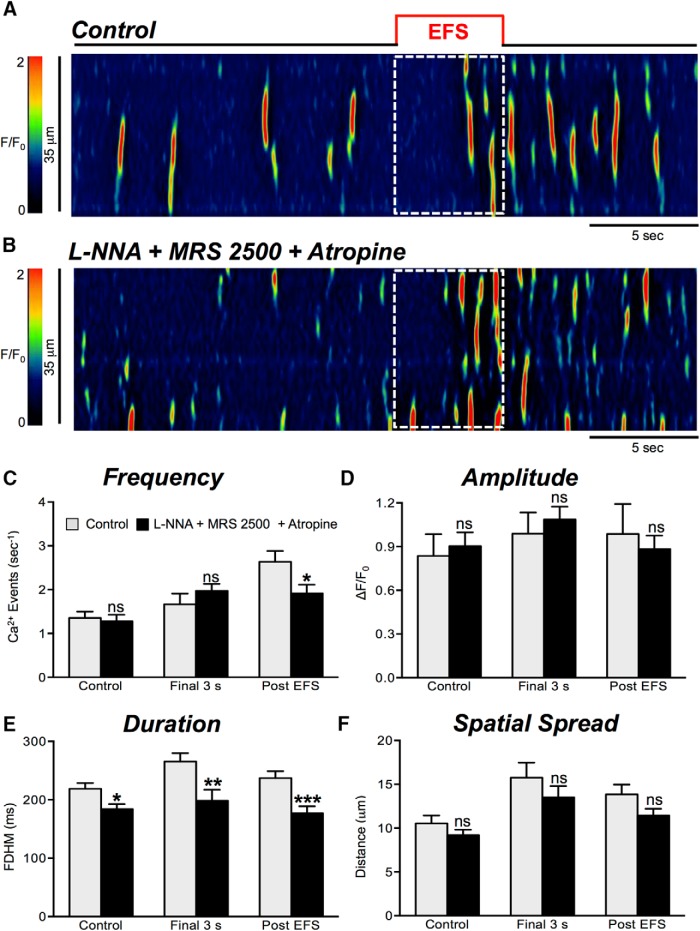
Figure 11.
Excitatory responses are modestly reduced by atropine. A, B, Representative ST maps showing the inhibitory effects of atropine (1 μM) on responses to EFS (10 Hz; 5 s; indicated by the red line and dotted white box in ST maps). In this experiment L-NNA (100 μM) and the P2Y1 receptor antagonist, MRS 2500 (1 μM), were present. C–F, Summary data showing the effects of a combination of L-NNA (100 μM), MRS 2500 (1 μM), and atropine (1 μM) on Ca2+ transient frequency (C), amplitude (D), duration (E), and spatial spread (F) in ICC-DMP during the control period, during the final 3 s of EFS, and during the post-EFS period (5 s), n = 7, c = 26; ns = p > 0.05, **p < 0.01, ***p < 0.001.

