Abstract
Wax synthase (WS, fatty acyl-coenzyme A [coA]: fatty alcohol acyltransferase) catalyzes the final step in the synthesis of linear esters (waxes) that accumulate in seeds of jojoba (Simmondsia chinensis). We have characterized and partially purified this enzyme from developing jojoba embryos. A protein whose presence correlated with WS activity during chromatographic fractionation was identified and a cDNA encoding that protein was cloned. Seed-specific expression of the cDNA in transgenic Arabidopsis conferred high levels of WS activity on developing embryos from those plants. The WS sequence has significant homology with several Arabidopsis open reading frames of unknown function. Wax production in jojoba requires, in addition to WS, a fatty acyl-CoA reductase (FAR) and an efficient fatty acid elongase system that forms the substrates preferred by the FAR. We have expressed the jojoba WS cDNA in Arabidopsis in combination with cDNAs encoding the jojoba FAR and a β-ketoacyl-CoA synthase (a component of fatty acid elongase) from Lunaria annua. 13C-Nuclear magnetic resonance analysis of pooled whole seeds from transgenic plants indicated that as many as 49% of the oil molecules in the seeds were waxes. Gas chromatography analysis of transmethylated oil from individual seeds suggested that wax levels may represent up to 70% (by weight) of the oil present in those seeds.
Waxes (oxygen esters of primary fatty alcohols and fatty acids) are synthesized in a wide range of microorganisms (Kahn and Kolattukudy, 1973; Russell, 1974; DeWitt et al., 1982) and in specialized tissues of higher plants and animals (Yermanos, 1975; Kolattukudy and Rogers, 1978, 1986; Ting et al., 1998). These waxes fill a number of functions, including energy storage, protection of exposed surfaces from desiccation, buoyant density regulation, and formation of external structural elements. The biochemistry of wax formation has been characterized in tissues from diverse sources (Kahn and Kolattukudy, 1973; Kolattukudy and Rogers, 1978, 1986; Wu et al., 1981). In all of these examples, the final step in wax biosynthesis is the transfer of an acyl chain from fatty acyl-coenzyme A (CoA) to a fatty alcohol. This reaction is catalyzed by fatty acyl-CoA: fatty alcohol acyltransferase (wax synthase, WS). The substrates for these enzymes are lipophilic and it is presumed that they are integral membrane proteins. Although several WS have been described in terms of their substrate preferences and their intracellular location, very little is known about the proteins associated with this activity or the genes that encode them. Shockey et al. (1995) reported the use of a photoreactive analog of acyl-CoA in an attempt to affinity label the WS in developing jojoba (Simmondsia chinensis) embryos. Their method tagged a 57-kD microsomal protein that they suggested may be the WS. The data we present here contradict their conclusions.
We have also chosen developing jojoba seeds as a system for the study of wax synthesis. This desert shrub is unusual in that its seed storage lipids are waxes rather than the triacylglycerols (TAG) found in other plants. These waxes are esters of very-long-chain (chain lengths greater than 18 carbons), monounsaturated, fatty acids and fatty alcohols (Miwa, 1971). Wax synthesis occurs in the cytoplasm of developing embryo cells using the oleic acid product of the plastidial fatty acid synthesis system (Ohlrogge et al., 1978; Pollard et al., 1979; Wu et al., 1981). In jojoba embryos, three key enzymatic activities are required for conversion of the CoA ester of oleic acid into wax. Fatty acyl-CoA reductase (FAR) carries out the reduction of acyl-CoA to yield fatty alcohols (Metz et al., 2000).
The FAR of jojoba embryos shows a strong preference for very-long-chain acyl-CoA substrates, and the developing embryo contains an efficient fatty acyl-CoA elongase (FAE) system that supplies these substrates (Lassner et al., 1996). The FAE system in plants is thought to consist of four separable enzymes: β-ketoacyl-CoA synthase (KCS), β-ketoacyl-CoA reductase, β-hydroxyl-CoA dehydrase, and β-enoyl-CoA reductase. Of these four enzymatic steps, the first one, catalyzed by KCS, is thought to play a key role in the determination of the overall extent and rate of the elongation process (Lassner et al., 1996; Millar and Kunst, 1997). Finally, WS transfers an acyl moiety from a second acyl-CoA to the fatty alcohol to form the wax molecule. We describe the purification of a membrane-associated WS from seeds of developing jojoba embryos, and the cloning of the cDNA that encodes that enzyme. The identity of the cDNA clone was confirmed by detection of WS activity in developing seeds of Arabidopsis expressing the gene and by the high levels of wax found in the mature seeds. To our knowledge, our report is the first direct identification of a protein (and a nucleic acid sequence encoding such a protein) associated with this type of WS activity.
In addition to our interest in adding to the knowledge of wax biosynthesis, we hope to exploit this information to produce waxes in an agronomically suitable oilseed crop. Long-chain liquid waxes possess unique physical properties that render them useful for a wide range of applications in cosmetic formulations, food products, and industrial lubricants. The high price of jojoba oil has limited its use to cosmetic applications. Transfer of a wax synthesis pathway to a crop more amenable to large-scale agriculture could provide an economical source of a new feedstock for large-scale industrial applications such as biodegradable lubricants. By expressing jojoba WS in combination with jojoba FAR and a KCS from Lunaria annua (a plant that accumulates large amounts of very-long-chain fatty acids in its seed oil), we obtained high levels of wax in transgenic seeds. We anticipate that these transgenes can also be used to obtain commercial levels of wax in transgenic rapeseed oil.
MATERIALS AND METHODS
Plant Materials
Developing embryos of jojoba (Simmondsia chinensis) were harvested and stored as described in Lassner et al. (1996). Arabidopsis race Nossen (No-0) was used for transgenic expression.
Enzyme Assays
WS activity in microsomal membrane preparations was measured by incubation of 40 μm [1-14C]acyl-CoA (usually palmitoyl-CoA, specific activity 5.1–5.6 mCi/mmol) and 200 μm oleoyl alcohol in a total volume of 0.25 mL. The incubation mixture also contained 25 mm N-[2-hydroxy-1,1-Bis(hydroxymethyl)ethyl]glycine (Tricine)-NaOH (pH 7.8), 0.28 m NaCl, 10% (w/v) glycerol, and 2 mm β-mercaptoethanol. Incubation was carried out at 30°C for up to 1 h, then terminated by adding 0.25 mL of isopropanol:acetic acid (4:1, v/v). Unlabeled wax esters (0.1 mg) and oleyl alcohol (0.1 mg) were added as carriers. Neutral lipids were extracted by a scaled-down protocol of Hara and Radin (1978). Hexane:isopropanol (3:2, v/v; 2 mL) and 1 mL of aqueous sodium sulfate (6.6%, w/v) were added, and the products were recovered in the organic phase.
Solubilized WS was assayed using up to 50 μL of sample in a 250-μL assay that contained 40 μm [1-14C]16:0-CoA (5 Ci/mol), 200 μm C18:1-OH, 0.07% (w/v) soybean phospholipid (P-3644, Sigma-Aldrich, St. Louis), 0.2% (w/v) 3-[(3-cholamidopropyl)-dimethylammonio]-1-propane- sulfonate (CHAPS), 280 mm NaCl, 25 mm Tricine-NaOH (pH 7.8), 2 mm β-mercaptoethanol, and 5.6% (w/v) glycerol. Phospholipid (3.5 μL of a 50 mg/mL suspension in 0.5% [w/v] CHAPS) was added directly to the sample containing 1% (w/v) CHAPS, then diluted by a cocktail containing the remaining assay components, resulting in a final CHAPS:phospholipid ratio of 2.8:1. Processing of the samples was performed as described for non-solubilized samples.
A known percentage of the organic phase was removed and counted via liquid scintillation counting to determine the total radioactivity in the organic phase. The remainder of the organic phase was transferred to a new vial and dried under nitrogen gas. The lipid residue was resuspended in a small volume of hexane, applied to a silica gel-G thin-layer chromatography (TLC) plate, and developed in hexane:diethyl ether:acetic acid (80:20:1, v/v). The distribution of radioactivity between the lipid classes was measured using a radioanalytic imaging system (Scanalytics, Billerica, MA) to determine the portion of radioactivity present in the wax fraction.
Microsomal Preparation, Solubilization, and Chromatography
Microsomal membrane preparation, enzyme solubilization, and chromatography through Blue A agarose (Cibacron Blue, Amicon, Beverly, MA) were carried out as described in Lassner et al. (1996). The WS was purified in a buffer containing 25 mm Tricine/NaOH (pH 7.8), 1% (w/v) CHAPS, and 20% (w/v) glycerol (buffer A). The eluate from the Blue A column was concentrated 5-fold and divided into two pools. Each pool was applied to a ceramic hydroxyapatite (HA) column (0.75 × 5 cm, Bio-Gel CHT-2, Bio-Rad Laboratories, Hercules, CA) equilibrated in buffer A containing 2.0 m NaCl. The column was washed with equilibration buffer, and bound proteins were eluted with equilibration buffer containing 0.1 m potassium phosphate. The majority of WS activity did not bind the column. Fractions containing WS activity from the two ceramic HA columns were pooled and concentrated 10-fold by ultrafiltration in a pressure cell fitted with a membrane (YM30, Amicon). The concentrate was applied to a Sephacryl S100 HR (Amersham-Pharmacia Biotech, Uppsala) column (2.5 × 90 cm) equilibrated with buffer A containing 1 m NaCl (buffer B).
Molecular mass standards used to generate a calibration curve were chromatographed under the same buffer and column conditions. Fractions from the retained portion of the column that contained high levels of WS activity (65 through 70) were pooled and applied to a Bio-Gel HT (Bio-Rad) column (1 × 19 cm) equilibrated with buffer B. The column was washed with buffer B, and bound proteins were eluted with buffer B containing 0.1 m potassium phosphate. Proteins present in the various fractions were separated by SDS-PAGE on a 10% to 13% acrylamide gel and visualized using a silver stain (Blum et al., 1987). Examination of the gel showed a single protein with an apparent mass of 33 kD, whose staining intensity correlated with WS activity.
33-kD Protein: Purification and Microsequencing
Fractions from the final Bio-Gel HT column having maximal WS activity were either concentrated using ultrafiltration or precipitated with 8% (w/v) trichloroacetic acid. Proteins were separated by SDS-PAGE and stained with Coomassie Blue. The 33-kD WS candidate band was excised from the gel and destained in 50% (w/v) ethanol for 3 × 20 min. Microsequencing was conducted by the W.M. Keck Foundation (Yale University, New Haven, CT). Their methodology included in-gel digestion of the protein using trypsin and HPLC purification of the resulting peptides.
cDNA Isolation and Generation of Transgenic Plants
RNA isolation and PCR techniques were previously described (Metz et al., 2000). The original WS PCR product was obtained using primers GAYGAYCCNWSNAAYGAYCA and TTYTGNGTRTARTTRAACAT to amplify a 700-nucleotide PCR product from first-strand cDNA. The sequence of the 700-nucleotide PCR product was used to design a primer to amplify the 5′ and 3′ ends of the cDNA using a kit (Marathon, CLONTECH Laboratories, Palo Alto, CA). GATTTGCCTCATTTGTGATCTCGGTGCT was used as a gene-specific primer to amplify the 3′ end of the cDNA, and AACAACCACCCTCCAGTCACCATCACGAAC was used as a gene-specific primer to amplify the 5′ end of the cDNA. After assembly to determine the full-length sequence of the cDNA, the open reading frame (ORF) was PCR amplified using the primers GGATCCG- TCGACACAATGGAGGTGGAGAAGGAGCTAAAG and GCATGCAGATCTCACCACCCCAACAAACCCATC.
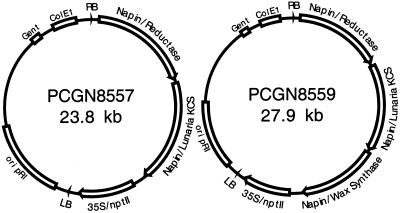
Two plant binary vectors were constructed (Fig. 7) using the strategy described by Metz et al. (2000). Plasmid pCGN8559 contains three genes necessary for wax biosynthesis: the Lunaria annua KCS (Lassner, 1997), which is involved in fatty acid elongation of monounsaturated fatty acids from 18 carbons to lengths up to 24 carbons; the jojoba FAR, which is involved in the formation of fatty alcohols; and the newly isolated WS. A control plasmid, pCGN8557, contains the KCS and FAR genes. Each of the genes is under the control of napin regulatory sequences (Kridl et al., 1991). The binary vectors were introduced into Agrobacterium tumefaciens EHA105 via electroporation. The vectors were used to transform Arabidopsis using floral dip (Clough and Bent, 1998). Seeds were collected mid-maturation for biochemical analysis and at maturity for lipid analysis.
Figure 7.
Maps of plasmids used to transform Arabidopsis. The T-DNA from plasmid pCGN8557 contains a jojoba acyl-CoA reductase gene and a L. annua KCS gene under control of napin regulatory sequences. The T-DNA from pCGN8559 also contains the jojoba WS gene. RB, Right T-DNA border; Napin, 5′ and 3′ regulatory sequences flanking the indicated gene; 35S/nptII, gene fusion containing neomycin phosphotransferase under control of a cauliflower mosaic virus 35S promoter; LB, left T-DNA border; ori pRi, Agrobacterium rhizogenes pRI origin of replication; Gent, gentamycin resistance gene; and ColE1, ColE1 plasmid origin of replication.
Oil Analysis: TLC and Gas Chromatography (GC)
Oil was extracted from mature Arabidopsis seeds by homogenizing in hexane using a mortar and pestle. The hexane was evaporated under nitrogen gas and the oil was resuspended in hexane at a concentration of 10 mg/mL. A portion of the extract was spotted on a silica gel-G TLC plate, which was developed in hexane:diethyl ether:acetic acid (80:20:1, v/v). Lipids were stained by exposure to iodine vapor. The oil extracts were also analyzed for fatty acyl and fatty alcohol composition and content by GC (Browse et al., 1986) and are reported on a mol % basis.
13C-NMR Spectroscopy
High-resolution 13C spectroscopy was performed at 11.7 T (13C = 125 MHz) on 25- to 30-mg intact mature seed using NMR spectrometers (Varian, Palo Alto, CA) equipped with carbon-observe magic-angle spinning nanoprobes (Hutton et al., 1999). Spectra were acquired without a field frequency lock at ambient temperature (approximately 21°C−22°C) in 1 to 14 h using the following conditions: spectral width = 29.996 kHz, acquisition time = 2.185 s, π/2 pulse (3.8 ms) with no relaxation delay, 1H γB2 = 2.5 kHz (Waltz decoupling). Data processing conditions were typically digital resolution = 0.38 Hz, 0.5- to 2-Hz line broadening, and time-reversed linear prediction of the first three data points. Chemical shifts are referenced by adding neat tetramethylsilane to seeds and using the resulting referencing parameters for subsequent spectra. The 13C resolution is 2 to 3 Hz for the sharpest seed resonance. Seed resolution is independent of magic-angle spinning speeds (2.0–3.5 kHz), and data are typically obtained with 2.0 to 2.5 kHz. Data from 13C spectroscopy are reported on a mol % basis.
RESULTS
Characterization of the Jojoba WS
The jojoba WS was purified from a membrane fraction isolated from embryos collected during the time of maximal wax production. Pollard et al. (1979) and Wu et al. (1981) reported that the WS and FAR activity of jojoba embryos was exclusively associated with a wax pad formed upon centrifugation (12,000g) of a cell-free homogenate. We also detected activity in the floating wax pad; however, using our method of preparation, the majority of the activity was detected in the supernatant fraction after moderate speed centrifugation. This activity could then be sedimented by a high-speed centrifugation step typically used in the preparation of a microsomal membrane fraction.
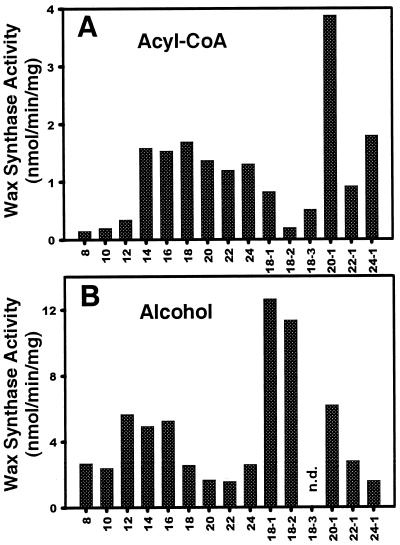
Several characteristics of the jojoba embryo WS activity in cell-free extracts were presented in Pollard et al. (1979) and Wu et al. (1981), including comparative assays with selected alcohol and fatty acyl-CoA substrates. We tested an extended set of fatty alcohols and fatty acyl-CoA using a microsomal membrane fraction (Fig. 1). The primary wax ester found in jojoba oil consists of a C20:1 acyl group combined with a C22:1 alcohol. Our in vitro assays suggest C20:1 acyl-CoA is the preferred substrate of the enzyme (Fig. 1A). The assays also indicate that WS has significant activity with both saturated and monounsaturated acyl-CoA ranging from 14 to 24 carbons in length. Lower levels of activity were detected with shorter, saturated acyl-CoA as well as with polyunsaturated (C18:2 and C18:3) acyl-CoA. Of the alcohols tested, the jojoba WS showed highest activity with C18:1 and C18:2, although a wide range of alcohols were used to a lesser extent (Fig. 1B). The preponderance of C22:1 alcohol in the native jojoba wax is most likely a reflection of the substrate characteristics of the FAR. The specific activity of WS was lower when using radiolabeled alcohol ([1-14C]16:0-OH) rather than rabiolabeled acyl-CoA ([1-14C]16:0 CoA). Presumably, this is due to the dilution of the substrate by endogenous alcohol present in the membranes. There are well-known technical difficulties associated with assays of membrane-associated proteins using amphipathic substrates (Juguelin et al., 1991), and it is recognized that somewhat different profiles could be obtained by alteration of the specific assay conditions.
Figure 1.
WS substrate specificity profiles of jojoba membrane extracts. Substrate profiles of the jojoba WS were obtained using a microsomal fraction isolated from developing embryos. Acyl-CoA specificity was determined using [1-14C]16:0 alcohol as a substrate, and alcohol specificity was determined using [1-14C]16:0 CoA as a substrate. All assays contained 40 μm acyl-CoA and 40 mm alcohol in a total volume of 0.25 mL. n.d., No data.
Solubilization and Recovery of WS Activity
The detergent CHAPS was used to solubilize the jojoba WS. In contrast to the jojoba FAR and KCS, recovery of WS activity after exposure to CHAPS required the presence of phospholipids in the sample prior to dilution of the detergent below critical micellar concentration. The phospholipids could be either endogenous, or, for those samples in which endogenous phospholipids had been separated from the enzyme, added to the assay cocktail. A soybean phospholipid mixture was routinely used for this purpose. Reproducible solubilization of WS required careful attention to the detergent to protein ratio. In our hands, the optimal detergent to protein ratio for solubilization of WS was 24:1 (2% [w/v] CHAPS with 0.83 mg protein/mL).
CHAPS was present in all of the chromatography buffers and was diluted during preparation of the sample for assay along with the simultaneous addition of phospholipid. The amount of WS activity recovered during chromatographic fractionation of solubilized WS was very sensitive to the CHAPS:phospholipid ratio in the final assay mixture (Fig. 2). Concentration curves of CHAPS and phospholipid were used to determine the optimal conditions for the assay. Although the actual shapes of the curves varied somewhat depending on the stage of purification, we routinely diluted CHAPS to 2 mg/mL (0.2%, w/v) and added phospholipid to yield a concentration of 0.7 mg/mL in the assay. This represents a CHAPS:phospholipid ratio of 2.8.
Figure 2.
Conditions for reconstitution of WS activity following detergent solubilization. A fraction obtained after chromatographic enrichment on Blue A agarose was used to determine the conditions for reconstitution of WS activity. Assays were performed first with varying CHAPS concentration at a fixed phospholipid level and second with varying phospholipid concentration at a fixed CHAPS level. For each experiment, data were plotted as the CHAPS:phospholipid ratio. ⋄, Phospholipid curve; ▪ CHAPS curve.
Chromatographic Enrichment of WS
Our initial attempts at the purification of WS using conditions developed for solubilization and purification of jojoba FAR were unsuccessful. The FAR protocols utilized a low detergent to protein ratio during solubilization and the chromatography buffers contained 0.75% (w/v) CHAPS. Under these conditions all of the recovered WS activity was found to be in an aggregated state (as judged by size exclusion chromatography). Using 1% (w/v) CHAPS in the buffers and optimizing the detergent to protein ratio during solubilization rendered WS amenable to chromatographic enrichment. Once these conditions had been determined, solubilized WS activity was quite stable and fractions from different stages of purification could be stored at −20°C for several months without significant loss of activity.
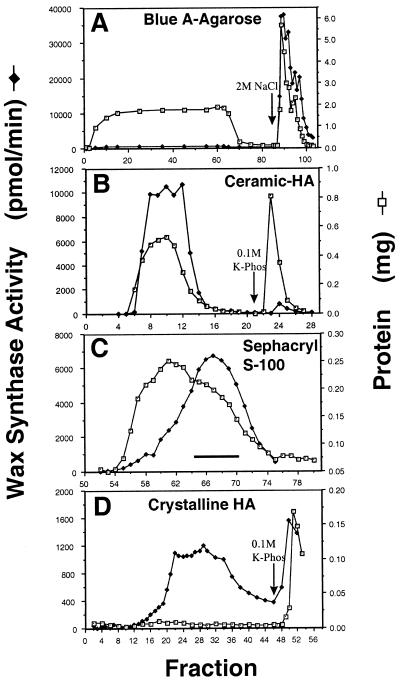
Figure 3 shows representative profiles of column separations used for enrichment of WS. As was the case for FAR and KCS, WS bound to Blue A agarose and was eluted with high salt, while most of the protein loaded onto the column did not bind. The high-salt fractions from the Blue A column were loaded directly onto ceramic HA columns. WS activity flowed through the column, while a significant portion of the protein bound and was removed. Fractions from the ceramic HA columns were concentrated by ultrafiltration and applied to a size exclusion column (Sephacryl S-100, Pharmacia). WS activity eluted as a symmetrical peak with an apparent molecular mass of approximately 40 kD (by comparison with protein standards chromatographed under equivalent conditions). This step separated WS from KCS activity, which elutes in the void volume of this column (Lassner et al., 1996). Fractions containing high levels of WS activity were pooled and applied to a column packed with crystalline HA. Most of the proteins in the sample bound to this matrix, while a relatively minor portion flowed through. The majority of WS was slightly retained by the matrix, but was eluted under initial buffer conditions. This minor retention of WS resulted in its separation from the set of proteins that flowed directly through the column and from the proteins that bound the column.
Figure 3.
Chromatographic enrichment of jojoba WS activity. A, Blue A agarose chromatography. Solubilized jojoba microsomal membranes were applied to a Blue A agarose column in buffer A containing 0.3 m NaCl. WS activity was eluted in buffer A containing 2.0 m NaCl. Protein content was determined according to the method of Bradford (1976) and is reported as milligrams of protein per fraction. WS activity is reported as picomoles of wax formed per minute per fraction. B, Ceramic HA chromatography. The 2 m NaCl eluate was concentrated 5-fold and applied to a ceramic HA column equilibrated in buffer A containing 2 m NaCl. The column was washed with equilibration buffer and bound proteins were eluted with 0.1 m potassium phosphate in equilibration buffer. The WS activity found in the flow through of each chromatographic run was pooled and concentrated 10-fold. C, Sephacryl S-100 chromatography. The concentrated ceramic HA flow through fraction was applied to a Sephacryl S-100 HR column equilibrated in buffer A containing 1 m NaCl (buffer B). WS activity was retained by the column. D, Crystalline HA chromatography. Fractions 65 to 70 from the S100 column were pooled and applied to a crystalline HA column equilibrated with buffer B. The column was washed with buffer B and bound proteins were eluted with 0.1 m potassium phosphate in buffer B.
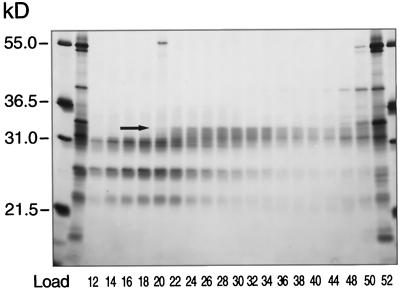
SDS-PAGE analysis of fractions from the HA column revealed the staining intensity of a single polypeptide band with an apparent molecular mass of 33 kD, which was correlated with WS activity detected in those same fractions (Fig. 4). Once this protein was identified, sufficient material was prepared to permit the generation of tryptic peptides for sequencing.
Figure 4.
SDS-PAGE of the crystalline HA column fractions. Proteins present in fractions from the crystalline HA column were separated by SDS-PAGE. Electrophoresis was carried out on a 20- × 20-cm gel containing a 10% to 13% acrylamide gradient, and the gel was stained with silver. The arrow indicates a protein band at 33 kD whose staining intensity in the various fractions correlates with WS activity detected in those same fractions.
Isolation of the WS cDNA
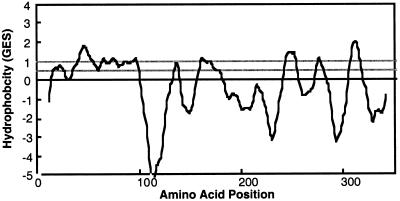
The amino acid sequences of tryptic peptides were used to design degenerate sense and antisense oligonucleotides. Primers encoding two of those peptides produced a prominent PCR product approximately 700 nucleotides in length. The DNA sequence of the PCR product enabled the cloning of the 5′ and 3′ ends of the cDNA via RACE (Frohman et al., 1988). The sequences of the 5′- and 3′-RACE products were used to assemble the sequence of a cDNA 1335 bases in length. The cDNA encodes a predicted protein of 352 amino acids with a molecular mass of 40.2 kD and a pI of 9.82. Figure 5 shows the hydropathy analysis performed with TopPred II (Claros and von Heijne, 1994), which suggests that there are seven to nine transmembrane domains and confirms that jojoba WS is an integral membrane protein.
Figure 5.
Hydropathy analysis of the jojoba WS. Hydropathy analysis was performed on the jojoba WS sequence using TopPred II (Claros and von Heijne, 1994) and the Goldman, Engleman, Steitz (GES) scale (Engleman et al, 1986). Regions with a score greater than 1 are likely transmembrane domains, and regions with a score greater than 0.5 are potential transmembrane domains.
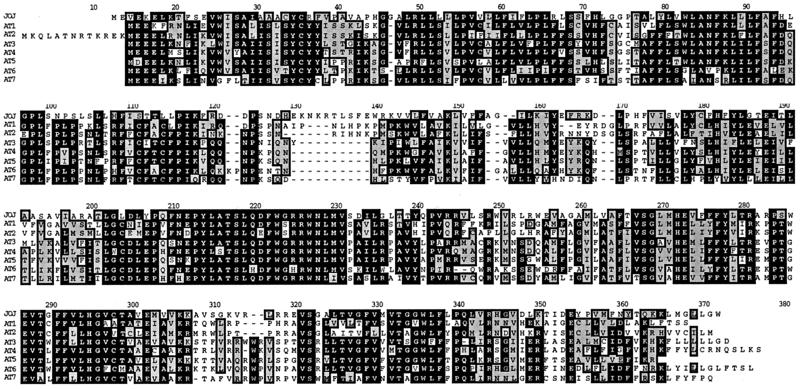
The jojoba wax synthase protein sequence was used to query the GenBank non-redundant DNA database. The only significant match was to Arabidopsis P1 clone MTE17 (GenBank accession no. AB015479), a clone derived from chromosome 5. There are seven ORFs on MTE17 between nucleotides 23,670 and 11,479 that share significant homology with the WS protein. The Arabidopsis ORFs range from 1,002 to 1,071 nucleotides in length, and none of the predicted coding regions contain introns. An alignment between the predicted jojoba WS protein sequence and the protein sequences predicted from the seven Arabidopsis ORFs is shown in Figure 6. Probing DNA gel blots containing reverse transcriptase PCR products from different Arabidopsis tissues with probes derived from the seven ORFs suggested that repeats AT1 and AT3 are transcriptionally up-regulated in Arabidopsis inflorescences, and transcription of repeat AT2 is highly up-regulated in developing seeds (data not shown). The accession number for the jojoba wax synthase is AF149919.
Figure 6.
Sequence of the jojoba WS and related Arabidopsis proteins. The protein predicted from jojoba WS cDNA was aligned to the proteins predicted from ORFs in the Arabidopsis P1 clone MTE17 (GenBank accession no. AB015479). JOJ, Jojoba WS protein sequence; AT1, protein predicted from MTE17 nucleotides 23,670 to 22,645; AT2, protein predicted from MTE17 nucleotides 21,954 to 20,884; AT3, protein predicted from MTE17 nucleotides 20551 to 19523; AT4, protein predicted from MTE17 nucleotides 19,192 to 18,155; AT5, protein predicted from MTE17 nucleotides 16,785 to 15,784; AT6, protein predicted from MTE17 nucleotides 14,664 to 13,624; AT7, protein predicted from MTE17 nucleotides 12,498 to 11,479.
Expression of WS in Transgenic Arabidopsis
We were unable to express active jojoba WS protein in Esherichia coli or Saccharomyces cerevisae cells and, therefore, we tested the functionality of the candidate cDNA in transgenic Arabidopsis. Two plasmids were constructed for plant transformation (Fig. 7). One plasmid, pCGN8557, contained L. annua KCS and jojoba FAR under control of the napin regulatory sequences. The second plasmid, pCGN8559, contained L. annua KCS, jojoba FAR, and the WS candidate under control of the napin regulatory sequences. Napin is a B. napus seed storage protein whose regulatory sequences drive high-level expression of the associated transgenes in embryos of transgenic plants (Kridl et al., 1991). L. annua KCS was chosen because of its ability to elongate fatty acyl CoA to 24 carbons in length (Lassner, 1997), a substrate upon which jojoba FAR has high activity. The two plasmids were introduced into A. tumefaciens, and subsequently used to transform Arabidopsis.
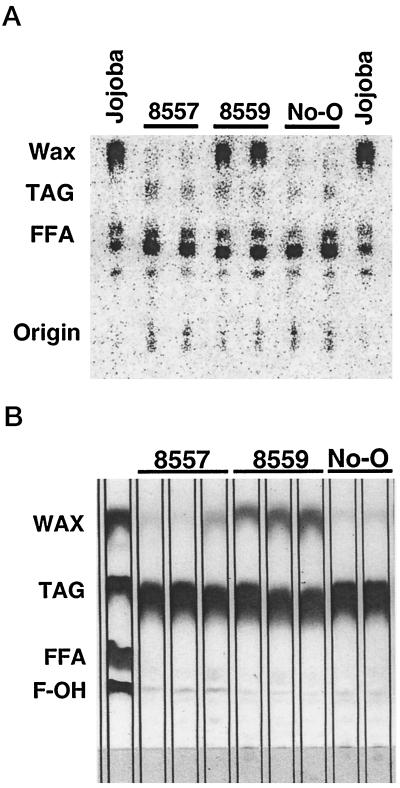
Developing seeds from control Arabidopsis and from plants transformed with pCGN8557 and pCGN8559 were collected, homogenized in a buffer solution, and assayed for WS activity. Extracts from several plants expressing pCGN8559 showed the presence of WS activity significantly increased above background levels. Extracts from pCGN8557 plants and from untransformed control plants had low but reproducible levels of this activity (Fig. 8A). Mature seeds harvested from these plants were extracted with organic solvents and the lipid classes were separated by TLC. Lipids on the TLC plates were revealed by exposure to iodine vapor. Seed oils from plants expressing all three genes (pCGN8559) contained a significant amount of material that co-migrated with the wax standard, while seed oils from transgenic plants that lacked the WS (pCGN8557) contained less of this material (Fig. 8B). Very little iodine-stained material in the wax region of the plate was detected in seed oils from untransformed control plants. The detection of WS activity in the various transformants correlated with the presence of high levels of wax in the seeds as measured by TLC. Additionally, oils from several plants containing the pCGN8557 construct had increased levels, relative to control plants, of iodine-stained material that co-migrated with the free fatty alcohol standard on the TLC plates. Oils from plants containing the pCGN8559 construct had amounts of iodine-stained material in this region that were equivalent to those seen in the control plants (Fig. 8B).
Figure 8.
TLC analysis of WS assay products and whole-seed lipid extracts. A, Extracts from immature seeds of plants expressing pCGN8557, pCGN8559, and the No-O control were assayed for WS activity. Membranes isolated from developing jojoba embryos were assayed as a positive control. The reaction products were separated by TLC and visualized using a radioanalytic detector. B, Lipid extracts from whole seeds of plants expressing pCGN8557, pCGN8559, and the control (No-O) were separated by TLC and visualized by exposing the plate to iodine vapor. Wax, TAG, free fatty acid (FFA), and fatty alcohol (F-OH) standards appear in the left lane.
Iodine staining of TLC-separated lipids is not a quantitative procedure. The intensity of staining is influenced by both the amount of material present and the degree of unsaturation of the molecules. The wax fractions are likely to be depleted in polyunsaturated moieties relative to the TAG fraction (Metz et al., 2000) and will therefore be less intensely stained by iodine. Quantitative data were obtained by methanolysis of the oil followed by GC analyses. The fatty acyl components of TAG are converted to fatty acid methyl esters by this protocol. During methanolysis of waxes, the acyl portion is converted to a fatty acid methyl ester, while the alcohol portion is released as a primary alcohol. The fatty acyl and fatty alcohol contents (shown as mol %) of oils extracted from pooled seeds harvested from a selected set of transgenic plants are shown in Table I. For clarity, only those components comprising greater than 1% are included. In the table, plant data from pCGN8557 and pCGN8559 subsets are arranged in order of increasing content of very-long-chain carbon moieties; i.e. the sum of fatty acids and fatty alcohols with chain lengths greater than C18, or VLC(Ac + Al).
Table I.
Fatty acyl and fatty alcohol mol % composition of oilseedsa
| Sample | Fatty Acyl
Groups
|
Alcohols
|
VLC (Ac +
Al)b
|
|||||||||||
|---|---|---|---|---|---|---|---|---|---|---|---|---|---|---|
| 16:0 | 18:0 | 18:1 | 18:2 | 18:3 | 20:0 | 20:1 | 20:2 | 22:1 | 24:1 | 20:1 | 22:1 | 24:1 | Total | |
| No-O | 7.2 | 3.2 | 15.9 | 27.0 | 18.3 | 2.5 | 20.4 | 2.1 | 2.2 | 0.2 | 0.0 | 0.0 | 0.0 | 28.0 |
| 8557-1 | 6.3 | 2.4 | 17.2 | 23.4 | 20.5 | 1.4 | 14.4 | 1.3 | 6.9 | 2.2 | 0.1 | 1.0 | 1.3 | 29.8 |
| 8557-10 | 6.7 | 2.6 | 14.8 | 23.6 | 22.1 | 1.1 | 11.0 | 1.3 | 8.8 | 2.4 | 0.2 | 1.8 | 2.1 | 29.9 |
| 8557-13 | 6.9 | 2.6 | 13.8 | 23.3 | 22.3 | 1.0 | 10.5 | 1.2 | 9.2 | 2.4 | 0.2 | 2.0 | 2.6 | 30.7 |
| 8557-14 | 6.7 | 2.6 | 13.9 | 24.1 | 20.4 | 1.1 | 10.7 | 1.3 | 9.5 | 2.4 | 0.2 | 2.5 | 2.8 | 31.9 |
| 8557-8 | 6.8 | 2.4 | 13.2 | 22.6 | 22.1 | 0.8 | 8.3 | 1.0 | 10.7 | 3.5 | 0.2 | 2.5 | 3.5 | 32.3 |
| 8557-11 | 6.8 | 2.6 | 13.7 | 23.4 | 20.6 | 1.2 | 11.2 | 1.2 | 8.8 | 3.1 | 0.2 | 2.1 | 3.2 | 32.4 |
| 8559-17 | 6.5 | 2.6 | 17.2 | 24.1 | 19.8 | 1.6 | 16.1 | 1.4 | 6.3 | 1.8 | 0.2 | 0.7 | 0.4 | 29.4 |
| 8559-3 | 6.9 | 2.4 | 15.3 | 22.5 | 20.4 | 1.1 | 11.5 | 1.0 | 8.5 | 2.8 | 0.5 | 3.1 | 2.1 | 32.1 |
| 8559-10 | 6.5 | 2.0 | 14.1 | 21.7 | 20.2 | 1.0 | 10.2 | 0.9 | 8.9 | 4.5 | 0.5 | 4.1 | 3.1 | 35.0 |
| 8559-15 | 7.0 | 1.8 | 13.2 | 22.0 | 17.4 | 0.9 | 11.2 | 0.9 | 8.3 | 3.6 | 0.9 | 6.4 | 3.8 | 37.9 |
| 8559-11 | 6.3 | 1.6 | 11.6 | 18.7 | 19.1 | 0.6 | 8.6 | 0.7 | 10.0 | 4.4 | 1.2 | 8.9 | 5.8 | 42.3 |
| 8559-18 | 6.5 | 1.7 | 11.5 | 19.6 | 17.5 | 0.9 | 11.8 | 1.0 | 7.3 | 3.5 | 1.4 | 9.5 | 5.2 | 42.6 |
Oils extracted from pooled seed samples were transmethylated and the products analyzed by GC. Data from a selected set of transgenic plants are shown.
The mole composition of fatty acyl groups and fatty alcohols is presented on a percentage basis. Fatty acyl or alcohol values less than 1% are not included in the table.
The total percentage (acyl groups plus alcohols) of very-long-chain species. Minor components (<1%) were included in the calculation.
No fatty alcohols were detected in the seed oils of the control plants. The pCGN8557 seed alcohol content ranged from 0% to 6.2% (13 plants were tested, and 12 had alcohol). The total amount of VLC(Ac + Al) ranged from 28.0% in control plants up to 32.4% in transgenic plants. For the pCGN8559 plants, alcohol levels ranged from 0% to 16.1% (15 plants were tested, and nine had alcohol) and the VLC(Ac + Al) reached as high as 42.6%. The increase in VLC(Ac + Al) was at the expense of C18 fatty acids. All of the fatty alcohols detected were C20 or longer.
NMR Quantitation of Seed Oil Waxes
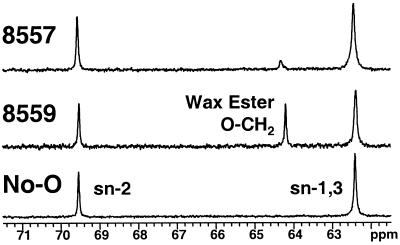
High-resolution 13C-NMR was used to examine lipid classes in whole seeds from control and transgenic Arabidopsis plants (Hutton et al., 1999). To perform this analysis, unique peaks were identified as TAG (the glycerol carbon at the sn-2 position, 69.6 ppm) and wax (C[1] of the fatty alkyl group, 64.4 ppm). The NMR method on intact seeds does not produce a resolvable peak to quantitate free fatty alcohols, and particularly the C(1) peak of the free alcohol, which has a similar chemical shift as the sn-1,3 carbons in the glycerol backbone of TAG. In addition to being non-destructive, this method permits accurate determination of the relative signal intensities (and therefore the molar ratios) of wax and TAG. Figure 9 shows representative examples of the relevant region of the NMR spectra obtained with control seeds and seeds from pCGN8557 and pCGN8559 transgenic plants. No wax signal was detected in seeds from the control plants, the pCGN8557 seeds contained a minor wax signal, and the pCGN8559 seeds contained a strong signal.
Figure 9.
13C-NMR spectra of selected Arabidopsis seed samples. The relevant region of the 13C-NMR spectra obtained with whole seeds from control (No-O) and from pCGN8557 and pCGN8559 transgenic plants are shown. Unique carbons in the spectra were identified for wax ester (C[1] of the fatty alkyl group, O-CH2, at 64.3 μL/L) and TAG (the glycerol carbon at the sn-2 position, at 69.6 μL/L).
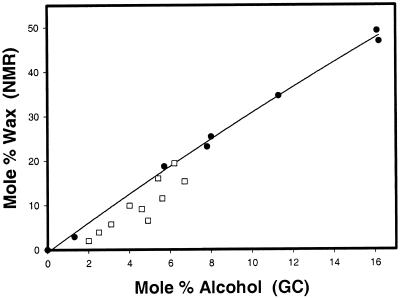
The molar ratio of wax to TAG was determined for each of the transgenic whole seed samples using NMR spectroscopy. Figure 10 shows a plot of mol % wax, as determined by NMR of whole seeds, versus mol % fatty alcohol, as determined by GC analysis of derivatized oil samples from those same seeds. In plants expressing pCGN8557 the highest mol % wax value obtained was 19.4%, while in plants expressing pCGN8559 the value was 49.2%. A line representing the correlation between mol % wax and mol % alcohol when all of the alcohol is in the form of wax is also shown in this graph. Although wax is found in most of the pCGN8557 transformants, nearly all of the data from these plants fell below the correlation line, suggesting that esterification of the alcohol was incomplete. This indicates that free alcohols should be present in some of these seed oils, which is in agreement with the TLC analysis of oils derived from pCGN8557 plants (Fig. 8B). In addition, Figure 10 graphically shows that co-expression of the WS with the FAR and KCS can result in increased levels of total fatty alcohol accumulation in the seeds.
Figure 10.
Comparison of wax and alcohol measurements of seeds from transgenic Arabidopsis plants. Whole pooled seeds from Arabidopsis plants transformed with either pCGN8557 (□; expressing KCS and FAR) or with pCGN8559 (●; expressing KCS, FAR, and WS) were analyzed by NMR to determine their mol % wax composition. The oil from those same seeds was extracted, transmethylated, and the mol % alcohol content determined by GC analyses. The wax and alcohol values were plotted against each other. The line represents the correlation between mol % wax and mol % alcohol when all of the alcohol is in the form of wax.
VLC(Ac + Al) Content Correlates with Wax Levels
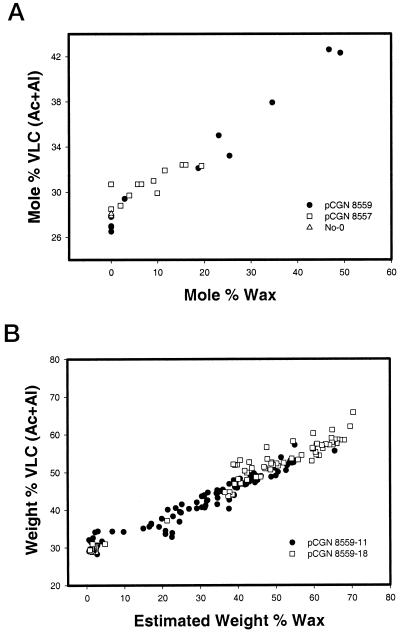
Figure 11A shows the correlation between the amount of wax (as measured by NMR) present in the oils of pooled seed samples and the quantity of VLC(Ac + Al) (as measured by GC) present in those same oils. As the amount of wax increased, there was a corresponding linear increase in the amount of VLC(Ac + Al).
Figure 11.
Comparison of VLC(Ac + Al) and wax levels in seeds of transgenic Arabidopsis plants. A, The mol % of VLCF(Ac + Al) determined by GC analysis of Arabidopsis seed pools is plotted against the mol % of wax determined by NMR of those same pools. B, The weight percent of VLCF(Ac + Al) determined by GC analysis of single Arabidopsis seeds from transgenic lines pCGN8559-11 and pCGN8559-18 are plotted against the estimated weight percent of wax obtained by doubling the weight percent of alcohol determined by GC analysis.
The fatty acid and alcohol compositions of single seeds from two of the Arabidopsis plants that exhibited the highest pooled mol % wax levels (pCGN8559-11 and pCGN8559-18) were determined by GC analysis. We were unable to use 13C-NMR to measure wax levels in single seeds, and therefore the wax content was estimated by doubling the weight of alcohol detected. This estimation seems reasonable, since no free alcohols were found in the pooled seed oils from pCGN8559 events. The results shown in Figure 11B are plotted as weight percent VLC(Ac + Al) versus estimated weight percent of wax. The data suggest that in some seeds as much as 70% by weight of the oil is in the form of waxes. Additionally, even at these high levels, the linear relationship between wax content and the accumulation of VLC(Ac + Al) is maintained. In seeds with the highest amount of wax, as much as 68% by weight of the fatty acids and alcohols have chain lengths greater than 18 carbons.
DISCUSSION
We have identified the WS that produces long-chain waxes in jojoba embryos and have cloned a cDNA that encodes that protein. The identity of the WS candidate was confirmed by expression of the cDNA in transgenic plants and detection of high levels of WS activity in these plants. To our knowledge, this is the first identification from any source of a WS that utilizes fatty acyl-CoA and fatty alcohols. As was anticipated given the lipophilic nature of its substrates and products, WS is extremely hydrophobic, with multiple potential transmembrane domains. The basic pI of WS is consistent with those observed for other membrane-associated oil biosynthetic enzymes, and may be a general phenomenon of enzymes embedded in the phospholipid bilayer (Coleman, 1990). The protein was identified on SDS gels as having an apparent molecular mass of 33 kD, while the size predicted by translation of the cDNA was 40.2 kD. We do not know if the anomalous electrophoretic migration of WS was due to a post-translational modification of the protein (we have no additional data that suggest such a modification), or to the structure of the protein. Shockey et al. (1995) attempted to affinity-label jojoba WS using a photoreactive analog of acyl-CoA. Their method tagged a microsomal protein with an apparent molecular mass of 57 kD (as estimated by SDS-PAGE), which they suggested may be WS. No additional characterization of the protein was presented. The large difference in mobility on SDS gels of the protein they tagged compared with the one we have identified suggests that they are different proteins.
We have discovered on chromosome 5 a series of seven Arabidopsis ORFs with homology to jojoba WS. We did not find any expressed sequence tags related to these ORFs. Expression of two of the Arabidopsis ORFs were higher in inflorescence tissue than other examined tissues, suggesting the possibility that these ORFs are involved in pollen development. One of the ORFs was up-regulated in developing seeds, suggesting that it may be involved in seed lipid synthesis. Enzymatic functions have not been established for any of the proteins encoded by these ORFs. However, given the degree of homology with the WS sequence, it is reasonable to expect that they will have a WS or similar acyltransferase activity. One can imagine several plant processes that could result from proteins encoded by these ORFs, including: formation of epicuticular waxes (Post-Beittenmiller, 1996), formation of wax esters found in tapetal lipid bodies (Ting et al., 1998; Hernandez-Pinzon et al., 1999), and formation of seed lipids. It is possible that the seed-expressed ORF is responsible for the endogenous WS activity found in developing Arabidopsis seeds. It is also possible that the enzyme encoded by the seed-expressed ORF has a different primary function, and WS activity is only a minor function. For example, diacylglycerol acyltransferase, like WS, catalyzes acyl transfer from fatty acyl-CoA to an alcohol (diacylglycerol). Future research can elaborate on the roles of the Arabidopsis WS-like ORFs in plant development.
The evolutionary origins of jojoba seed wax synthesis have been less than obvious. Metz et al. (2000) reported the protein and cDNA sequences of the jojoba FAR and showed homologs are present in other plants. They also showed that seed-specific expression of the jojoba FAR cDNA in HEAR resulted not only in the production of fatty alcohols, but that an endogenous acyltransferase activity converted at least a portion of these alcohols to waxes. In the present study, we report the protein sequence for the jojoba WS and the identification of several ORFs in Arabidopsis with high degrees of homology to that sequence. One likely scenario for diversion of the storage lipid pathway in jojoba from TAG to wax involves the recruitment of a FAR-like gene to seed-specific expression, followed by selection for an increase in the endogenous WS activity. The selection would favor conversion of fatty alcohol to a less-toxic neutral lipid (wax). In jojoba, the waxes are comprised of very-long-chain moieties. Seed oils from a number of plants contain the FAE systems that form the very-long-chain substrates utilized for wax synthesis.
The effect of WS on the accumulation of very-long-chain moieties in Arabidopsis seed oils was interesting (Fig. 11). Presumably, the presence of a neutral lipid sink for the products of the FAE system increases the proportion of fatty acids that can be elongated. Previous attempts in B. napus using only an elongating enzyme (Lassner et al., 1996) or using the elongating enzyme and a specialized lysophosphatidic acid acyltransferase (Lassner et al., 1995) did not significantly increase the total very-long-chain fatty acid content of the seed oil. It will be interesting to see if the increase in VLC(Ac + Al) associated with increasing wax in Arabidopsis will also occur in transgenic Brassica spp. If it does, it would suggest one avenue to increasing the yield of specific-chain-length carbon moieties in commercial seed oils.
Many of the waxes found in nature have commercial uses in the lubricant, food, and cosmetic industries. The value of the wax from sperm whales was one factor responsible for this animal's being hunted to near extinction and prompted the eventual ban on harvesting. Limitations on supply of waxes from wild sources has resulted in efforts to identify appropriate organisms amenable to domestication. Jojoba oil has long been suggested as an alternative to sperm whale oil, and the plants are currently under cultivation in several areas of the world. However, the cost of production of jojoba oil remains high relative to petroleum-based products, and is currently used primarily for cosmetic applications. We have shown that Arabidopsis can be engineered to produce high levels of wax esters in its seed oil. Seed oils derived from Arabidopsis plants transformed with pCGN8559 appear to have wax levels up to 70% by weight. Arabidopsis is closely related to Brassica currently used in commercial production of oil. We have introduced pCGN8559 into transgenic HEAR plants and are in the process of determining how much wax can be produced. We anticipate that the expression of these genes in HEAR will permit the production of long-chain liquid waxes at reasonable cost, a cost that may permit their use in an expanded range of commercial applications.
ACKNOWLEDGMENTS
Brenda Reed was responsible for Arabidopsis transformation and plant care. Alison Van Eenennaam performed analysis of steady-state RNA levels of the Arabidopsis WS-related ORFs. Protein sequencing was performed at the W.M. Keck Foundation Biotechnology Resource Laboratory, Yale University.
LITERATURE CITED
- Blum H, Beier H, Gross HS. Improved silver staining of plant proteins, RNA, and DNA in polyacrylamide gels. Electrophoresis. 1987;8:93–99. [Google Scholar]
- Bradford MM. A rapid and sensitive method for the quantitation of microgram quantities of protein utilizing the principle of protein-dye binding. Anal Biochem. 1976;71:248–254. doi: 10.1016/0003-2697(76)90527-3. [DOI] [PubMed] [Google Scholar]
- Browse J, McCourt J, Sommerville CR. Fatty acid composition of leaf lipids determined after combined digestion and fatty acid methyl ester formation from fresh tissue. Anal Biochem. 1986;152:141–145. doi: 10.1016/0003-2697(86)90132-6. [DOI] [PubMed] [Google Scholar]
- Claros MG, von Heijne G. TopPred II: an improved software for membrane protein structure predictions. Comput Appl Biosci. 1994;10:685–686. doi: 10.1093/bioinformatics/10.6.685. [DOI] [PubMed] [Google Scholar]
- Clough SJ, Bent AF. Floral dip: a simplified method for Agrobacterium-mediated transformation of Arabidopsis thaliana. Plant J. 1998;16:735–743. doi: 10.1046/j.1365-313x.1998.00343.x. [DOI] [PubMed] [Google Scholar]
- Coleman J. Characterization of the Escherichia coli gene for 1-acyl-sn-glycerol-3-phosphate acyltransferase (plsC) Mol Gen Genet. 1990;232:295–303. doi: 10.1007/BF00280009. [DOI] [PubMed] [Google Scholar]
- DeWitt S, Ervin JL, Howes-Orshison D, Dalietos D, Neidleman SL. Saturated and unsaturated wax esters produced by Acinetobacter sp. HO1–1 grown on C16-C20n-alkanes. J Am Oil Chem Soc. 1982;59:69–74. [Google Scholar]
- Engleman DM, Steitz TA, Goldman A. Identifying nonpolar transbilayer helices in amino acid sequences of membrane proteins. Annu Rev Biophys Biophys Chem. 1986;15:321–353. doi: 10.1146/annurev.bb.15.060186.001541. [DOI] [PubMed] [Google Scholar]
- Frohman MA, Dush MK, Martin GR. Rapid production of full length cDNAs from rare transcripts: amplification using a single gene-specific oligonucleotide primer. Proc Natl Acad Sci USA. 1988;85:8998–9002. doi: 10.1073/pnas.85.23.8998. [DOI] [PMC free article] [PubMed] [Google Scholar]
- Hara A, Radin NS. Lipid extraction of tissues with a low-toxicity solvent. Anal Biochem. 1978;90:420–426. doi: 10.1016/0003-2697(78)90046-5. [DOI] [PubMed] [Google Scholar]
- Hernandez-Pinzon I, Ross JHE, Barnes KA, Damant AP, Murphy DJ. Composition and role tapetal lipid bodies in the biogenesis of the pollen coat of Brassica napus. Planta. 1999;208:588–598. doi: 10.1007/s004250050597. [DOI] [PubMed] [Google Scholar]
- Hutton WC, Garbow JR, Hayes TR. Nondestructive NMR determination of oil composition in transformed canola seeds. Lipids. 1999;34:1339–1346. doi: 10.1007/s11745-999-0487-0. [DOI] [PubMed] [Google Scholar]
- Juguelin H, Bessoule JJ, Cassagne C. Interaction of amphiphilic substrates (acyl-CoAs) and their metabolites (free fatty acids) with microsomes from mouse sciatic nerves. Biochim Biophys Acta. 1991;1068:41–51. doi: 10.1016/0005-2736(91)90058-g. [DOI] [PubMed] [Google Scholar]
- Kahn AA, Kolattukudy PE. Control of synthesis and distribution of acyl moieties in etiolated Euglena gracilis. Biochemistry. 1973;12:1939–1948. doi: 10.1021/bi00734a017. [DOI] [PubMed] [Google Scholar]
- Kolattukudy PE, Rogers L. Biosynthesis of fatty alcohols, alkane-1,2-diols and wax esters in particulate preparations from the uropygial glands of white-crowned sparrows (Zonotrichia Leucophyrus) Arch Biochem Biophys. 1978;191:244–258. doi: 10.1016/0003-9861(78)90087-5. [DOI] [PubMed] [Google Scholar]
- Kolattukudy PE, Rogers L. Acyl-CoA reductase and acyl-CoA: fatty acyl transferase in the microsomal preparation from the bovine meibomian gland. J Lipid Res. 1986;27:404–411. [PubMed] [Google Scholar]
- Kridl JC, McCarter DW, Rose RE, Scherer DE, Knutzon DS, Radke SE, Knauf VC. Isolation and characterization of an expressed napin gene from Brassica rapa. Seed Sci Res. 1991;1:209–219. [Google Scholar]
- Lassner M. Transgenic oilseed crops: a transition from basic research to product development. Lipid Technol. 1997;9:5–9. [Google Scholar]
- Lassner MW, Lardizabal K, Metz JG. A jojoba β-ketoacyl-CoA synthase cDNA complements the canola fatty acid elongation mutation in transgenic plants. Plant Cell. 1996;8:281–292. doi: 10.1105/tpc.8.2.281. [DOI] [PMC free article] [PubMed] [Google Scholar]
- Lassner MW, Levering CK, Davies HM, Knutzon D. Lysophosphaticidic acid acyltransferase from meadowfoam mediates insertion of erucic acid at the sn-2 position of triacylglycerol in transgenic rapeseed oil. Plant Physiol. 1995;109:1389–1394. doi: 10.1104/pp.109.4.1389. [DOI] [PMC free article] [PubMed] [Google Scholar]
- Metz JG, Pollard MR, Anderson L, Hayes TR, Lassner MW. Purification of a jojoba embryo fatty acyl-coenzyme A reductase and expression of its cDNA in high erucic acid rapeseed. Plant Physiol. 2000;122:635–644. doi: 10.1104/pp.122.3.635. [DOI] [PMC free article] [PubMed] [Google Scholar]
- Millar AA, Kunst L. Very-long-chain fatty acid biosynthesis in controlled through the expression and specificity of the condensing enzyme. Plant J. 1997;12:121–131. doi: 10.1046/j.1365-313x.1997.12010121.x. [DOI] [PubMed] [Google Scholar]
- Miwa TK. Jojoba oil wax esters and derived fatty acids and alcohols: gas chromatographic analyses. J Am Oil Chem Soc. 1971;48:259–264. [Google Scholar]
- Ohlrogge JB, Pollard MR, Stumpf PK. Studies on biosynthesis of waxes by developing jojoba seed tissues. Lipids. 1978;13:203–210. [Google Scholar]
- Pollard MR, McKeon T, Gupta LM, Stumpf PK. Studies on biosynthesis of waxes by developing jojoba seed. II. The demonstration of wax biosynthesis by cell-free homogenates. Lipids. 1979;14:651–662. [Google Scholar]
- Post-Beittenmiller D. Biochemistry and molecular biology of wax production in plants. Annu Rev Plant Physiol Plant Mol Biol. 1996;47:405–430. doi: 10.1146/annurev.arplant.47.1.405. [DOI] [PubMed] [Google Scholar]
- Russell NJ. The lipid composition of the psychrophilic bacterium Micrococcus cryophilus. J Gen Microbiol. 1974;80:217–225. doi: 10.1099/00221287-80-1-217. [DOI] [PubMed] [Google Scholar]
- Shockey JM, Rajasekharan R, Kemp JD. Photoaffinity labeling of developing jojoba seed microsomal membranes with a photoreactive analog of acyl-coenzyme A (Acyl-CoA) Plant Physiol. 1995;107:155–160. doi: 10.1104/pp.107.1.155. [DOI] [PMC free article] [PubMed] [Google Scholar]
- Ting JTL, Wu SSH, Ratnayake C, Huang AHC. Constituents of the tepetosomes and eleaioplasts in Brassia campestristapetum and their degradation and retention during microsporogenesis. Plant J. 1998;16:541–551. doi: 10.1046/j.1365-313x.1998.00325.x. [DOI] [PubMed] [Google Scholar]
- Wu X-Y, Moreau RA, Stumpf PK. Studies of biosynthesis of waxes by developing Jojoba seed. III. Biosynthesis of wax esters from acyl-CoA and long chain alcohols. Lipids. 1981;6:897–902. [Google Scholar]
- Yermanos DM. Composition of jojoba seed during development. J Am Oil Chem Soc. 1975;52:115–117. [Google Scholar]


