Abstract
It is common practice in India to consume the dairy drink buttermilk as a way of mitigating occupational heat strain. This paper explores the thermoregulatory and hydration benefits of drinking buttermilk but also the impacts of work in a hot environment on the gut microbiota, renal and cognitive function. Twelve healthy participants were subjected to a 3-h period of medium load physical intermittent work in a climatic chamber (34°C, 60% RH). The subjects were given water, buttermilk (700 ml) or no rehydration at random. Mean body temperatures when no rehydration was given were significantly higher (p≤0.001). When subjects drank water or buttermilk they had a lower sweat rate than with no rehydration (p≤0.05) and the perception of feeling hot, uncomfortable, thirsty and physically exerted was significantly reduced (p≤0.05). A hormonal stress response at the end of the exposure was seen when not drinking (p≤0.05). No differences in cognitive abilities and gut microbiota were found. The exposure lowered the renal blood flow suggesting an acute impact of short term heat exposure. It was also found that buttermilk has a protective effect on this impact. Our results demonstrated that keeping hydrated by water/buttermilk consumption mitigates heat strain in well-nourished subjects.
Keywords: Occupational health, Heat strain, Yoghurt/analysis, Heat stress, Hydration management, Climate change
Introduction
Heat stress is a major issue in workplaces in India and across the world. It affects worker’s health and productivity, and can even threaten survival1, 2, 3). The situation is set to deteriorate due to climate change2, 4, 5, 6, 7). Workers involved in physically demanding tasks outdoors in, for example, agriculture, construction and mining are especially vulnerable. Physiological heat strain results in a rise in both core and skin surface temperature and varies depending on physical activity, clothing worn and the environmental conditions8, 9, 10, 11).
In a field study looking at occupational heat stress in Chennai, India in 2013 it was found that a diluted (four times with water) dairy drink ‘buttermilk’ was widely consumed among workers in all studied workplaces as a traditional way of mitigating heat strain (between 67–100% of the workers in the workplaces surveyed)2). Consumption of fermented food, such as corn, rice, bean curd and dairy are often encountered in traditional and in societies unable to preserve food through refrigeration12). The current form of buttermilk being consumed by the workers in Chennai is a spiced diluted form of curd (natural yoghurt). Drinking buttermilk provides the body with liquid and nutrition in an easily digestible form as well as vitamins and minerals that are lost when sweating. Buttermilk is high in protein, riboflavin, potassium, vitamin B12 and calcium13). Consumption of similar diluted yoghurt drinks are seen in other hot regions such as Lassi in South-East Asia and Ayran in the Middle East.
Food that has been fermented has been studied for health benefits in terms of probiotics, such as content of live lactic acid bacteria with health benefits13, 14, 15, 16) and its importance in sustaining human health12). However, buttermilk has not been studied for its potential in mitigating heat strain, like other traditional drinks such as coconut water17, 18). Although, some papers mention buttermilk as a home remedy effective in dissipating heat19).
The overall objective of the study was to study the impacts of work in hot environments from a variety of disciplines. The primary aim of the study was to investigate the benefits of drinking buttermilk thermoregulation and potential hydration benefits when working physically in a hot environment, compared to drinking plain water and when no rehydration was provided. The study also included additional aims that explore other questions and methods related to hot working conditions:
a) To explore the cognitive effects of heat strain and physical work on arousal, working memory performance, and risk-taking.
Increases in cortisol stress hormone concentrations have been previously reported under heat stress, physical exercise and dehydration20, 21). A large number of studies have examined the relation between exercise and cognitive performance22, 23). Much of the research is based on the notion that acute exercise alters how brain systems allocate the mental resources, where various forms of cognitive tasks are supposed to be more demanding when performed in combination with physical exercise24). However, the findings are by no means clear-cut: the results range from a deleterious effect on cognitive performance to an enhancement. A confounding factor is the variety of methodological approaches applied, which make the results hard to justly compare. The same problem is also true for the findings on the relation between dehydration and cognitive performance25). Therefore, we aimed to further explore the effects on cognitive performance.
b) To examine the impact of heat strain and physical work on the human gut microbiota.
The gut microbial composition is important for human health and here, bacterial diversity has been shown to be of significant relevance26). To our knowledge, the gut microbial structure has not previously been investigated in relation to heat stress. However, since heat stress has physiological impact on the human body we hypothesized that latent heat stress can impact the gut microbiota such as the diversity and concentrations of e.g. Enterobacteriaceae and Lactobacillus . The study also wanted to explore whether buttermilk could have a positive impact on the gut microbial composition. No previous studies have explored these relationships.
c) To investigate effects of physical work and short term heat exposure on renal function.
Heat exposure impacts the body’s fluid regulation in which the kidneys play an important role27). For example, acute effects of reduced renal blood flow have previously been seen when conducting hard physical labour in the heat, such as in marathon runners28). It is estimated that hard work can reduce renal blood flow by 50%29). In addition, an epidemic of chronic kidney disease (CKD) has spread among agricultural workers in many central American countries with hot and humid climates30, 31, 32, 33). Here, common risk factors are not present as the vast majority of those affected are young, normotensive and lean male agricultural workers. However, they are exposed to repeated daily dehydration and hard physical labour31, 33). Both Garcia-Trabaino et al. 201531) and Wesseling et al. 201632) found a cross-shift increase in serum creatinine in sugarcane plantations in El Salvador and Nicaragua respectively. Dehydration and heavy work may be a major cause and it is possible that continuous exposure could cause permanent damage to the kidney31, 32). In this study, we wanted to investigate if the short heat exposure including physical work would affect acute kidney function.
d) A validation study of accelerometers for use in the field of hot occupational settings to estimate the metabolic rate. The findings from this aim will not be reported in this paper but further information can be found in Kuklane et al. 201534)).
Subjects and Methods
A cross-over study was conducted using a buttermilk recipe from Chennai, India, to assess the effectiveness of buttermilk on whole body rehydration, thermoregulation, stress and recovery during a 3-h period of medium load physical work (average 200 W/m2, SD ± 74). The activities involved loading bricks, stepping, biking and arm crank at rotating intervals every 20 min in a heat chamber (34°C, 60% RH). The thermal condition is simulating the hottest measured workplace in Chennai during field work in April/May 20132). The study involved three interventions; water, buttermilk (100 ml every 20 min, total 700 ml) and no rehydration. The water and buttermilk was brought inside the chamber at room temperature (~19°C) and consumed after a few minutes in the heat.
Subjects
The research was completed according to the Recommendations of the Helsinki Declaration (1983), including a written consent obtained from all subjects and an ethical approval from the regional ethical review board at Lund University (Dnr 2014/606). Twelve subjects (19–33 yr; 6 males, 6 females) were recruited. Four recruits did not complete the study due to health or other practical reasons and were replaced by new subjects. The female participants had normal menstrual cycles, did not use contraceptives, and were tested in the early follicular phase (days 2–10). All subjects were normotensive, nonsmokers, had a BMI below 27 and were not taking any medications that could alter the cardiovascular or thermoregulatory responses in the heat. Subjects performed a VO2 max test at 20°C before the study to determine suitability. Criteria for participation for women was a maximum oxygen consumption of at least 30 ml/kg/min, and men at least 35 ml/kg/min. None of the subjects were excluded based on maximum oxygen consumption. An overview of the subjects can be seen in Table 1.
Table 1. Overview of subjects: averages and standard deviation (SD).
| Females | Males | |||||||
|---|---|---|---|---|---|---|---|---|
| Age | BMI kg/m2 |
VO2max ml/kg/min |
Max pulse b/min |
Age | BMI kg/m2 |
VO2max ml/kg/min |
Max pulse b/min |
|
| 24.0 (SD 3.7) |
23.8 (SD 1.1) |
50.2 (SD 4.8) |
191.2 (SD 7.7) |
27.2 (SD 2.8) |
24.0 (SD 2.0) |
56.8 (SD 4.4) |
194.3 (SD 9.7) |
|
N=12
All the tests started in the morning at 8 am and were finished by noon. The subjects were requested to abstain from strenuous exercise for at least 48 h prior to the test and to consume a standard dinner the evening before each test day. They were requested not to eat in the morning of the test day but could drink a total of 500 ml of water before entering the chamber to ensure normal hydration state. At arrival in the morning, the first cortisol and urine samples were taken. However, it was not the first morning urine sample as the subjects had urinated at home before entering the lab and had consumed some water. A standardized breakfast of an egg sandwich followed. Between each test, there was at least a 5-d resting period in order to avoid heat acclimatization effects. The study was carried out during the winter season, from November until March. During the test the subject was fasting. The weight was measured before, during (including light sports wear) and after the test.
Study variables
Body core (rectal, Trec) and skin temperatures, heart rate and oxygen uptake were continuously measured together with recording of body weight change, subjective responses by the scales of thirst, thermal comfort and thermal sensation, Borg’s 15-grade RPE (ratings of perceived exertion) scale10, 35) and a final short questionnaire. The rectal temperature (Trec) represented the core temperature and was measured with an YSI-401 sensor (Yellow Springs Instrument, USA). It was inserted by the subjects at a depth of 10 cm above the anal sphincter. Skin temperature (Tsk) sensors (YSI-402 or YSI-402AC (tip 3.0 or 3.3 in diameter)) were taped with a single layer of 3M BlendermTM surgical tape type 1525 on the forehead and left side of the chest, upper arm, thigh and calf. Trec and Tsk were recorded at 10 s intervals by a NI data acquisition hardware and Labview program (National Instruments, USA) by a desktop computer.
Subjects rated their whole body thermal sensation, thermal comfort, thirst and perceived exertion at 20 min intervals. Further, a short final questionnaire was filled during the final test day asking questions regarding buttermilk’s cooling effect, its thirst relief and refreshment potential, stomach sensations and its taste.
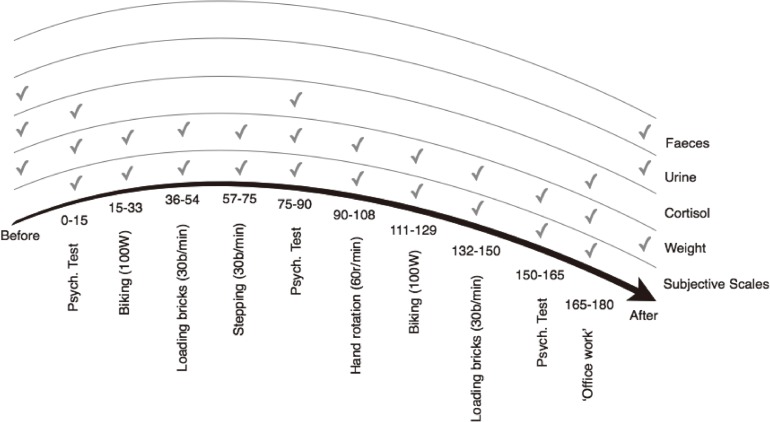
Oxygen uptake (VO2) was measured continuously during the exercises (18 min) with MetaMax I (CORTEX Biophysik GmbH, Germany). Heart rate was recorded at 5 s intervals using Polar Heart Rate Monitors (RS400, Polar Electro, Finland). The mean skin temperature value was calculated according to the 4-points Ramanathan equation (Tsk=0.3*Chest+0.3*UpperArm+0.2*Thigh+0.2*Calf)36). Mean body temperature was calculated according to the formula, Tb=0.8*Trec+0.2*Tsk. Weight was measured nude before and after the test for total body weight loss calculation. During the exposure, weight was recorded every 20 min, after each activity to estimate dehydration level and evaporation rate. During analysis of weight loss, the data was corrected for the added weight of buttermilk and water. Nude weight (before and after) and clothed weight (during the exposure) was analysed separately. Urine samples were taken before and directly after each test to measure renal function biomarkers. The faeces sample was taken from the single use plastic cover of the rectal probe, inserted into a test tube and weighed at the end of the exposure. The stress hormone cortisol was measured in saliva samples when arriving at the thermal environment laboratory, in the beginning, middle and at the end of the test, using Cortisol Salivette collection tubes (Sarstedt, Nümbrecht, Germany). The urine and cortisol samples were analysed at the laboratory of Clinical Chemistry (Skåne University Hospital, Lund, Sweden) using a standard luminiscence method. The morning sample was used as a baseline. The test protocol can be seen in Fig. 1.
Fig. 1.
Test protocol. Heart rate, oxygen consumption and temperatures were measured continuously.
Description of activities:
-
–
Psychological test: assessing different aspects of cognitive performance.
-
–
Biking: physical activity on a cycling ergometer at 100 W at 60 revolutions per min.
-
–
Stacking: physical activity consisting of stacking 30 bricks per min from side to side.
-
–
Stepping: physical activity on a step bench at 30 steps per min.
-
–
Arm crank: physical activity in an arm ergometer at 25 W at 60 revolutions per min.
-
–
Break: body weight measurement and waiting for the next task to start.
The criteria to terminate the heat exposure were
-
1.
3 h of heat exposure was reached;
-
2.
subjects felt the condition was intolerable and wished to quit;
-
3.
rectal temperature (Trec) reached 38.5°C or;
-
4.
the test leader decided to terminate the exposure based on observations of the subject.
After the exposure, the subject was weighed immediately inside the climatic chamber.
The SPSS statistical software was used to compare the three interventions on the rate of rectal (Trec) and skin temperature (Tsk) change for each activity (average difference between the start and end), heart rate and mean body temperature (Tb) change together with hydration variables calculated from weight loss, saliva cortisol, urine and perception scales. The statistical analysis applied an ANOVA repeated measures, a mixed model for better analysis of missing data (e.g. when subjects exceeded the limit rectal temperature and terminated the exposure), and a Freidman’s test for statistics of significance (p<0.05).
Psychological tests (a)
The psychological tests were chosen based on the assumption that tasks demanding immediate cognitive resources are impaired when executed under heat stress and physical exercise. However, scientific conclusions about this are not clearand several studies have not found a cognitive impairment related to heat-stress and physical activity37). The tests measured subjective assessment of anxiety, working memory performance, and risk taking. Tests included SAM (Self-Assessment Manikin)38), which is a non-verbal pictorial assessment technique, where the subject’s assessed their subjective feelings of arousal, control and pleasure on a scale from 1–9. The “N-back” procedure38, 39), is a well-established way of continuously measuring the capacity of working memory. A sequence of letters is presented on a screen and the participant has to remember the letters presented earlier in the sequence. When N=1, the participant shall push a button when the same letter appear for the second time, with another letter in between. For instance, if the first screen shows an “A”, the second screen a “K” and the third screen an “A”, the participant shall push the button. When N=2 the participant shall push the button when the same letter appears for the second time, but with two other letter in between (that is, “A”, “K”, “G”, “A”). Every letter is presented for 500 ms with a 1,000 ms interstimulus interval (a blank screen). The number of correct responses, misses, and “false alarms” is then calculated. In this study, a block where N=1 and a block where N=2 were used. As can be seen in Fig. 1 the participants were tested prior, during and after the exposure to the heat stress procedure. The measure prior to heat stress exposure was used as a baseline and changes between baseline and the two following measures were evaluated within subjects. The data was analysed with one way ANOVA.
Gut microbial analyses (b)
DNA extraction
Ten milliliter phosphate buffered saline (PBS, Oxoid, England) was added to the rectal samples and vortexed for 2 min. After centrifuging in 4°C at 8,000 rpm for 10 min, 500 μl PBS was added to the pellet. Twelve sterile and UV-treated glass beads (2 mm in diameter) were added into 1.5 ml tubes containing the sample. After incubating in room temperature for 10 min, the tubes with glass beads were shaken in an Eppendorf Mixer (Eppendorf, Germany) at 4°C for 45 min. Samples were centrifuged for 30 s at 3,000 rpm and 200 μl supernatant was used for DNA extraction in the EZ1 Advanced XL (tissue kit and bacteria card; Qiagen, Hilden, Germany). Finally, 22 μl sterile 10×TE-buffer (10 mM Tris, 1 mM EDTA, pH 8.0) was added to elution tubes.
Polymerase Chain Reaction
The 16S rRNA genes were amplified from samples using FAM- ENV1 (5’-AGA GTT TGA TII TGG CTC AG-3’) and ENV2 (5’-CGG ITA CCT TGT TAC GAC TT-3’) primers. Each PCR reaction had a volume of 25 μl including, 2.5 μl of 10x PCR buffer, 0.2 mMol of deoxyribonucleotide triphosphate, 0.4 mM of each primer: FAM-ENV1 and ENV2, 1.25 U of Top Taq DNA polymerase (Qiagen, Germany) and DNA template. Cycling parameters in an Eppendorf Mastercycler (Hamburg, Germany) were as follows: initial denaturation at 94°C for 3 min followed by 32 cycles of denaturation at 94°C for 1 min, 50°C for 45 s, extension 72°C for 2 min and final extension 72°C for 7 min. PCR products then were pooled, purified and concentrated by MinElute PCR Purification Kit (Qiagen, Hilden, Germany) according to the manufacturer’s protocol. The concentrations of purified DNA were measured using Nanodrop ND- 1000 spectrophotometer (Saveen Werner, Sweden).
Terminal Restriction Fragment Length Polymorphism (T-RFLP)
The purified DNA were digested with 10 U of restriction endonuclease MspI (Thermo Scientific, Germany) for 5 h at 37°C in a total volume of 10 μl. The digested amplicons were analyzed on an ABI 3130xl Genetic analyzer (Applied Biosystems, Foster city, CA, USA) with internal size standard GeneScan LIZ 600 (range 20 -600 bases) at DNA- lab (Skåne University Hospital, Malmö, Sweden). The electropherograms were analyzed with GeneMapper software version 4.1 (Applied Biosystems). Peak detection thresholds were set to 40 flourescence units for internal standards and T-RFs.
Quantitative PCR
Enterobacteriaceae and Lactobacillus were quantified using separate quantitative PCR (qPCR) according to Karlsson et al. (2012)40). In brief, ten-fold dilution series of purified plasmid DNA were made in elution buffer (EB, Qiagen) and primers Eco1457-F: CAT TGA CGT TAC CCG CAG AAG AAG C, Eco1652-R: CTC TAC GAG ACT CAA GCT TGC and Lact-F: AGC AGT AGG GAA TCT TCC A, Lact-R: CAC CGC TAC ACA TGG AG (Qiagen) were used for quantification of Enterobacteriaceae and Lactobacillus respectively41). The thermal cycling was performed in Rotor-Gene Q (Qiagen) with a program of 95°C for 5 min, followed by 40 cycles with denaturation at 95°C for 5 s, annealing, and elongation at 60°C for 10 and 20 s for Enterobacteriaceae and Lactobacillus respectively. Number of bacteria was expressed as numbers of 16S rRNA gene copies /g wet weight of rectal samples with detection limits of 102 genes/reaction.
Statistical analyses and calculation
Shannon and Simpson diversity indices were calculated according to Karlsson et al. (2012)40) with the modification that T-RFs within 40–580 base pair were considered. The differences in microbial diversity were tested by using Kruskal–Wallis rank sum test. The qPCR data were evaluated with Nemenyi-Damico-Wolfe-Dunn test for pairwise comparisons using package “coin” in the R program.
Kidney function (c)
Three biomarkers were measured and analysed: albumin, creatinine and protein HC (β1-microglobulin) and the albumin/creatinine ratio calculated. An early marker of glomerular damage is proteinuria which is measured through the concentration of albumin and the albumin/creatinine ratio. Urine creatinine concentrations were measured as an indicator of possible decreases in renal blood flow. Protein HC was measured to assess eventual tubular effects together with the protein HC/creatinine ratio to assess risk of proteinuria42). Albumin is a much larger molecule that would indicate a glomerular damage. The biomarkers were analysed applying a repeated measures ANOVA to compare interventions. The difference between pre- and post-exposure urinary levels were assessed using Wilcoxon’s tests for paired samples.
Results
Overall, rectal temperatures reached an average of 38.0°C (SD 0.3°C) and heart rate 126 b/min (Min 63; Max 171) during the whole exposure over the three interventions. Three subjects finished the exposure before the planned 3 h due to their core temperature exceeding 38.5°C, one for every intervention. This occurred at the end of the exposure in all three cases and was handled as missing data in the data analysis. As expected, no differences between genders were observed. In the final questionnaire, 7 out of 12 subjects reported a cooling effect and a feeling of being refreshed (10 out of 12) from buttermilk however, they preferred drinking water as it was perceived to relieve thirst better (11 out of 12).
Metabolic rates
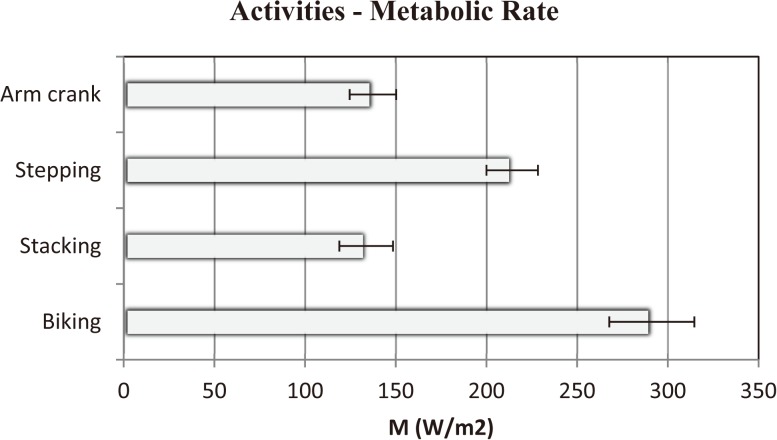
The metabolic rate of the different activities during the exposure can be seen in Fig. 2, keeping within medium load exercise (average 200 W/m2).
Fig. 2.
Metabolic rate of the activities during the exposure for all interventions.
Mean and SD. N=12
Weight loss and sweat evaporation
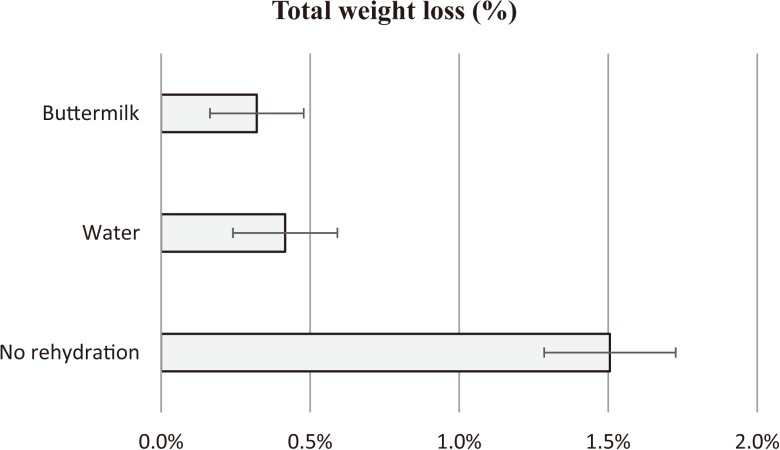
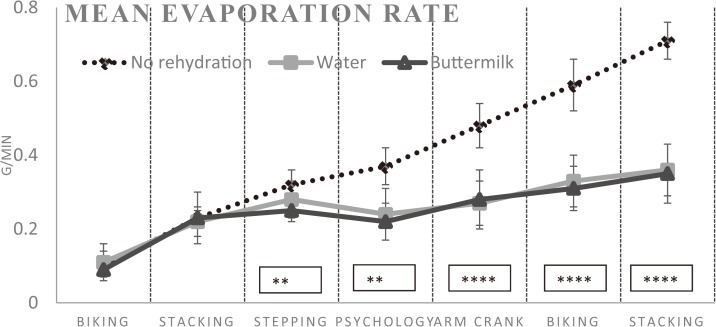
When not drinking, average total body weight loss was 1.11 kg (SD 0.26 kg) corresponding to 1.51% (SD 0.22%), when drinking water 1.01 kg (SD 0.16 kg) and buttermilk 0.95 kg (SD 0.14 kg) (Fig. 3). There was a significant effect of buttermilk in total body weight loss (p≤0.05) compared to when no rehydration was provided and when drinking water. Further, a significant difference (p≤0.05) (Fig. 3 and 4) was seen in the evaporation rate (body weight loss between tasks (g) / body weight / time (18 min) ((+0.1)) and dehydration level (% weight change between tasks) when no rehydration was provided versus when drinking water or buttermilk, suggesting a significantly lower sweat rate when hydrated (Fig. 3 and 4).
Fig. 3.
Total weight loss – nude weight before and after the exposure (%).
Mean and SD. N=12
Fig. 4.
Evaporation rates (g/min) based on body weight loss.
Mean and SD. N=12 **p≤0.01: ****p≤0.0001.
Core, skin, mean body temperature and heart rate
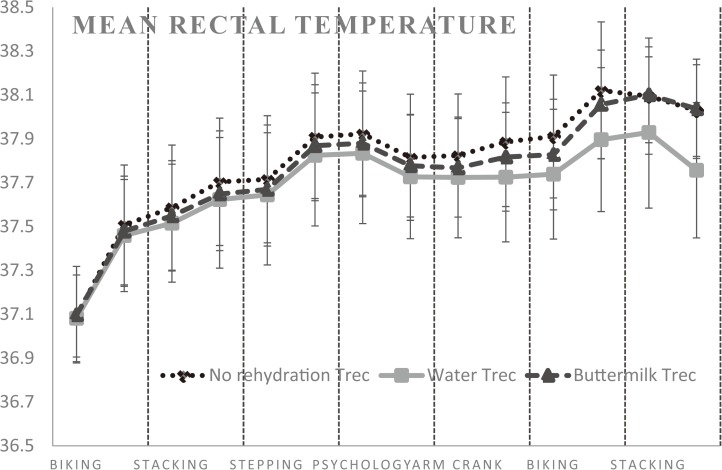
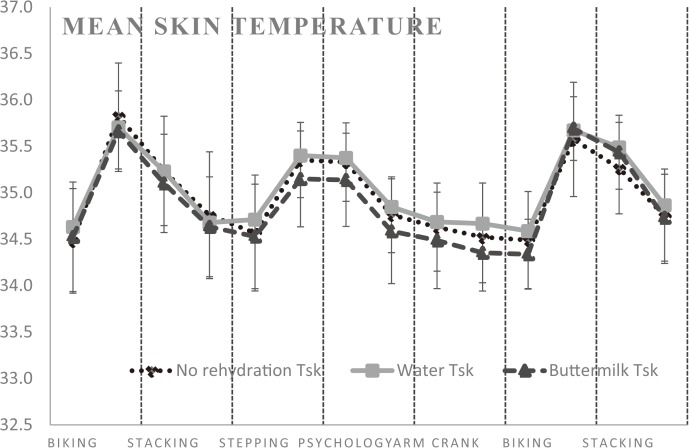
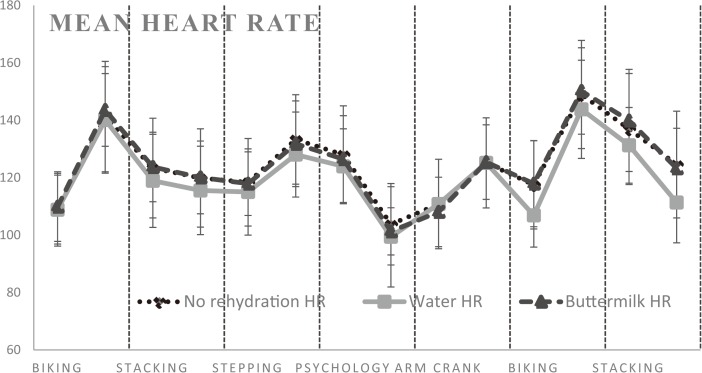
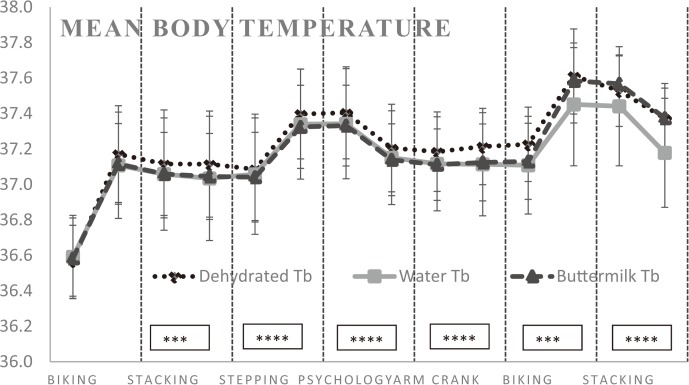
The statistical analysis on the rate of change (start temperature being the baseline) showed that core (rectal) temperature (dehydrated vs water p=0.66 and dehydrated vs buttermilk p=0.71) (Fig. 5) and mean skin temperature (dehydrated vs water p=0.07 and dehydrated vs buttermilk p=0.50) (Fig. 6) change were not statistically significant when comparing all the interventions amongst each other. The same was seen when comparing the rate of heart rate change (dehydrated vs water p=0.75 and dehydrated vs buttermilk p=0.66) (Fig. 7). However, when no rehydration was given, the mean body temperature (Tb) was significantly higher in comparison with buttermilk and water provision (p≤0.001) (Fig. 8) (Table 2).
Fig. 5.
Mean and SD of the rectal temperature (Trec) during the 3-h exposure.
N=12
Fig. 6.
Mean and SD of the weighted mean skin temperature (Tsk) during the 3-h exposure.
N=12
Fig. 7.
Mean and SD of the heart rate (HR) during the 3-h exposure.
N=12
Fig. 8.
Mean and SD of the mean body temperature (Tb) during the 3-h exposure.
N=12
*statistical significance compared with no rehydration (***p≤0.001, ****p≤0.0001, see Table 3)
Table 2. Summary Table of Statistical Significance based on the rate of change for each activity–the statistical analysis applied an ANOVA repeated measures and a Freidman’s test for statistics of significance (p<0.05).
| Activity | No rehydration – Buttermilk & Water | Water - Buttermilk | ||
|---|---|---|---|---|
| Mixed Model | Friedman’s Test | Mixed Model | ||
| Biking (15–33 min) |
Tb: **** | Tb: ** HR: * Discomfort: * Thirst: *** |
||
| Stacking (36–54 min) |
Tb: *** Dehy. Level (%): * |
Tb: ** Thermal: * Discomfort: *** Thirst: ** Dehy. Level (%): *** |
||
| Stepping (57–75 min) |
Tb: **** Dehy. Level (%): *** Ev. rate (g/min): *** |
Tb: *** Thermal: * Thirst: ** Dehy. Level (%): *** Ev. rate (g/min): ** |
Ev. rate (g/min): ** | |
| Psychology Test (75–90 min) |
Tb: **** Dehy. Level (%): **** Ev. rate (g/min): **** |
Tb: ** Discomfort: * Thirst: ** Borg: ** Dehy. Level (%): **** Ev. rate (g/min): ** |
||
| Arm crank (90–108 min) |
Tb: **** Ev. rate (g/min): **** |
Tb: *** Discomfort: ** Thirst: ** Borg: *** Dehy. Level (%): * Ev. rate (g/min): **** |
HR: * | |
| Biking (111–129 min) |
Tb: *** Ev. rate (g/min): **** |
Tb: * Tc: * HR: * Thirst: ** Borg: * Dehy. Level (%): **** Ev. rate (g/min): **** |
||
| Stacking (132–150 min) |
Tb: **** Dehy. Level (%): ** Ev. rate (g/min): **** Cortisol (rate nmol/L): * |
Tb: ** Thermal: * Discomfort: ** Thirst: *** Borg: ** Ev. rate (g/min): **** Cortisol (rate nmol/L): ** |
||
*p≤0.05, **p≤0.01, ***p≤0.001, ****p≤0.0001. Tb: Mean body temperature. In the mixed model, gender was included as co-variate. N=12
Subjective responses
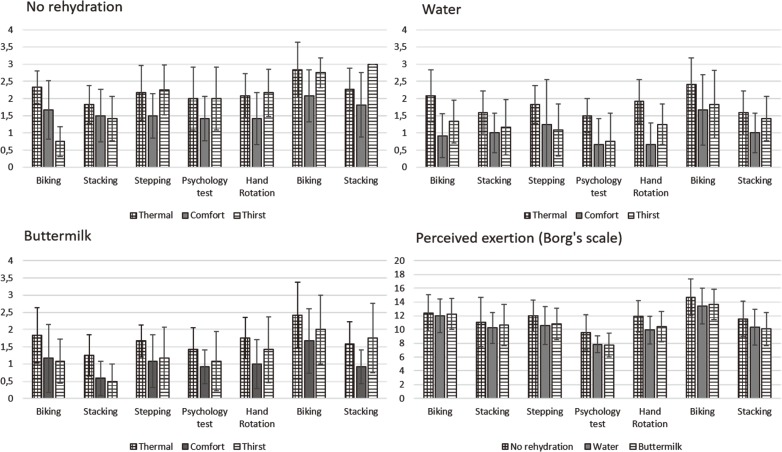
The statistical analysis of thermal sensation, thermal comfort, thirst and physical exertion scales applied an ANOVA repeated measures and a Freidman’s test for statistics of significance. The values showed significantly higher subjective responses in hydrated versus no rehydration conditions, in particular towards the end of the exposure (p≤0.05) (Table 2 and Fig. 9). Consistent with expectations, keeping hydrated when working for a prolonged period in the heat did significantly affect the subjects’ perceived thermal stress, workload and thirst sensation. Further, in all interventions subjects felt increasingly uncomfortable and hot following the heaviest activity, which was biking.
Fig. 9.
Perception scales results, mean values (SD).
N=12
Cortisol results
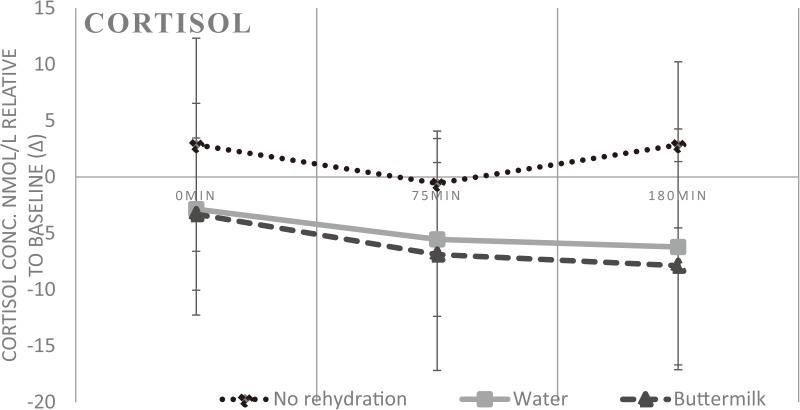
When working in the heat a general stress response was seen in the no rehydration samples towards the end of the exposure (p≤0.005) (Table 2) relative to baseline (∆). The no rehydration samples show a steady increase from the baseline sample, whereas both water and buttermilk samples have a decreasing trend (Fig. 10). Overall, individual influence dominated the cortisol data, with a clustering of data points and large SD. No gender difference was detected.
Fig. 10.
Cortisol concentration (nmol/L) relative to baseline (∆). Mean and SD in relation to the first sample in the morning (before entering the chamber).
N=12
Psychology tests (a)
No significant differences were found when comparing the no rehydration intervention (prior to the heat-stress exposure) to the two following interventions (during and after the heat-stress exposure) on the N-back, or the subjective assessment of anxiety (SAM) (Table 3). Furthermore, there were no significant differences found when comparing the hydration conditions (no rehydration, water and buttermilk) or correlations between the physiological markers and cognitive performance.
Table 3. Means and SD of SAM(subjective assessment of anxiety) and N-back (working memory capacity). The three rehydration conditions are collapsed since no significant differences between them were found.
| SAM* | N-back** | ||||||||
|---|---|---|---|---|---|---|---|---|---|
| Arousal | Control | Pos - Neg | Perform | RT | |||||
| N=1 | N=2 | N=1 | N=2 | ||||||
| First test (0–15 min) |
6.1 (1.7) | 5.2 (1.9) | 3.7 (1.7) | 0.95 (0.04) | 0.95 (0.05) | 529 (125) | 613 (227) | ||
| Second test (after 75–90 min) |
5.9 (1.7) | 5.4 (1.8) | 4.1 (1.6) | 0.97 (0.03) | 0.95 (0.03) | 503 (116) | 590 (210) | ||
| Third test (after 150–165 min) |
6.1 (1.7) | 5.7 (1.8) | 4.0 (1.6) | 0.95 (0.05) | 0.95 (0.05) | 489 (87) | 588 (219) | ||
*The participants assessed their degree of anxiety on the three aspects above on a scale from 1–9. **The tests were divided into 2 blocks. In the first block N=1, in the second N=2. Perform: the percentage correct answers, RT: response time in ms. N=12
Effects on the gut microbiota (b)
In the diversity of the dominating rectal microbiota, no significant difference (p>0.05) was observed when Shannon and Simpson indices were calculated and compared for the three interventions. Neither was any significant differences (p>0.05) in 16S rRNA gene copies/g rectal samples found for either Enterobacteriaceae or Lactobacillus among the three interventions (p>0.05).
Kidney function (c)
The analysis of variance between interventions showed that buttermilk had significantly lower creatinine concentrations in comparison to both water and no rehydration interventions (p≤0.05) suggesting buttermilk could have a protective effect. In the analysis of the pre-and post-exposure data, significant results were found in creatinine (p≤0.05) secretion suggesting the exposure itself affected creatinine concentrations. The albumin/creatinine ratios were mostly below the detection limit and were therefore not analyzed further (32 quantifiable observations out of 72). Three ratios were outside the reference interval: 3.47, 6.43 and 3.47 mg/mmol respectively. In normal well-functioning kidneys, the daily normal urine protein excretion is less than 150 mg protein and urinary excretion concentrations range from 30–300 mg per d for albumin and 30–300 g for creatinine. Many of the albumin samples were below the detection limit of 3 mg/L, corresponding to 21 samples out of 36 in the pre-exposure and 16 out of 36 in the post-exposure. Overall, individual influence dominated the analysis of the concentrations of albumin and creatinine. Most protein HC samples were below the detection limit of 5 mg/L and was therefore not analyzed further (only three samples exceeded this limit, two of them in the sample after exposure). The normal plasma concentration of protein HC is between 5–12 mg/L42). Hence, no concentrations measured indicated renal impairment in this study design. The albumin/creatinine and protein HC/creatinine ratio respectively did not exceed any limits for albuminuria nor proteinuria (30 mg/mmol). See Table 4 for median concentrations and range results.
Table 4. Median and range of urine samples.
| Albumin (mg/L) | Creatinine (mmol/L) | |||||
|---|---|---|---|---|---|---|
| Pre-exposure | Post-exposure | Pre-exposure | Post-exposure | |||
| No rehydration | Median | 3.5 | 11.9 | 18.4* | 24.5* | |
| Min | 3 | 3 | 4.5 | 14.4 | ||
| Max | 66.3 | 117.1 | 32.9 | 46.8 | ||
| Water | Median | 3 | 3 | 20.7* | 23.5* | |
| Min | 3 | 3 | 1.8 | 10.1 | ||
| Max | 20.7 | 29.4 | 43.5 | 73.5 | ||
| Buttermilk | Median | 3* | 4.4* | 20.1* | 18.9* | |
| Min | 3 | 3 | 4.6 | 14.4 | ||
| Max | 21.2 | 58.8 | 43.9 | 59.3 | ||
| Total | Median | 3 | 4.7 | 19.8 | 22.6 | |
| Min. | 1.8 | 3 | 4.5 | 10.1 | ||
| Max. | 66.3 | 117.1 | 43.9 | 73.5 | ||
N=12. *p≤0.05 (pre- and post-exposure - Wilcoxon’s test results).
Discussion
Summary of main results
In this study of a 3-h period of medium load physical work in 34°C and 60% RH, we found that in the physiological parameters measured, there was significant difference in mean body temperature raise between the no rehydration intervention compared with both buttermilk and water interventions, confirming a thermoregulatory benefit of keeping hydrated. This adds to previous work highlighting the importance of hydration in hot, strenuous occupational settings43) and the observed higher core temperature when dehydrated43, 44, 45, 46, 47, 48, 49). However, the rectal temperature, mean skin temperature and heart rate did not show any statistically significant change when comparing the interventions. Subjective perceptions of thermal sensation, thermal comfort, thirst and physical exertion showed significant changes between the no rehydration intervention and both buttermilk and water interventions, especially towards the end of the exposure. Staying hydrated in this study did affect the subjects’ experience in a positive way.
When drinking buttermilk, the total body weight loss was significantly less in comparison to both water and no rehydration interventions, proposing a hydration benefit. A significantly lower sweat rate was also observed when keeping hydrated in the water and buttermilk intervention, suggesting a response to the lower mean body temperature or a later onset of sweating similar to previous studies50). This result contradicts some research suggests a lowering of the sweat rate when hypohydrated49). However, the subjects in the present study did not reach such a status of dehydration, with an average of 1.5% body weight loss. It is also important to note that sweat rates may vary greatly between individuals, influencing the results for this research design with a low sample size50).
a) The cognitive effects of heat strain and physical work on arousal, working memory performance.
An increase in cortisol concentrations was seen in the no rehydration intervention whereas a decrease in the rate of change in saliva cortisol concentration was found in both water and buttermilk interventions. The circadian rhythm was theorized to be accounted for due to the standard protocol used51, 52); the test always started at the same time of the day about two hours after awakening (~09:00), suggesting the morning peak of cortisol had passed53, 54)). In addition, methodological issues were accounted for55, 56, 57, 58), for example, no exercise the day before together with a standardized breakfast and similar dinner the night before each of the three tests. The focus of analysis was on the response when spending 3 h in the climatic chamber. However, factors such as the morning commute and nervousness about the test ahead could have had a differing impact for each test day59, 60).
No heat stress or exercise dependent impairment was found in the cognitive tests. On the one hand, the result is in line with, for example Caldwell et al., (2012)37) who likewise found no changes in the cognitive capacity when testing the effect of auxiliary cooling and protective clothing in heat compared to control conditions. On the other hand, the results are not in line with several of the studies reviewed by Chang et al., (2012)23) who found a slight improvement of cognitive performance related to increased heat stress and exercise. The assessment of the experienced anxiety level (SAM) did not change during the experiment, possibly indicating that the participants felt able to control the situation, even though the physiological markers showed increased strain. Since the level of cognitive performance was retained, this could also be interpreted as the ability to control the situation was keep intact. However, as the result of the working memory test showed the performance was relatively close to perfect, it is possible that the cognitive load the test imposed might have been insufficient to detect a possible decrease at the studied heat stress level (Trec<38.5°C).
b) The impact of heat strain and physical work on the human gut microbiota.
We found no significant difference in the diversity of the dominating rectal microbial flora or the amount of Enterobacteriaceae and Lactobacillus when comparing interventions in this study. The analysis indicated that the microbiota differed widely between the study subjects. Inheritance and diet are two important factors influencing the composition of the gut microbiota of an individual confirming each person having an individual microbiota61). Further, diet is reported to be the key spark for the development of the intestinal microbiota structure62) and long-term dietary patterns largely determine the main phyla of the gut microbial profile63). Thus, for the short exposure in this study (3 h), dietary pattern may have been an important factor that may affect the gut bacterial flora. It also should be stressed that, the order of the three interventions were randomly decided and the time in between the interventions differed randomly depending on availability. Thus, it might be difficult to observe differences in the microbiota, as well as the cortisol level differences for this study design.
c) The effects of physical work and short term heat exposure on renal function.
The analysis of renal function between interventions suggested a protective effect of drinking buttermilk. When analyzing all pre-and post-exposure data, a significant urine concentration impact was found for this study design of short-term heat exposure combined with physical work. Loss of water by sweating and the decrease in renal blood flow due to physical work (blood flow is redistributed to the extremities) causes an increase in tubular reabsorption of water, sodium and urea which affects urine creatinine concentrations and reduces the glomerular filtration rate (GFR). Increased breakdown of muscle creatinine and purine could also contribute to this however, it is unlikely in this study30). These preliminary results do suggest an acute impact of short-term heat exposure combined with physical work on renal function and that buttermilk may have a protective effect on this impact. As a result, buttermilk consumption could have a protective effect for poor agricultural workers prone to chronic kidney disease (CKD)30, 31, 32, 33). A limitation in this analysis is that it was performed on frozen samples, and long-term storage can decrease concentrations32). However, no concentrations measured indicated renal impairment and hence, suggested a concentration effect of short term heat exposure and physical work due to the body’s fluid regulation27).
Workers participating in the field study2) drank buttermilk as a way of getting the extra energy and nutrition to work for longer without eating a solid meal, which could add to the heat strain. Buttermilk is often a major source of nutrition for the working day, which is the primary benefit in combination with the thermoregulatory effect described. A suggestion from the study is therefore to combine drinking buttermilk with water when working in the heat particularly for undernourished poor workers in India.
Wider implications
As the occupational heat stress situation is bound to worsen due to climate change1, 2, 3, 4, 5, 6, 7), additional preventive actions have to be implemented to prevent adverse health impacts for workers in hot strenuous occupational settings. Whilst the global community face increasing heat extremes, little has been studied on the effects of diets affecting thermal regulation, e.g. by increasing sweating, in the climate change research community and more focus has been on the mitigation potential of changing diets64) and its co-benefits to health65). Traditional low cost methods of coping with heat stress through diet,, such as drinking buttermilk could have an important role to play for managing future high heat levels.
Limitations and suggestions of improvement
An aspect to consider is that the subjects were not from India, but rather of European origin. This affects the experience of drinking buttermilk, as for some, it was the first time. Field studies are therefore necessary, involving poor under-nourished workers in order to further investigate the benefits of drinking buttermilk as the workers in the field described its cooling potential.
Suggestions of improvements from this study design include laboratory tests with longer duration to improve ecological validity combined with a lighter breakfast (to tease out hunger mechanisms), reduction of the initial water intake of 500 ml and introduce heavier work tasks, in order to make subjects more dehydrated.
Furthermore, one could speculate that the water intervention could prove to have a significant thermoregulatory effect if the study had been prolonged as the last activity had a p-value of 0.06 compared with no rehydration.
Conclusion
The study investigated the benefits of drinking a traditional Indian diluted yoghurt drink, buttermilk. The research was innovative in its multi-disciplinary study design, combining research questions linked to physical labour in a hot climate from different disciplines. It also links findings from a field study to further analysis in an experimental study design. Parameters included thermoregulation and hydration benefits and the impacts of work in a hot environment on gut microbiota, cognitive and renal function. Both water and buttermilk performed well in terms of whole body cooling, to lower the sweat rate, improved hydration and reduced hormonal stress. When subjects drank water or buttermilk they also reported that they felt significantly less hot, more comfortable, and less thirsty and that they were less physically exerted than in the no rehydration intervention. The saliva cortisol concentrations in the no rehydration intervention showed a stress response at the end of the exposure. With this study design, no differences in cognitive abilities or short term impacts on the gut microbiota were found between the groups. Effects were seen on the urine creatinine concentrations in the water and no rehydration interventions suggesting a protective effect of drinking buttermilk. Further, the exposure itself affected creatinine concentrations, suggesting a urine concentration impact of short-term heat exposure combined with physical work.
Our results are in line with other literature that indicates keeping hydrated reduces body temperature, sweat rate and hormonal stress and results in a reduction in the perception of feeling hot, uncomfortable, thirsty and physically exerted. Buttermilk was as good as water to mitigate heat strain in well-nourished subjects. However, further research is needed to study the advantages of buttermilk for undernourished workers. As the occupational heat stress situation is bound to worsen due to climate change, traditional low cost methods of coping with heat stress through diet, including consuming buttermilk, have a potential to be a part of managing heat exposure in the future.
Acknowledgements
We thank Dr. Håkan Lövkvist, Yiyi Xu and Dr. Roger Persson, from the Division of Occupational and Environmental Medicine at Lund University and Eja Pedersen from the Architecture Department for assistance in the statistical analysis and of the analysis of cortisol results respectively. We acknowledge the personnel at Labmedicin Skåne for sample analysis. We also thank Dr. Rebekah Lucas from Birmingham University for her assistance in designing the study. A special thanks also goes to Dr. Siv Ahrné, Dr Göran Molin, Dr. Gerd Johansson for assisting in study design and problem formulation and Amitava Halder for data collection.
Funding
This research did not receive any specific grant from funding agencies in the public, commercial, or non-profit sectors. However, we thank the Royal Physiographic Society in Lund for funding the gut microbiota and cortisol samples’ analysis.
Conflict of Interest
The authors declare that there is no conflict of interest regarding the publication of this paper.
References
- 1.Kjellstrom T, Holmer I, Lemke B (2009) Workplace heat stress, health and productivity—an increasing challenge for low and middle-income countries during climate change. Glob Health Action 2, 2047 (doi:10.3402/gha.v2i0.2047). [DOI] [PMC free article] [PubMed] [Google Scholar]
- 2.Lundgren K, Kuklane K, Venugopal V (2014) Occupational heat stress and associated productivity loss estimation using the PHS model (ISO 7933): a case study from workplaces in Chennai, India. Glob Health Action 7, 25283 (doi:10.3402/gha.v7.25283). [DOI] [PMC free article] [PubMed] [Google Scholar]
- 3.Sahu S, Sett M, Kjellström T (2013) Heat exposure, cardiovascular stress and work productivity in rice harvesters in India: implications for a climate change future. Ind Health 51, 424–31. [DOI] [PubMed] [Google Scholar]
- 4.Dunne JP, Stouffer RJ, John JG (2013) Reductions in labour capacity from heat stress under climate warming. Nat Clim Chang 3, 563–6. [Google Scholar]
- 5.Intergovernmental Panel on Climate Change (IPCC) (2013) IPCC Fifth Assessment Report: Climate Change 2013: the physical science basis. Geneva, Switzerland. [Google Scholar]
- 6.Lucas RAI, Epstein Y, Kjellstrom T (2014) Excessive occupational heat exposure: a significant ergonomic challenge and health risk for current and future workers. Extrem Physiol Med 3, 14. [DOI] [PMC free article] [PubMed] [Google Scholar]
- 7.Rummukainen M. (2013) Climate Change: changing means and changing extremes. Clim Change 121, 3–13. [Google Scholar]
- 8.Adams WM, Ferraro EM, Huggins RA, Casa DJ (2014) Influence of body mass loss on changes in heart rate during exercise in the heat: a systematic review. J Strength Cond Res 28, 2380–9 (doi:10.1519/JSC.0000000000000501). [DOI] [PubMed] [Google Scholar]
- 9.Pompermayer MG, Rodrigues R, Baroni BM, de Oliveira Lupion R, Meyer F, Vaz MA (2014) Rehydration during exercise in the heat reduces the physiological strain index in healthy adults. Rev Bras Cineantropom Desempenho Hum 16, 629–37 (doi:10.5007/1980-0037.2014v16n6p629). [Google Scholar]
- 10.Parsons K. (2003) Human Thermal Environments. Second Edition. New York, USA: Taylor and Francis. [Google Scholar]
- 11.Borg G. (1990) Psychophysical scaling with applications in physical work and the perception of exertion. Scand J Work Environ Health 16 Suppl 1, 55–8. [DOI] [PubMed] [Google Scholar]
- 12.Steinkraus K. (1996) Handbook of Indigenous Fermented Foods, 2nd Edition. Marcel Dekker, Inc. [Google Scholar]
- 13.Donovan SM, Shamir R (2014) Introduction to the yogurt in nutrition initiative and the First Global Summit on the health effects of yogurt. Am J Clin Nutr 99 Suppl, 1209S–11S. [DOI] [PubMed] [Google Scholar]
- 14.Berggren A, Lazou Ahrén I, Larsson N, Önning G (2011) Randomised, double-blind and placebo-controlled study using new probiotic lactobacilli for strengthening the body immune defence against viral infections. Eur J Nutr 50, 203–10. [DOI] [PubMed] [Google Scholar]
- 15.Karczewski J, Troost FJ, Konings I, Dekker J, Kleerebezem M, Brummer RJM, Wells JM (2010) Regulation of human epithelial tight junction proteins by Lactobacillus plantarum in vivo and protective effects on the epithelial barrier. Am J Physiol Gastrointest Liver Physiol 298, G851–9. [DOI] [PubMed] [Google Scholar]
- 16.Yachi S, Loreau M (1999) Biodiversity and ecosystem productivity in a fluctuating environment: the insurance hypothesis. Proc Natl Acad Sci USA 96, 1463–8. [DOI] [PMC free article] [PubMed] [Google Scholar]
- 17.Kalman DS, Feldman S, Krieger DR, Bloomer RJ (2012) Comparison of coconut water and a carbohydrate-electrolyte sport drink on measures of hydration and physical performance in exercise-trained men. J Int Soc Sports Nutr 9, 1–10. [DOI] [PMC free article] [PubMed] [Google Scholar]
- 18.Saat M, Singh R, Sirisinghe RG, Nawawi M (2002) Rehydration after exercise with fresh young coconut water, carbohydrate-electrolyte beverage and plain water. J Physiol Anthropol Appl Human Sci 21, 93–104. [DOI] [PubMed] [Google Scholar]
- 19.Mutha B, Chittora NK (2010) Management of heat stroke and heat exhaustion. Inter. J. Curr. Trends. Sci Tech (Paris) 1, 1–7. [Google Scholar]
- 20.McMorris T, Swain J, Smith M, Corbett J, Delves S, Sale C, Harris RC, Potter J (2006) Heat stress, plasma concentrations of adrenaline, noradrenaline, 5-hydroxytryptamine and cortisol, mood state and cognitive performance. Int J Psychophysiol 61, 204–15. [DOI] [PubMed] [Google Scholar]
- 21.Zuri RE, Cleary MA, Lopez R, Jones L, Moseley B (2004) Cognitive performance may be impaired by exercise in hot, humid environment: a preliminary investigation. Paper presented at 3rd annual College of Education Research Conference, Florida International University, Miami, Florida, USA.
- 22.Brisswalter J, Collardeau M, René A (2002) Effects of acute physical exercise characteristics on cognitive performance. Sports Med 32, 555–66. [DOI] [PubMed] [Google Scholar]
- 23.Chang YK, Labban JD, Gapin JI, Etnier JL (2012) The effects of acute exercise on cognitive performance: a meta-analysis. Brain Res 1453, 87–101. [DOI] [PubMed] [Google Scholar]
- 24.Audiffren M. (2009) Acute exercise and psychological functions: A cognitive energetic approach. In T. McMorris, P. D. Tomporowski, & M. Audiffren (Eds.), Exercise and cognitive function (pp. 3–39). Chichester, UK. [Google Scholar]
- 25.Adan A. (2012) Cognitive performance and dehydration. J Am Coll Nutr 31, 71–8. [DOI] [PubMed] [Google Scholar]
- 26.Linninge C. (2011) The Gut Bacterial Flora—Focus on Early Life and Physiological Traits. Lund University Thesis. ISBN 978-91-7422-269-2 [Google Scholar]
- 27.Glaser J, Lemery J, Rajagopalan B, Diaz HF, García-Trabanino R, Taduri G, Madero M, Amarasinghe M, Abraham G, Anutrakulchai S, Jha V, Stenvinkel P, Roncal-Jimenez C, Lanaspa MA, Correa-Rotter R, Sheikh-Hamad D, Burdmann EA, Andres-Hernando A, Milagres T, Weiss I, Kanbay M, Wesseling C, Sánchez-Lozada LG, Johnson RJ (2016) Climate Change and the Emergent Epidemic of CKD from Heat Stress in Rural Communities: The Case for Heat Stress Nephropathy. Clin J Am Soc Nephrol 11, 1472–83 (doi:10.2215/CJN.13841215). [DOI] [PMC free article] [PubMed] [Google Scholar]
- 28.Sanchez LD, Corwell B, Berkoff D (2006) Medical problems of marathon runners. The American Journal of Emergency Medicine 24, 608–15 (doi:10.1016/j.ajem.2006.01.023). [DOI] [PubMed] [Google Scholar]
- 29.Astrand P-O, Rodahl K, Dahl HA, Stromme SB (2003) Textbook of work physiology. Physiological basis of exercise, 4th edition. Human kinetics, Champaign IL. [Google Scholar]
- 30.Correa-Rotter R. (2012) Acute kidney injury and the development of chronic kidney disease. Role of novel biomarkers. In: Mesoamerican Nepropathy: Report from the first international research workshop on MeN. Available online: http://www.regionalnephropathy.org/wp-content/uploads/2013/04/Technical-Report-for-Website-Final.pdf. Accessed on the 4th of May 2016.
- 31.García-Trabanino R, Jarquín E, Wesseling C, Johnson RJ, González-Quiroz M, Weiss I, Glaser J, José Vindell J, Stockfelt L, Roncal C, Harra T, Barregard L (2015) Heat stress, dehydration, and kidney function in sugarcane cutters in El Salvador—A cross-shift study of workers at risk of Mesoamerican nephropathy. Environ Res 142, 746–55. [DOI] [PubMed] [Google Scholar]
- 32.Wesseling C, Aragón A, González M, Weiss I, Glaser J, Bobadilla NA, Roncal-Jiménez C, Correa-Rotter R, Johnson RJ, Barregard L (2016) Kidney function in sugarcane cutters in Nicaragua—A longitudinal study of workers at risk of Mesoamerican nephropathy. Environ Res 147, 125–32. [DOI] [PubMed] [Google Scholar]
- 33.Wesseling C, Crowe J, Hogstedt C, Jakobsson K, Lucas R, Wegman DH (2013) The epidemic of chronic kidney disease of unknown etiology in Mesoamerica: a call for interdisciplinary research and action. Am J Public Health 103, 1927–30 (doi:10.2105/AJPH.2013.301594). [DOI] [PMC free article] [PubMed] [Google Scholar]
- 34.Kuklane K, Dahlqvist C, Lundgren K, Lucas R, Halder A, Gao C, Jakobsson K, Hansson G-Å (2015) Assessment of workload in heat: an approach with accelerometers. Paper presented at the International Symposium on Firefighters and Heat Strain, Seoul National University, South Korea. p.62–67.
- 35.Havenith G. (2005) Temperature Regulation, Heat balance and Climatic Stress. Extreme Weather Events and Public Health Responses. Ch. 7: 69–80. [Google Scholar]
- 36.Ramanathan NL. (1964) A new weighting system for mean surface temperature of the human body. J Appl Physiol 19, 531–3. [DOI] [PubMed] [Google Scholar]
- 37.Caldwell JN, Patterson MJ, Taylor NAS (2012) Exertional thermal strain, protective clothing and auxiliary cooling in dry heat: evidence for physiological but not cognitive impairment. Eur J Appl Physiol 112, 3597–606 (doi:10.1007/s00421-012-2340-x). [DOI] [PubMed] [Google Scholar]
- 38.Bradley MM, Lang PJ (1994) Measuring emotion, the self-assessment manikin and the semantic differential. J Behav Ther Exp Psychiatry 25, 49–59. [DOI] [PubMed] [Google Scholar]
- 39.Conway ARA, Kane MJ, Bunting MF, Hambrick DZ, Wilhelm O, Engle RW (2005) Working memory span tasks: A methodological review and user’s guide. Psychon Bull Rev 12, 769–86. [DOI] [PubMed] [Google Scholar]
- 40.Karlsson CLJ, Önnerfält J, Xu J, Molin G, Ahrné S, Thorngren-Jerneck K (2012) The microbiota of the gut in preschool children with normal and excessive body weight. Obesity (Silver Spring) 20, 2257–61 (doi:10.1038/oby.2012.110). [DOI] [PubMed] [Google Scholar]
- 41.Magurran AE. (2013) Measuring biological diversity. John Wiley & Sons. [Google Scholar]
- 42.Elinder C. (2012) How to assess renal effects. In: Mesoamerican Nepropathy: Report from the first international research workshop on MeN. Available online: http://www.regionalnephropathy.org/wp-content/uploads/2013/04/Technical-Report-for-Website-Final.pdf. Accessed on the 4th of May 2016.
- 43.Kenefick RW, Sawka MN (2007) Hydration at the work site. J Am Coll Nutr 26 Suppl, 597S-603S. [DOI] [PubMed] [Google Scholar]
- 44.Cadarette BS, Sawka MN, Toner MM, Pandolf KB (1984) Aerobic fitness and the hypohydration response to exercise-heat stress. Aviat Space Environ Med 55, 507–12. [PubMed] [Google Scholar]
- 45.Cheung SS, McLellan TM (1998) Heat acclimation, aerobic fitness, and hydration effects on tolerance during uncompensable heat stress. J Appl Physiol (1985) 84, 1731–9. [DOI] [PubMed] [Google Scholar]
- 46.Neufer PD, Young AJ, Sawka MN (1989) Gastric emptying during exercise: effects of heat stress and hypohydration. Eur J Appl Physiol Occup Physiol 58, 433–9. [DOI] [PubMed] [Google Scholar]
- 47.Meyer LG, Horrigan DJ Jr, Lotz WG (1995) Effects of three hydration beverages on exercise performance during 60 hours of heat exposure. Aviat Space Environ Med 66, 1052–7. [PubMed] [Google Scholar]
- 48.Sawka MN, Gonzalez RR, Young AJ, Muza SR, Pandolf KB, Latzka WA, Dennis RC, Valeri CR (1988) Polycythemia and hydration: effects on thermoregulation and blood volume during exercise-heat stress. Am J Physiol 255, R456–63. [DOI] [PubMed] [Google Scholar]
- 49.Sawka MN, Montain SJ (2000) Fluid and electrolyte supplementation for exercise heat stress. Am J Clin Nutr 72 Suppl, 564S-72S. [DOI] [PubMed] [Google Scholar]
- 50.Taylor NAS, Machado-Moreira CA (2013) Regional variations in transepidermal water loss, eccrine sweat gland density, sweat secretion rates and electrolyte composition in resting and exercising humans. Extrem Physiol Med 2, 4 http://www.extremephysiolmed.com/content/2/1/4. [DOI] [PMC free article] [PubMed] [Google Scholar]
- 51.Kirschbaum C, Hellhammer DH (1999) Noise and Stress – salivary cortisol as a non-invasive measure of allostatic load. Noise Health 1, 57–66. [PubMed] [Google Scholar]
- 52.Kozlov AI, Kozlova MA (2014) [Cortisol as a marker of stress] Fiziol Cheloveka 40, 123–36. [PubMed] [Google Scholar]
- 53.Bigert C, Bluhm G, Theorell T (2005) Saliva cortisol—a new approach in noise research to study stress effects. Int J Hyg Environ Health 208, 227–30. [DOI] [PubMed] [Google Scholar]
- 54.Garde AH, Persson R, Hansen ÅM, Österberg K, Ørbæk P, Eek F, Karlson B (2009) Effects of lifestyle factors on concentrations of salivary cortisol in healthy individuals. Scand J Clin Lab Invest 69, 242–50. [DOI] [PubMed] [Google Scholar]
- 55.Hansen ÅM, Garde AH, Persson R (2008a) Measurement of salivary cortisol—effects of replacing polyester with cotton and switching antibody. Scand J Clin Lab Invest 68, 826–9. [DOI] [PubMed] [Google Scholar]
- 56.Hansen ÅM, Garde AH, Persson R (2008b) Sources of biological and methodological variation in salivary cortisol and their impact on measurement among healthy adults: a review. Scand J Clin Lab Invest 68, 448–58. [DOI] [PubMed] [Google Scholar]
- 57.Persson R, Garde AH, Hansen ÅM, Österberg K, Larsson B, Ørbæk P, Karlson B (2008) Seasonal variation in human salivary cortisol concentration. Chronobiol Int 25, 923–37. [DOI] [PubMed] [Google Scholar]
- 58.Persson R, Hansen ÅM, Ohlsson K, Balogh I, Nordander C, Orbaek P (2009) Physiological and psychological reactions to work in men and women with identical job tasks. Eur J Appl Physiol 105, 595–606 (doi:10.1007/s00421-008-0939-8). [DOI] [PubMed] [Google Scholar]
- 59.Chan S, Debono M (2010) Replication of cortisol circadian rhythm: new advances in hydrocortisone replacement therapy. Ther Adv Endocrinol Metab 1, 129–38. [DOI] [PMC free article] [PubMed] [Google Scholar]
- 60.Nicolson NA. (2008) Measurement of Cortisol. Ch. 3 in. L.J. Luecken, L.C. Gallo (Eds.) Handbook of Physiological Research Methods in Health Psychology, Sage Publications. p. 37–74. [Google Scholar]
- 61.Ley RE, Hamady M, Lozupone C, Turnbaugh PJ, Ramey RR, Bircher JS, Schlegel ML, Tucker TA, Schrenzel MD, Knight R, Gordon JI (2008) Evolution of mammals and their gut microbes. Science 320, 1647–51. [DOI] [PMC free article] [PubMed] [Google Scholar]
- 62.Yatsunenko T, Rey FE, Manary MJ, Trehan I, Dominguez-Bello MG, Contreras M, Magris M, Hidalgo G, Baldassano RN, Anokhin AP, Heath AC, Warner B, Reeder J, Kuczynski J, Caporaso JG, Lozupone CA, Lauber C, Clemente JC, Knights D, Knight R, Gordon JI (2012) Human gut microbiome viewed across age and geography. Nature 486, 222–7. [DOI] [PMC free article] [PubMed] [Google Scholar]
- 63.Moschen AR, Wieser V, Tilg H (2012) Dietary factors: major regulators of the gut microbiota. Gut Liver 6, 411–6. [DOI] [PMC free article] [PubMed] [Google Scholar]
- 64.Soret S, Mejia A, Batech M, Jaceldo-Siegl K, Harwatt H, Sabaté J (2014) Climate change mitigation and health effects of varied dietary patterns in real-life settings throughout North America. Am J Clin Nutr 100 Suppl 1, 490S-5S. [DOI] [PubMed] [Google Scholar]
- 65.Aston LM, Smith JN, Powles JW (2012) Impact of a reduced red and processed meat dietary pattern on disease risks and greenhouse gas emissions in the UK: a modelling study. BMJ Open 2, e001072 (doi:10.1136/bmjopen-2012-001072). [DOI] [PMC free article] [PubMed] [Google Scholar]


