Abstract
Recent laboratory experiments have shown that a first generation isoprene oxidation product, ISOPOOH, can decompose to methyl vinyl ketone (MVK) and methacrolein (MACR) on instrument surfaces, leading to overestimates of MVK and MACR concentrations. Formaldehyde (HCHO) was suggested as a decomposition co-product, raising concern that in situ HCHO measurements may also be affected by an ISOPOOH interference. The HCHO measurement artifact from ISOPOOH for the NASA In Situ Airborne Formaldehyde instrument (ISAF) was investigated for the two major ISOPOOH isomers, (1,2)-ISOPOOH and (4,3)-ISOPOOH, under dry and humid conditions. The dry conversion of ISOPOOH to HCHO was 3±2% and 6±4% for (1,2)-ISOPOOH and (4,3)-ISOPOOH, respectively. Under humid (RH= 40-60%) conditions, conversion to HCHO was 6±4% for (1,2)-ISOPOOH and 10±5% for (4,3)-ISOPOOH. The measurement artifact caused by conversion of ISOPOOH to HCHO in the ISAF instrument was estimated for data obtained on the 2013 September 6 flight of the Studies of Emissions and Atmospheric Composition, Clouds and Climate Coupling by Regional Surveys (SEAC4RS) campaign. Prompt ISOPOOH conversion to HCHO was the source for <4% of the observed HCHO, including in the high-isoprene boundary layer. Time-delayed conversion, where previous exposure to ISOPOOH affects measured HCHO later in flight, was conservatively estimated to be < 10% of observed HCHO and is significant only when high ISOPOOH sampling periods immediately precede periods of low HCHO.
1 Introduction
Formaldehyde (HCHO) in the atmosphere is predominantly a product of the gas phase oxidation of volatile organic compounds (VOCs). Oxidation of methane produces a global background of HCHO that accounts for ~80% of the global HCHO production (Fortems-Cheiney et al., 2012). The emissions of non-methane hydrocarbons (NMHCs), such as isoprene and its oxidation products, are more localized and create spatial heterogeneity in HCHO production due to their shorter atmospheric lifetime. HCHO is one of the few VOCs that can be measured from orbit (e.g., Chance et al., 2000) and is used to estimate global isoprene emissions from space (Marais et al., 2012; Millet et al., 2008; Palmer et al., 2003, 2006). Thus, accurate in situ HCHO measurements in isoprene-rich environments are crucial for refining our understanding of biogenic emissions and chemistry (Kaiser et al., 2015; Wolfe et al., 2016).
Measurements of the major first generation NO-dominated isoprene oxidation products, methyl vinyl ketone (MVK) and methacrolein (MACR), are frequently used in combination with isoprene measurements to understand biogenic oxidative environments (e.g., Karl et al., 2007). The instrumental techniques used to measure MVK and MACR, e.g. proton transfer reaction-mass spectrometry (PTR-MS) and gas chromatography (GC), have recently been shown to convert the major first generation HO2-dominated isoprene oxidation product, isoprene hydroxyhydroperoxides (ISOPOOH), into MVK or MACR with varying yields (Liu et al., 2013; Rivera-Rios et al., 2014). Conversion of ISOPOOH to MVK/MACR likely occurs via cleavage of the peroxy bond and is catalyzed by metal surfaces in instrument gas sampling systems (Rivera-Rios et al., 2014). The alkoxy radicals generated from breaking the peroxy bond subsequently decompose, in the presence of O2, to MVK (from (1,2)-ISOPOOH) or MACR (from (4,3)-ISOPOOH), HCHO, and HO2. Figure 1 shows the two major isomers of ISOPOOH and the observed hydrocarbon products of their instrument surface-mediated decomposition.
Figure 1.
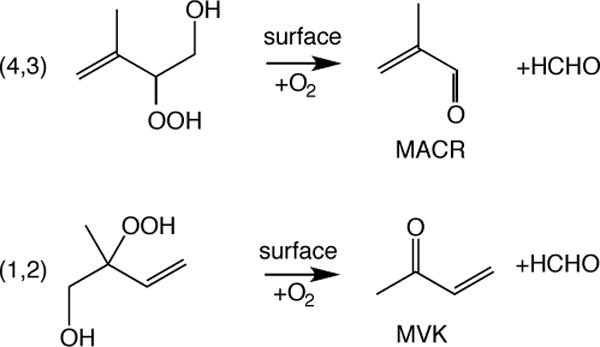
The major isomers of ISOPOOH and the observed hydrocarbon products of their instrument surface-mediated decomposition: methacrolein (MACR), methyl vinyl ketone (MVK), and formaldehyde (HCHO).
The equivalent amount of HCHO produced with MVK/MACR has led to some concern in the community that ISOPOOH causes a measurement artifact in HCHO instruments. The degree of conversion will be highly dependent on instrument configuration, including the nature of exposed surfaces, gas temperatures, and flow rates. This study was conducted to investigate the potential HCHO measurement interference from ISOPOOH for the NASA ISAF (In Situ Airborne Formaldehyde) HCHO instrument (Cazorla et al., 2015). The design of the ISAF instrument minimizes sample volume to maximize the instrument time response, and the small volume also minimizes surface area available for ISOPOOH conversion to HCHO. In addition, most exposed surfaces in the sample inlet and instrument are either fluoropolymer (PFA tubing) or coated in fluoropolymer (FluoroPel, Cytonix). Results for the Harvard formaldehyde instrument (DiGangi et al., 2011; Hottle et al., 2009) will be published separately as part of a larger study (FIXCIT/SOAS).
Experiments were conducted for both major ISOPOOH isomers, (1,2)-ISOPOOH and (4,3)-ISOPOOH, under both dry and humid conditions. The influence of inlet temperature and the composition of exposed surfaces were also investigated. A slow HCHO time constant, unique to the ISOPOOH conversion experiments and caused by the experimental conditions, is discussed. Finally, the experimental results for ISOPOOH conversion to HCHO and the laboratory time constant are discussed in the context of data from the Studies of Emissions and Atmospheric Composition, Clouds and Climate Coupling by Regional Surveys (SEAC4RS) campaign (Toon et al., 2016).
2 Experimental
In total, 10 experiments were conducted and are listed in Table 1. Experiments were performed for both major ISOPOOH isomers, (1,2)-ISOPOOH (ISOPBOOH) and (4,3)-ISOPOOH (ISOPDOOH), which were synthesized for these experiments (Rivera-Rios et al., 2014). Sample purity, as determined by NMR, was 78% for 1,2 ISOPOOH and 89% for 4,3 ISOPOOH with water, H2O2, and diethyl ether as the main impurities. For each isomer, two dry air ISOPOOH to HCHO conversion experiments and one humid air conversion experiment were performed. The effect of temperature and tubing material was investigated for each isomer with two experiments for each, one with varied ISAF inlet tubing temperatures and one with varied bare stainless steel tubing temperatures.
Table 1.
List of Experiments
| Experiment | Compound | Description |
|---|---|---|
| E1 | (1,2)-ISOPOOH | Dry |
| E2 | (1,2)-ISOPOOH | Dry, with and without untreated stainless tubing |
| E3 | (1,2)-ISOPOOH | Dry, ISAF inlet tubing temperature |
| E4 | (4,3)-ISOPOOH | Dry, with untreated stainless tubing |
| E5 | (4,3)-ISOPOOH | Dry |
| E6 | (4,3)-ISOPOOH | Dry, ISAF inlet tubing temperature |
| E7 | (1,2)-ISOPOOH | Humid |
| E8 | (4,3)-ISOPOOH | Humid |
| E9 | (4,3)-ISOPOOH | Dry |
| E10 | (1,2)-ISOPOOH | Dry |
All experiments were conducted using a ~1 m3 FEP chamber. ISOPOOH was introduced into the chamber by flowing 20 standard liters per minute (sLm) of dry air over droplets of ISOPOOH for 10-30 minutes, and the remaining chamber volume was filled with dry air. The sampling set-up is shown in Fig. 2. A sample line (6.35 mm OD PFA) connects the chamber to the instruments, with the sample flow determined by the sum of the individual instrument sample flows (~10 sLm typical). Two Caltech Chemical Ionization Mass Spectrometers (CIT-CIMS) instruments provided measurements of ISOPOOH (Crounse et al., 2006; Paulot et al., 2009; St. Clair et al., 2010; Nguyen et al., 2015) and the ISAF instrument (Cazorla et al., 2015) measured HCHO.
Figure 2.
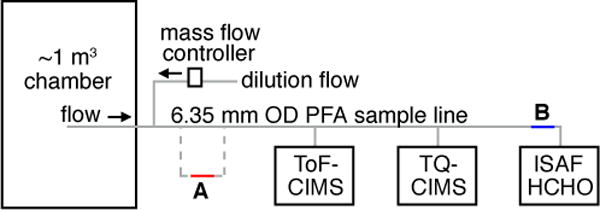
Experimental set up. During experiments with untreated stainless tubing, the sample line passed through the tubing (item A) before proceeding to the instruments. The ISAF inlet tubing location is noted by item B.
The ISAF flight inlet (Cazorla et al., 2015) was represented in the lab experiments by a 30.5 cm length of 6.35 mm OD silica-steel tubing (Fig. 2, item B) coated with a fluoropolymer (FluoroPel, Cytonix) and attached to a thermally controlled piece of aluminum using thermal epoxy. The equivalent tubing in the NASA DC-8 ISAF inlet is heated by two zones of heaters, each controlled by a thermostat: the first zone is controlled to 43-54° C (Honeywell 3100U-31440) and the second zone is controlled to 27-38° C (Honeywell 3100U-31437). The thermostats are mounted on two aluminum blocks that enclose and heat the inlet tubing; the inlet tubing and the sample flow are likely cooler than the control temperature. For the lab tests, a Minco heater controller (model CT325) provided variable and stable control temperatures, and a thermistor on the aluminum piece provided the temperature. In flight, flow rates through the DC-8 inlet are 10-25 sLm, with ~2.5 sLm of the total inlet flow subsampled by the instrument. During these experiments, the large inlet flow was not possible due to limited chamber volume. All of the inlet flow passed through the instrument and ranged from 3-7 sLm.
All experiments started with dry air flowing through the sample line to measure the background level of ISOPOOH and HCHO. Typical background mixing ratios were 120 and 150 pptv, respectively, and were influenced by recent experiments and sample tubing flushing time. For humid experiments, the dry background was followed by a humid background where the air was humidified by passing the dry air through a water bubbler. Because of dissolved trace HCHO in the liquid water and possible wall exchange effects, the background HCHO was typically higher under humid conditions than dry conditions by ~40-100 pptv. Any background HCHO that originated from a source other than the dry or humid air (e.g. from the ISOPOOH sample) was not accounted for and would bias the conversion rate high. After obtaining a background measurement, the instruments sampled the chamber air diluted by dry (or humid) air provided by a mass flow controller as shown in Fig. 2. By varying the amount of air provided by the flow controller, the instruments sampled multiple [ISOPOOH] from the same chamber fill.
The effect of ISAF inlet temperature on ISOPOOH conversion to HCHO was investigated by setting the inlet tube to multiple temperatures with a constant [ISOPOOH] and observing the change in measured HCHO. To demonstrate the potential for heated, untreated stainless steel to convert ISOPOOH to HCHO, another set of experiments was conducted where the sampling line from the chamber included a 15.4 cm section of 6.35 mm OD stainless steel tubing held inside a GC oven. The untreated tubing was inline between the chamber and the instruments (Fig. 2, item A).
3 Results and Discussion
3.1 Treatment of pre-instrument ISOPOOH to HCHO conversion
The HCHO data at the beginning of each conversion experiment contains a rapid increase followed by a multi-exponential decay. The ISOPOOH data exhibits a complementary time response such that if the HCHO decay is added to the ISOPOOH data, the result is a sharp transition from the background measurement to the final ISOPOOH mixing ratio. We infer that this represents a possible ISOPOOH to HCHO conversion upstream of the instruments and a correction should be applied to improve the calculation of the conversion rate within the ISAF instrument.
The HCHO data for the first ISOPOOH mixing ratio of each experiment were fit with a three term multi-exponential function to determine the appropriate time constants. The function (Eq. (1)) is:
| (1) |
All fits were constrained to require positive values for all fit parameters, and the data for post-experiment zero data could not be negative after subtraction of the decay fit. These constraints were imposed to prevent the fit from using one term from offsetting a non-physical value for another. The data were then fit using the selected three time constants (100 s, 800 s, 2000 s) to obtain the best pre-exponential terms to describe all of the experiments. The final fit was conducted with the ratio of the first three pre-exponential terms fixed relative to each other: A1 = A2 and A3 =0.25×A1. Two variables were optimized: A1, and c. The goal of the preceding steps was to obtain a three term exponential function that would reasonably describe the data from multiple experiments by fitting a single scaling factor (representing [ISOPOOH] at t=0) and a constant (representing a background). The ISOPOOH and HCHO used hereafter have the decay fit added and subtracted, respectively, from the original data. Figure S1 shows the effect of the correction on experiment E7 data as an example. Two experiments were not corrected for pre-instrument conversion: E5 and E10. Experiment E5 did not require this correction because it was a continuation of another experiment (E4) and so did not exhibit the same decay. E10 was excluded because HCHO data for the first set point was close to stable before the ISOPOOH concentration was changed, and the correction applied to the other experiments would be larger than the E10 data warrant.
3.2 Conversion under dry conditions
Two experiments for each of the ISOPOOH isomers (E1 and E10 for (1,2)-ISOPOOH; E5 and E9 for (4,3)-ISOPOOH) were conducted under dry conditions, and the results are listed in Table 2. Figure 3 shows the HCHO time series for one (1,2)-ISOPOOH experiment, as well as the linear regression of HCHO and ISOPOOH for the two experiments. The background signal for both species was subtracted from the data in all regression plots. The regressions give ~3% conversion of (1,2)-ISOPOOH to HCHO under dry conditions for both experiments fit separately and as one data set. The equivalent plots for (4,3)-ISOPOOH are shown in Fig. S2. For (4,3)-ISOPOOH, the fits for the two experiments differ significantly, with one experiment giving ~4% conversion and the second giving ~7% conversion. The second conversion experiments followed a humid experiment, and the prolonged exposure of surfaces to water vapor may have affected the subsequent conversion efficiency despite the sample line being purged with dry air for ~30 minutes in between experiments. The conversion of (4,3)-ISOPOOH to HCHO under dry conditions is estimated to be ~6%.
Table 2.
Conversion Fraction of ISOPOOH to HCHO in ISAF.
| Room Temperature Measurements | Conversion fraction | Estimated Uncertainty* |
|---|---|---|
| (1,2)-ISOPOOH, dry | 0.03 | 0.04 |
| (4,3)-ISOPOOH, dry | 0.06 | 0.03 |
| (1,2)-ISOPOOH, humid | 0.06 | 0.02 |
| (4,3)-ISOPOOH, humid | 0.10 | 0.04 |
The uncertainty was conservatively estimated using data without applying the pre-instrument conversion correction. The ratio of the HCHO data / ISOPOOH data, both background-subtracted, was plotted for each experiment. The highest value of the ratio, taken as a mean for each data section selected for the conversion fits (red dots in Fig. 3, top panel), was determined for each experiment and was averaged if there were two of that experiment type. For the dry experiments, the uncertainty was set to the difference between the highest value and the fit value. For the humid experiments, the uncertainty was taken as twice the difference.
Figure 3.
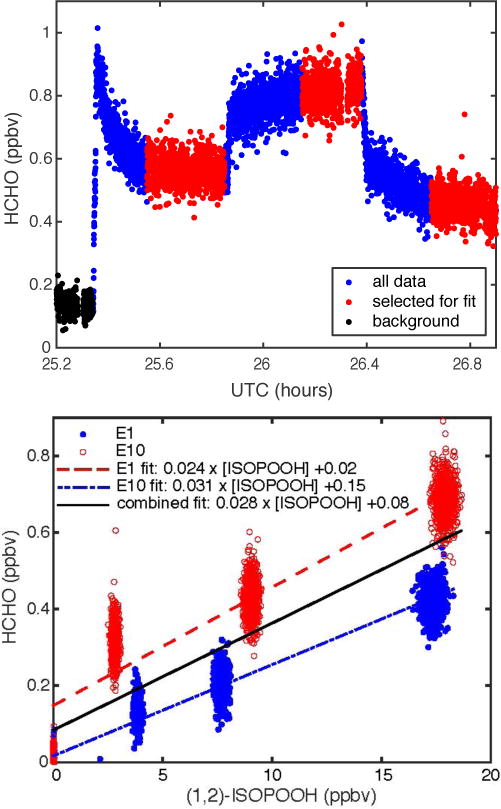
(Top Panel) Time series of dry air conversion experiment E10 with (1,2)-ISOPOOH at three ISOPOOH mixing ratios. (Bottom Panel) Linear fits to experiments E1 (dashed blue line) and E10 (dashed red line) individually and together (solid black line).
3.3 Conversion under humid conditions
One experiment for each ISOPOOH isomer was conducted under humid conditions to evaluate the influence of water vapor on ISOPOOH conversion to HCHO. The results are displayed in Table 2, and the data from the (1,2)-ISOPOOH (E7) and (4,3)-ISOPOOH (E8) experiments are shown in Figs. S3 and S4, respectively. Relative humidity was ~60% for E7 and ~40% for E8, and was determined using the ToF-CIMS CF3O− two water cluster signal (m/z=121). The conversion rate under humid conditions is higher than under dry conditions, and the HCHO-ISOPOOH relationship is not linear over the range of [ISOPOOH]. One possible cause of the nonlinearity is that the conversion process becomes saturated with respect to ISOPOOH at higher [ISOPOOH]. If saturation is occurring, the conversion rate relevant to field operation will be the higher rate obtained from the lower [ISOPOOH] data. Because of the uncertainty related to the higher background, surface equilibration, and nonlinearity, the estimated uncertainty for the ISOPOOH conversion fraction is higher for the humid experiments than the dry experiments. Using the lower [ISOPOOH] data where the relationship is linear, the (1,2)-ISOPOOH conversion to HCHO is determined to be 6% and for (4,3)-ISOPOOH it is 10%.
3.4 Temperature dependence of conversion
The effect of tubing temperature on ISOPOOH conversion to HCHO was evaluated for an ISAF inlet tubing proxy and for untreated stainless steel tubing. The data for both sets of experiments are displayed in Fig. 4. The inlet tubing was heated to multiple temperature set points, including near the upper limit of the thermostats that control the inlet heaters during flight (54° C). The data indicated no discernable temperature dependence of ISOPOOH to HCHO conversion for either ISOPOOH isomer. A section of untreated stainless steel tubing was heated to much higher temperatures to demonstrate the potential for ISOPOOH conversion on heated, untreated metal surfaces. The conversion fraction for a given temperature was also found to be a function of the gas-tubing contact time, determined by the length of exposed tubing and the sample flow rate, and should not be taken as quantitatively applicable to other configurations. Room temperature conversion rates for (4,3)-ISOPOOH were not significantly higher with the untreated stainless tubing in place than the experiments (Table 2) without it. At elevated temperatures, however, the conversion fraction steadily increased, reaching ~50% conversion for (1,2)-ISOPOOH at 160° C.
Figure 4.
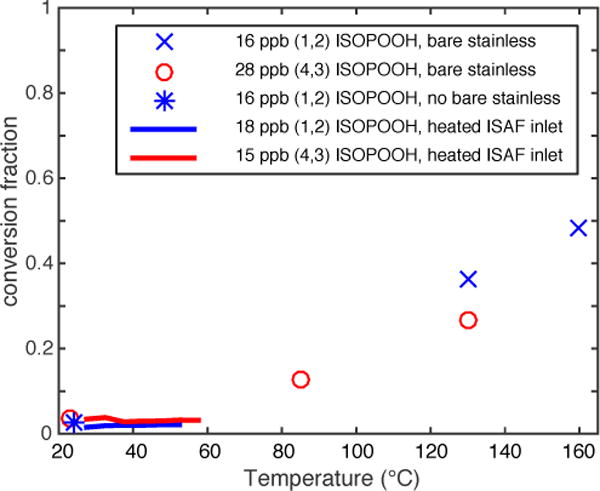
Temperature dependence of ISOPOOH conversion to HCHO for the ISAF inlet and untreated stainless steel tubing. Data shown with symbols (E2, E4) are mean values, and data shown with lines (E3, E6) are 5° C wide binned mean values.
3.5 Instrument time constant
The inherent HCHO time response of the ISAF instrument is rapid, measured as 0.19 s in the lab (Cazorla et al., 2015). The equilibration time indicated in the conversion experiments is considerably longer, though the time constants in the correction term described in Sect. 3 removed some of the equilibration time. During the conversion experiments, the ISAF instrument was exposed to ISOPOOH mixing ratios that are ~10 times higher than those present in the real atmosphere. Due to small conversion efficiencies, such high levels of ISOPOOH were necessary for discriminating signal changes over the chamber background. The high ISOPOOH levels, however, thoroughly coated the surface sites in the instrument that convert ISOPOOH to HCHO to a degree that is not relevant to the atmosphere, and resulted in a longer term HCHO source from ISOPOOH conversion that is unlikely to represent the instrument response in the real atmosphere. The potential interference from this time constant is nonetheless investigated in the following section.
3.6 Insight from SEAC4RS for conversion and time constant importance
The Studies of Emissions and Atmospheric Composition, Clouds and Climate Coupling by Regional Surveys (SEAC4RS) campaign included flight tracks over the Ozark Mountains to sample an isoprene rich, low-NOx region. Figure 5 shows data from the SEAC4RS flight (6 September 2013) with some of the highest ISOPOOH mixing ratios of the campaign. In the top panel, ISAF HCHO and CIT ISOPOOH data are plotted as a time series along with the possible HCHO from ISOPOOH conversion, assuming a conservative 8% prompt conversion rate. The percentage of the ISAF HCHO measurement that is potentially from prompt ISOPOOH conversion is shown in the bottom panel and does not exceed 4% of the measured HCHO. For comparison, the stated calibration accuracy of ISAF is ±10%. The conversion percent was set to zero for ISOPOOH values of ≤ 80 pptv to improve figure clarity.
Figure 5.
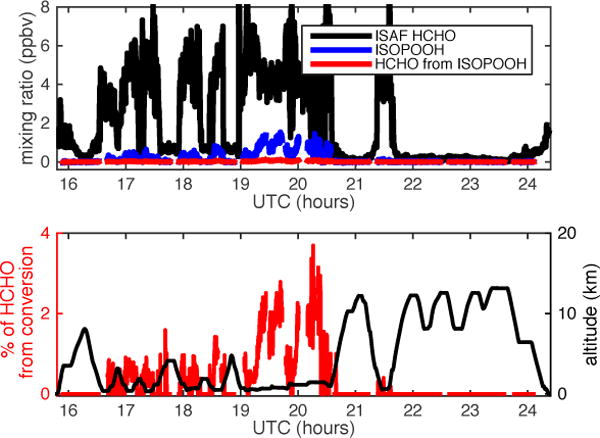
SEAC4RS flight on 6 September 2013. Top panel: Time series of ISAF HCHO (black line), CIT ISOPOOH (blue line), and potential HCHO signal from prompt ISOPOOH conversion (red line). Bottom panel: Percent of the HCHO observed that might be from prompt ISOPOOH conversion (red line) and aircraft altitude (black line).
While prompt conversion of ISOPOOH to HCHO was shown to have a negligible impact on the HCHO measurement, a transition from a high ISOPOOH, high HCHO, sampling environment to a low HCHO environment may result in a greater fractional influence of ISOPOOH conversion on measured HCHO, if a significant amount of ISOPOOH conversion continues after leaving the boundary layer. To illustrate the potential effects of delayed ISOPOOH conversion to HCHO on field data, a section of the SEAC4RS 2013 September 6 flight was selected where the aircraft rapidly ascended from an isoprene-rich boundary layer up to over 12 km (Fig. 6, bottom panel). The HCHO transitioned from ~4 ppbv to as low as ~100 pptv and ISOPOOH decreased from peaks of ~1.3 ppbv to ~0 pptv (Figs 5 and 6, top panels).
Figure 6.
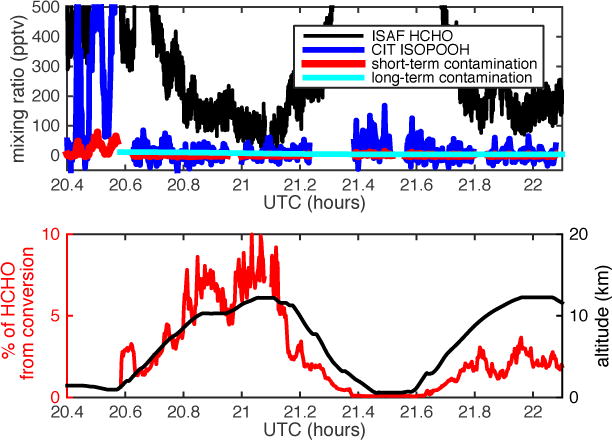
Hypothesized HCHO signal from delayed ISOPOOH conversion, shown for part of SEAC4RS flight on 6 September 2013. Top panel: Time series of ISAF HCHO (black line), CIT ISOPOOH (blue line), potential HCHO signal from prompt ISOPOOH conversion (red line), and potential HCHO signal from delayed ISOPOOH conversion (cyan line). Bottom panel: Altitude (black line) and percentage of HCHO that might be from delayed ISOPOOH conversion (red line).
The instrument response to a rapid decrease in ISOPOOH and HCHO mixing ratios was modeled using the end of Experiment E8, where the sample line source was transferred from the chamber to clean humid air and subsequently to dry air. The decay of the HCHO signal was first normalized to the initial mixing ratio so that at time=0, HCHO=1. The sample line response was then removed from the fractional HCHO decay by subtracting the fractional ISOPOOH decay, which was assumed to be representative of the sample line response. The remaining fractional HCHO decay represents only the instrument response.
The modeled long-term HCHO source from ISOPOOH conversion is shown in Fig. 6, top panel. The HCHO decay started at time = 20.582 h UTC, which was chosen to coincide with the rapid drop in ambient HCHO mixing ratio. The fractional decay of the HCHO from ISOPOOH conversion from Experiment E8 was applied to the in situ data, with the starting value of the in situ HCHO decay being the mean HCHO from rapid conversion (8% of ISOPOOH) over the hour prior to leaving the boundary layer. The bottom panel of Fig. 6 shows the percentage of observed HCHO that would be from ISOPOOH conversion under the modeled assumptions. The HCHO from ISOPOOH conversion accounts for less than 10% of the measured HCHO and is largely controlled by low ambient HCHO rather than large amounts of HCHO from ISOPOOH conversion. The delayed HCHO source from ISOPOOH is likely a function of exposure time in addition to ISOPOOH mixing ratio. The HCHO decay from Experiment E8 followed exposure to 6-19 ppbv of ISOPOOH over ~ 3 hours, resulting in an integrated ISOPOOH exposure that greatly exceeds in situ sampling conditions. As a result, the estimated error shown in Fig. 6, bottom panel, may be an upper limit.
4 Summary and Conclusions
In the ambient atmosphere, (1,2)-ISOPOOH will be the predominant isomer due to first generation isoprene RO2 branching and isomerization (Bates et al., 2014; Teng et al., in preparation), and more rapid reaction of (4,3)-ISOPOOH with OH (St. Clair et al., 2015). Consequently, the laboratory experiments with (1,2)-ISOPOOH are most relevant to the potential HCHO artifact in ISAF. Under dry conditions, only ~3% of the (1,2)-ISOPOOH was converted to HCHO. Under humid conditions closer to typical high ISOPOOH sampling conditions, the conversion is still only ~6% of ISOPOOH, albeit with higher uncertainty. For comparison, the stated ISAF measurement uncertainty is ±10% for calibration and ±20 pptv for offset. Prompt conversion of ISOPOOH to HCHO in the ISAF instrument will cause a negligible error in the measurement of ambient HCHO.
The instrument surfaces that converted ISOPOOH to HCHO in ISAF were thoroughly coated with ISOPOOH by long exposure to high ISOPOOH concentrations, and background HCHO was subsequently elevated for a time period orders of magnitude longer than suggested by the instrument time constant (0.19 s). The slow time response may be an artifact unique to the laboratory experiments, or it may be an indication of a delayed conversion of ISOPOOH to HCHO that could cause an error in the measured HCHO after exposure to ISOPOOH. The delayed conversion would manifest for upper tropospheric measurements that follow closely after extended boundary layer sampling in an isoprene-rich area. For the SEAC4RS campaign example given, the error was still within the stated ISAF measurement uncertainty.
Heating of the treated ISAF inlet tubing over the possible operation range had no effect on the conversion rate, while heating untreated stainless steel tubing converted a substantial fraction (~50% at 160° C) of ISOPOOH to HCHO with high (>80%) molar conversion of ISOPOOH to HCHO, as determined by dividing the change in ISOPOOH by the change in HCHO. The high conversion rate on the untreated stainless steel tubing suggests attributes that should be avoided in instrument and inlet design to minimize conversion of hydroperoxide compounds. These experiments suggest that instruments with any amount of metal surface uncoated with a fluoropolymer, particularly if the surface is heated, are likely susceptible to conversion of organic peroxides such as ISOPOOH. The most likely site for conversion in ISAF is the MKS pressure controller upstream of the detection cell. As a step toward eliminating the small conversion in ISAF, this component will be replaced with a version that has smaller unflushed volumes and fluoropolymer-coated surfaces.
Future work will extend the testing of instrumentation towards interferences from additional reactive peroxides that can be abundant in the boundary layer, e.g. hydroxymethyl hydrogen peroxide.
Supplementary Material
Acknowledgments
FNK and JCR were supported by the National Science Foundation (AGS 1628491, 1628530, 1247421, 1321987). JMSC, GMW, and TFH were supported by NASA (NNH12ZDA001N-UACO). MJK was supported by the National Science Foundation (AGS PRF 1524860).
Footnotes
Supplementary material related to this article is available.
Data availability
SEAC4RS campaign data used in this paper can be obtained via the following DOI: 10.5067/Aircraft/SEAC4RS/Aerosol-TraceGas-Cloud
References
- Bates KH, Crounse JD, St Clair JM, Bennett NB, Nguyen TB, Seinfeld JH, Stoltz BM, Wennberg PO. Gas phase production and loss of isoprene epoxydiols. J Phys Chem A. 2014;118:1237–1246. doi: 10.1021/jp4107958. [DOI] [PubMed] [Google Scholar]
- Cazorla M, Wolfe GM, Bailey SA, Swanson AK, Arkinson HL, Hanisco TF. A new airborne laser-induced fluorescence instrument for in situ detection of formaldehyde throughout the troposphere and lower stratosphere. Atmos Meas Tech. 2015;8:541–552. doi: 10.5194/amt-8-541-2015. [DOI] [Google Scholar]
- Chance K, Palmer PI, Spurr RJD, Martin RV, Kurosu TP, Jacob DJ. Satellite observations of formaldehyde over North America from GOME. Geophys Res Lett. 2000;27:3461–3464. doi: 10.1029/2000GL011857. [DOI] [Google Scholar]
- Crounse JD, McKinney KA, Kwan AJ, Wennberg PO. Measurement of gas-phase hydroperoxides by chemical ionization mass spectrometry. Anal Chem. 2006;78:6726–6732. doi: 10.1021/ac0604235. [DOI] [PubMed] [Google Scholar]
- DiGangi JP, Boyle ES, Karl T, Harley P, Turnipseed A, Kim S, Cantrell C, Maudlin RL, III, Zheng W, Flocke F, Hall SR, Ullmann K, Nakashima Y, Paul JB, Wolfe GM, Desai AR, Kajii Y, Guenther A, Keutsch FN. First direct measurements of formaldehyde flux via eddy covariance: implications for missing in-canopy formaldehyde sources. Atmos Chem Phys. 2011;11:10565–10578. doi: 10.5194/acp-11-10565-2011. [DOI] [Google Scholar]
- Fortems-Cheiney A, Chevallier F, Pison I, Bousquet P, Saunois M, Szopa S, Cressot C, Kurosu TP, Chance K, Fried A. The formaldehyde budget as seen by a global-scale multi-constraint and multi-species inversion system. Atmos Chem Phys. 2012;12:6699–6721. doi: 10.5194/acp-12-6699-2012. [DOI] [Google Scholar]
- Hottle JR, Huisman AJ, Digangi JP, Kammrath A, Galloway MM, Coens KL, Keutsch FN. Fluorescence-based instrument for in-situ measurements of atmospheric formaldehyde. Environ Sci Technol. 2009;43:790–795. doi: 10.1021/es801621f. [DOI] [PubMed] [Google Scholar]
- Kaiser J, Wolfe GM, Min KE, Brown SS, Miller CC, Jacob DJ, de Gouw JA, Graus M, Hanisco TF, Holloway J, Peischl J, Pollack IB, Ryerson TB, Warneke C, Washenfelder RA, Keutsch FN. Reassessing the ratio of glyoxal to formaldehyde as an indicator of hydrocarbon precursor speciation. Atmos Chem Phys. 2015;15:7571–7583. doi: 10.5194/acp-15-7571-2015. [DOI] [Google Scholar]
- Karl T, Guenther A, Yokelson RJ, Greenberg J, Potosnak M, Blake DR, Artaxo P. The tropical forest and fire emissions experiment: Emission, chemistry, and transport of biogenic volatile organic compounds in the lower atmosphere over Amazonia. J Geophys Res. 2007;112(D18):D18302. doi: 10.1029/2007JD008539. [DOI] [Google Scholar]
- Liu YJ, Herdlinger-Blatt I, McKinney KA, Martin ST. Production of methyl vinyl ketone and methacrolein via the hydroperoxyl pathway of isoprene oxidation. Atmos Chem Phys. 2013;13:5715–5730. doi: 10.5194/acp-13-5715-2013. [DOI] [Google Scholar]
- Marais EA, Jacob DJ, Kurosu TP, Chance K, Murphy JG, Reeves C, Mills G, Casadio S, Millet DB, Barkley MP, Paulot F, Mao J. Isoprene emissions in Africa inferred from OMI observations of formaldehyde columns. Atmos Chem Phys. 2012;12:6219–6235. doi: 10.5194/acp-12-6219-2012. [DOI] [PMC free article] [PubMed] [Google Scholar]
- Millet DB, Jacob DJ, Boersma KF, Fu TM, Kurosu TP, Chance K, Heald CL, Guenther A. Spatial distribution of isoprene emissions from North America derived from formaldehyde column measurements by the OMI satellite sensor. J Geophys Res Atmos. 2008;113:1–18. doi: 10.1029/2007JD008950. [DOI] [Google Scholar]
- Nguyen TB, Crounse JD, Teng AP, St Clair JM, Paulot F, Wolfe GM, Wennberg PO. Rapid deposition of oxidized biogenic compounds to a temperate forest. Proc Natl Acad Sci. 2015;112:E392–E401. doi: 10.1073/pnas.1418702112. [DOI] [PMC free article] [PubMed] [Google Scholar]
- Palmer PI, Jacob DJ, Fiore AM, Martin RV, Chance K, Kurosu TP. Mapping isoprene emissions over North America using formaldehyde column observations from space. J Geophys Res Atmos. 2003;108 doi: 10.1029/2002JD002153. [DOI] [Google Scholar]
- Palmer PI, Abbot DS, Fu T, Jacob DJ, Chance K, Kurosu TP, Guenther A, Wiedinmyer C, Stanton JC, Pilling MJ, Pressley SN, Lamb B, Sumner AL. Quantifying the seasonal and interannual variability of North American isoprene emissions using satellite observations of the formaldehyde column. J Geophys Res. 2006;111(D12):D12315. doi: 10.1029/2005JD006689. [DOI] [Google Scholar]
- Paulot F, Crounse JD, Kjaergaard HG, Kürten A, St Clair JM, Seinfeld JH, Wennberg PO. Unexpected epoxide formation in the gas-phase photooxidation of isoprene. Science. 2009;325:730–733. doi: 10.1126/science.1172910. [DOI] [PubMed] [Google Scholar]
- Rivera-Rios JC, Nguyen TB, Crounse JD, Jud W, St Clair JM, Mikoviny T, Gilman JB, Lerner BM, Kaiser JB, de Gouw J, Wisthaler A, Hansel A, Wennberg PO, Seinfeld JH, Keutsch FN. Conversion of hydroperoxides to carbonyls in field and laboratory instrumentation: Observational bias in diagnosing pristine versus anthropogenically controlled atmospheric chemistry. Geophys Res Lett. 2014;41:8645–8651. doi: 10.1002/2014GL061919. [DOI] [Google Scholar]
- St Clair JM, McCabe DC, Crounse JD, Steiner U, Wennberg PO. Chemical ionization tandem mass spectrometer for the in situ measurement of methyl hydrogen peroxide. Rev Sci Instrum. 2010;81:094102. doi: 10.1063/1.3480552. [DOI] [PubMed] [Google Scholar]
- St Clair JM, Rivera-Rios JC, Crounse JD, Knap HC, Bates KH, Teng AP, Jørgensen S, Kjaergaard HG, Keutsch FN, Wennberg PO. Kinetics and Products of the Reaction of the First-Generation Isoprene Hydroxy Hydroperoxide (ISOPOOH) with OH. J Phys Chem A. 2015 doi: 10.1021/acs.jpca.5b06532. [DOI] [PubMed] [Google Scholar]
- Teng AP, Crounse JD, Wennberg PO. Isoprene peroxy radical dynamics. doi: 10.1021/jacs.6b12838. n.d. [DOI] [PubMed] [Google Scholar]
- Toon OB, Maring H, Dibb J, Ferrare R, Jacob DJ, Jensen EJ, Luo ZJ, Mace GG, Pan LL, Pfister L, Rosenlof KH, Redemann J, Reid JS, Singh HB, Thompson AM, Yokelson R, Minnis P, Chen G, Jucks KW, Pszenny A. Planning, implementation, and scientific goals of the Studies of Emissions and Atmospheric Composition, Clouds and Climate Coupling by Regional Surveys (SEAC4RS) field mission. J Geophys Res Atmos. 2016;121:4967–5009. doi: 10.1002/2015JD024297. [DOI] [Google Scholar]
- Wolfe GM, Kaiser J, Hanisco TF, Keutsch FN, De Gouw JA, Gilman JB, Graus M, Hatch CD, Holloway J, Horowitz LW, Lee BH, Lerner BM, Lopez-Hilifiker F, Mao J, Marvin MR, Peischl J, Pollack IB, Roberts JM, Ryerson TB, Thornton JA, Veres PR, Warneke C. Formaldehyde production from isoprene oxidation across NOx regimes. Atmos Chem Phys. 2016;16:2597–2610. doi: 10.5194/acp-16-2597-2016. [DOI] [PMC free article] [PubMed] [Google Scholar]
Associated Data
This section collects any data citations, data availability statements, or supplementary materials included in this article.


