

Abstract
It is inherently difficult to quantitate nucleic acid analytes with most isothermal amplification assays. We developed loop‐mediated isothermal amplification (LAMP) reactions in which competition between defined numbers of “false” and “true” amplicons leads to order of magnitude quantitation by a single endpoint determination. These thresholded LAMP reactions were successfully used to directly and quantitatively estimate the numbers of nucleic acids in complex biospecimens, including directly from cells and in sewage, with the values obtained closely correlating with qPCR quantitations. Thresholded LAMP reactions are amenable to endpoint readout by cell phone, unlike other methods that require continuous monitoring, and should therefore prove extremely useful in developing one‐pot reactions for point‐of‐care diagnostics without needing sophisticated material or informatics infrastructure.
Keywords: copy number, isothermal amplification, nucleic acids, point-of-care diagnostics, signal threshold
Lighting the LAMP: We developed loop‐mediated isothermal amplification (LAMP) reactions transduced by oligonucleotide strand displacement (OSD) probes in which competition between defined numbers of “false” (introduced) and “true” (analyte) amplicons leads to order of magnitude analyte quantitation by a single visual endpoint determination. These LAMP‐OSD reactions directly and quantitatively estimated numbers of nucleic acids in complex biospecimens.
Nucleic acid quantitation is vital for many diagnostic applications. Current methods involve absolute digital‐1 or standard‐based quantitation following real‐time signal measurement during polymerase chain reaction (PCR).2 Both approaches require complex instrumentation and trained operators, which tends to limit their application at point‐of‐care (POC).3
In contrast, isothermal nucleic acid amplification methods, such as loop‐mediated isothermal amplification (LAMP), have gained increasing interest for POC applications,4 as these assays can be carried out and assessed with instrumentation as simple as a paper‐based apparatus5 and off‐the‐shelf devices such as glucometers,6 pregnancy test kits,7 or even a cell phone.8 However, most isothermal amplification assays provide yes/no answers, rather than a measure of how much of a pathogen or biomarker is present in a diagnostic sample. Attempts have been made to measure LAMP amplicon accumulation in real time by fluorescence intensity derived from intercalators or by turbidity generated by the precipitation of Mg2+–pyrophosphate complexes, and initial template numbers have been correlated with a so‐called time‐to‐positive signal (Tp or TTP; similar to Ct value in real‐time PCR).9 However, such approaches are subject to high background (nonspecific intercalation or precipitation) and cannot distinguish the spurious amplicons that plague many isothermal amplification reactions.10 A single measurement at a fixed time prior to LAMP completion, chosen based on a known correlation between template amounts and Tp values, might also enable template quantitation.11 However, in addition to the deficiencies already described, this method relies on capturing a LAMP signal during a narrow window of opportunity that is likely to be greatly influenced by sample purity and environmental conditions, and thus is also not robust for POC applications.
In our previous work, we overcame spurious LAMP signals by developing oligonucleotide strand displacement (OSD) probes that, like TaqMan probes in PCR, sequence‐specifically transduce LAMP amplicons into readable signals.12 OSD probes are short, hemiduplex DNAs in which the short, single‐stranded region in the longer strand acts as a toehold that hybridizes to complementary sequences in LAMP amplicon loops and initiates strand exchange,13 ultimately resulting in hybridization of the longer, fluorophore‐labeled strand to the LAMP loop and concomitant displacement of the quencher‐labeled strand (Figure 1). The ensuing, real‐time fluorescence accumulation allows OSDs to sequence‐specifically report single‐ or multiplex accumulation of LAMP amplicons from tens to a few hundred nucleic acid molecules with minimal interference from non‐specific amplicons or inhibitors. This innovation significantly enhances the diagnostic applicability of LAMP by allowing it to match not only the sensitivity but also the specificity of real‐time PCR.
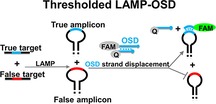
Figure 1.
Schematic of thresholded LAMP‐OSD. True and false targets have the same sequence, length, and primer‐binding sites but differ in their OSD‐binding region. OSD‐binding true target sequences are depicted in green. The corresponding sequences in the false targets (red) are randomized to eliminate complementarity with the OSD.
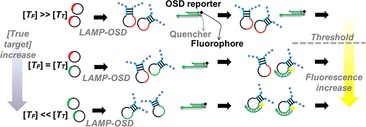
The application of strand exchange circuitry to diagnostics not only greatly improves signal‐to‐noise but also gives access to a range of tools that can be leveraged from the field of DNA computation.14 For instance, simple “seesaw” gate motifs that use reversible strand exchange reactions can be employed to evaluate universal Boolean functions and create chained nucleic acid computations.15 Seesaw‐gated “threshold” circuits that yield signal output only when the amount of input overtakes a preset concentration have been built into complex neural networks.16
In the present work, we leveraged OSD probes to develop a robust, POC‐amenable method for semi‐quantitative LAMP that enables reliable measurement of initial target copies on an order of magnitude scale by a simple, one‐time determination of the presence or absence of visible OSD fluorescence at the reaction endpoint. This is accomplished by diverting replicative resources from true targets (T T) into exogenously introduced false targets (T F). False targets contain the same sequence, length, primer‐binding sites, and amplification kinetics as true targets but lack complementarity to the OSD reporter (Figure 1). By carrying out amplification reactions at different levels of T F/T T, there will be a ratio at which no signal is generated, because the true target has been overwhelmed by the false. More quantitatively, when LAMP reactions are thresholded with an amount of T F that is equal to the amount of T T present in the system, only half of the total amplicons will originate from T T, and therefore, the observed OSD fluorescence will be only half the maximum possible value. Similarly, when T F is an order of magnitude higher than T T, only about 10 % of the amplicons will originate from T T; hence, the observed OSD fluorescence will be only about 10 % of the maximum possible signal. When T F is two orders of magnitude higher, virtually no signal should remain. These significant changes in observed OSD fluorescence when T F≥T T should allow semi‐quantitative endpoint estimation of nucleic acid analytes.
We first experimentally verified our thresholding model by monitoring how fluorescence was impacted by modulating the ratio of T F/T T. We initially varied the number of T T targets relative to a fixed number of T F targets, although the same results could also be achieved by varying T F in the presence of constant T T, as noted below. The assay for the open reading frame (ORF) 1B gene of the Middle East respiratory syndrome coronavirus (MERS‐CoV)17 was carried out with 60 nm OSD reporters and 10, 104, 105, 106, 107, or 108 copies of the T T MERS1B plasmid, along with 106 T F copies (Figure 2 A; for sequences, see Tables S1 and S2 in the Supporting Information); the LAMP‐OSD assay for the HF183 sequence (unpublished results), derived from the human feces‐specific Bacteroides 16S rRNA gene was carried out with 200 nm OSD reporters and 1, 10, 102, 103, 104, 105, or 106 copies of T T HF183 plasmid thresholded with 105 T F copies (Figure 2 B).
Figure 2.
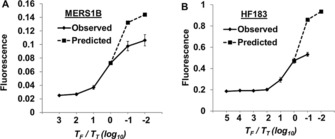
Thresholded LAMP‐OSD assays for A) MERS1B and B) HF183 DNA targets. Solid curves depict observed endpoint raw OSD fluorescence. The predicted curves (dashed) were calculated assuming OSD saturation. Observed OSD fluorescence was adjusted by amplifying 10, 104, 105, 106, 107, or 108 copies of T T MERS1B plasmid or 1, 10, 102, 103, 104, 105, or 106 copies of T T HF183 plasmid in the presence of a constant amount of T F (106 T F MERS1B plasmid or 105 T F HF183 plasmid, respectively).
In both instances, we observed that changing the ratio of T F/T T over four orders of magnitude (from 0.1 to 100) resulted in readily observable signal diminution. For instance, when the amounts of T T and T F were equal, the observed OSD fluorescence was almost half of the near maximum value, as predicted. When T F was in 100‐fold excess, OSD signal was reduced to near background values. The curves for the MERS1B and HF183 amplicons were slightly different, due to the fact that OSD reporters in the HF183 assay were more easily saturated, and T F/T T must therefore be higher to extinguish detectable fluorescence (see Figures S1 and S2, and Text T1 for a mathematical treatment of this issue).
To show generality of the method, we experimentally validated quantitation with two additional DNA targets, one from the v‐raf murine sarcoma viral oncogene homologue B1 (BRAF), and one that amplified a portion of neuropilin 2 (NRP2) (Figure S3). As many diagnostic targets are RNA molecules, we analyzed signal thresholding in a reverse transcription (RT)‐LAMP‐OSD assay for Fusobacterium nucleatum FN1868 mRNA (Figure S4 and Table S1). In all cases, equal numbers of T T and T F targets led to observed fluorescence equal to roughly half of maximum fluorescence, whereas a one order of magnitude increase in T F again resulted in almost complete signal loss. Thus, for five different targets, varying the ratio of T F/T T can predictably lead to discrimination between a readily observed signal and no signal.
To translate thresholded LAMP‐OSD to point‐of‐care use, we first optimized LAMP‐OSD by adjusting OSD, primer, and enzyme amounts to generate high‐amplitude visible fluorescence. We found that this fluorescence could then be simply read by exciting the fluorophore with a single inexpensive light‐emitting diode, filtering the returned light through two layers of inexpensive orange gel filters, and imaging with an unmodified smartphone (Figure S5). The thresholded signal was honed for visual binary yes/no discrimination by varying the number of true targets and then experimentally determining the T F/T T ratio at which observed fluorescence dropped below the sensitivity of human eyes and the smartphone camera. Similar to the results shown in Figure 2 B (where T T rather than T F was varied), a T F/T T ratio of ≥100 was necessary to extinguish the HF183 OSD signal that could be read by the smartphone camera (Figure 3). The ratio required to distinguish between bright and dark was true irrespective of the T T input. For instance, when 105 T F were present, 103 T T could be detected by the loss of fluorescence signal, and when 104 T F were present, samples containing ≤100 HF183 copies would remain dark.
Figure 3.
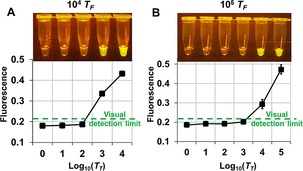
Visual analysis of thresholded HF183 LAMP‐OSD by binary distinction of fluorescence inflection from bright to dark. Endpoint raw fluorescence was imaged by using a smartphone (top panels in A and B) and measured on a LightCycler 96 real‐time PCR machine (bottom panels in A and B). Assays were thresholded with either A) 104 copies or B) 105 copies of T F HF183. Measured fluorescence values above the visual detection limit (green dashed line in bottom panels) appear bright in smartphone images. Fluorescence values below the detection capacity of the smartphone lie beneath the visual detection limit line.
Practical thresholding assays can be run in two modes: T F variation against a fixed T T number, in order to semi‐quantitatively determine the number or concentration of amplicons originally present, and T T variation against a fixed T F number, in order to garner a yes/no answer from a given sample. We demonstrated both approaches.
For the first approach, samples containing some unknown amount of T T can be amplified in the presence of tenfold increments of T F, and the value of T F that eclipses OSD fluorescence can then be divided by the T F/T T value known to result in signal inflection from bright to dark (T F/T T=100 for HF183 assay) to arrive at the actual value of T T. As an example, we spiked 200 μL of aseptic water with 50 μL of primary filtered sewage and then carried out thresholded LAMP‐OSD analysis of HF183 analytes on 3 μL aliquots of unprocessed sample (Figure 4). In the presence of zero to 6×10³ copies of T F HF183, the T T HF183 sequences in the sample yielded a bright OSD signal at the reaction endpoint. In the presence of ≥6×10⁴ T F copies, the assays remained as dark as the negative control without any true HF183 templates. By dividing the lowest number of false targets (6×10⁴) that abolished signal by the ratio T F/T T=100 (the thresholding limit, from Figures 2 and 3), we estimated that 3 μL of the contaminated water contained 600 copies of HF183 DNA. Standard qPCR analysis revealed 570–717 HF183 copies in 3 μL of the same samples. These results not only demonstrated the predictable performance of thresholded LAMP‐OSD in complex biospecimens but also confirm that visual data point analysis can be used to obtain quantitative estimates of target concentrations.
Figure 4.
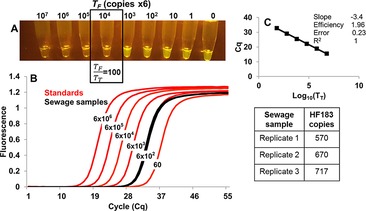
Comparative analysis of sewage‐contaminated water with thresholded LAMP‐OSD and qPCR. A) Smartphone image of thresholded LAMP‐OSD analysis. From left to right, each tube contained 3 μL of sewage‐contaminated water and 6×10⁷, 6×10⁶, 6×10⁵, 6×10⁴, 6×10³, 6×10², 60, 6, or 0 copies of false HF183 plasmids. B) HF183 qPCR analysis of different copies of HF183 plasmids (red traces) and 3 μL of sewage‐contaminated water (black traces). C) HF183 qPCR standard curve and absolute quantity of HF183 sequences in sewage‐contaminated water.
According to federal and state water quality criteria, a water body is considered polluted if the number (or genomic equivalents) of fecal indictor bacteria exceeds a predefined threshold. For instance, the Texas Commission on Environmental Quality limits the fecal indicator bacteria Escherichia coli to 2060 colony forming units (CFU) per 100 mL for safe use of non‐contact recreational water. Our semi‐quantitative POC approach for determining fecal contamination levels is thus an ideal tool for rapid assessment of water quality.
As an example of the second mode of operation (yes/no detection of a given level of analyte), we used thresholded RT‐LAMP‐OSD to quantify F. nucleatum transcript levels directly from cells. The high temperature required for LAMP is known to cause significant damage to bacterial structure,18 thus enabling access to and amplification of the resident nucleic acid targets. The lysine fermentation gene FN1868 was first amplified from 103, 104, and 105 CFU of log‐phase F. nucleatum bacteria and thresholded with tenfold increments of false FN1868 T F to determine where signal extinction occurred (Figure S6). At each CFU level, a T F/T T ratio ≥6 completely suppressed endpoint FN1868 signals (the difference between this value and the 100‐fold excess necessary for the HF183 assays highlights the need to empirically determine how amplicons compete in a given assay). Thus, when 105 CFU (T T) were present, there was almost no signal diminution by 6×10⁴ T F, whereas when there were 103 CFU (T T), the signal was completely extinguished (Figure 5). This ability to readily distinguish a 100‐fold difference in FN1868 RNA levels can potentially be exploited to rapidly diagnose periodontitis, a gum infection in which FN1868 RNA is often upregulated by ≈250‐fold.19 The fact that thresholded RT‐LAMP‐OSD methods can be directly used for quantitation with no sample preparation again highlights potential POC applications.
Figure 5.
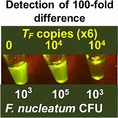
Thresholded RT‐LAMP‐OSD assay to distinguish a 100‐fold difference in F. nucleatum FN1868 RNA. From left to right: 1×10³ CFU of F. nucleatum amplified without thresholding; 1×10⁵ CFU of F. nucleatum amplified in the presence of 6×10⁴ copies of false FN1868 plasmids; and 1×10³ CFU of F. nucleatum analyzed in the presence of 6×10⁴ copies of false plasmid.
Although thresholded LAMP‐OSD does not provide absolute quantitation, for many diagnostic indications that rely on biomarker overexpression it will provide actionable order‐of‐magnitude quantitation. For instance, there is a critical need for point‐of‐care diagnosis of periodontitis during regular dental visits.20 Given that the lysine fermentation pathway mRNA FN1868 is often upregulated by ≈250‐fold in periodontal plaques,19 our thresholded RT‐LAMP‐OSD test is well suited to bridge this gap. Our first‐in‐class assays can also fill voids for point‐of‐need environmental surveillance. For instance, surface water fecal contamination is typically indicated following multi‐day culture of indicator bacteria, such as E. coli,21 or by laboratory‐based quantitative PCR (qPCR) assays.22 This one‐pot thresholded HF183 LAMP‐OSD assay can analyze minimally processed environmental samples at the source to assess fecal contamination within 1 h of sampling.
To our knowledge, this is one of the first examples of LAMP in which semi‐quantitative information can be extrapolated from a single endpoint binary (yes/no) readout. An alternate study using an internal amplification competitor to adjust the endpoint fluorescence of a sequence‐specific LAMP probe23 required the use of sensitive fluorimeters to precisely analyze low signal‐to‐noise ratios (≤1.3) that also proved to be statistically unreliable. Our method also contrasts with standard clinical laboratory assays, such as qPCR,24 that require both extensive training and a sizable footprint for real‐time signal measurement. As the predictable end result is clearly discernable by unaided human eyes and can be imaged with off‐the‐shelf smartphones, we can glean rich, quantitative information directly from environmental and clinical samples at point‐of‐care with minimal infrastructure.
Conflict of interest
The authors declare no conflict of interest.
Supporting information
As a service to our authors and readers, this journal provides supporting information supplied by the authors. Such materials are peer reviewed and may be re‐organized for online delivery, but are not copy‐edited or typeset. Technical support issues arising from supporting information (other than missing files) should be addressed to the authors.
Supplementary
Acknowledgements
This work was supported by the Cancer Prevention and Research Institute of Texas (RP 140108); the National Institutes of Health (R22512 and F31 DE024931); the NIH in conjunction with the Boston University (5U54EB015403‐4500001623); the NIH in conjunction with Johns Hopkins University (131751); the Texas Health Catalyst Program at the Dell Medical School, University of Texas at Austin; and the National Science Foundation (1417162001). The authors thank Dr. Jayanta Bhadra for helpful discussions on the theoretical framework of thresholded LAMP‐OSD.
Y. S. Jiang, A. Stacy, M. Whiteley, A. D. Ellington, S. Bhadra, ChemBioChem 2017, 18, 1692.
References
- 1. Dong L. H., Meng Y., Sui Z. W., Wang J., Wu L. Q., Fu B. Q., Sci. Rep. 2015, 5, 13174. [DOI] [PMC free article] [PubMed] [Google Scholar]
- 2. Nolan T., Hands R. E., Bustin S. A., Nat. Protoc. 2006, 1, 1559–1582. [DOI] [PubMed] [Google Scholar]
- 3.
- 3a. Establishment of PCR Laboratory in Developing Countries, World Health Organization, 2016, http://www.searo.who.int/entity/bloodsafety/pcr_lab_2016.pdf?ua=1;
- 3b. Buchan B. W., Ledeboer N. A., Clin. Microbiol. Rev. 2014, 27, 783–822; [DOI] [PMC free article] [PubMed] [Google Scholar]
- 3c. Dong L., Meng Y., Sui Z., Wang J., Wu L., Fu B., Sci. Rep. 2015, 5, 13174. [DOI] [PMC free article] [PubMed] [Google Scholar]
- 4. Craw P., Balachandran W., Lab Chip 2012, 12, 2469–2486. [DOI] [PubMed] [Google Scholar]
- 5. Linnes J. C., Rodriguez N. M., Liu L., Klapperich C. M., Biomed. Microdevices 2016, 18, 30. [DOI] [PMC free article] [PubMed] [Google Scholar]
- 6.
- 6a. Du Y., Hughes R. A., Bhadra S., Jiang Y. S., Ellington A. D., Li B., Sci. Rep. 2015, 5, 11039; [DOI] [PMC free article] [PubMed] [Google Scholar]
- 6b. Xiang Y., Lu Y., Nat. Chem. 2011, 3, 697–703. [DOI] [PMC free article] [PubMed] [Google Scholar]
- 7. Du Y., Pothukuchy A., Gollihar J. D., Nourani A., Li B., Ellington A. D., Angew. Chem. Int. Ed. 2017, 56, 992–996; [DOI] [PMC free article] [PubMed] [Google Scholar]; Angew. Chem. 2017, 129, 1012–1016. [Google Scholar]
- 8. Damhorst G. L., Duarte-Guevara C., Chen W., Ghonge T., Cunningham B. T., Bashir R., Engineering 2015, 1, 324–335. [DOI] [PMC free article] [PubMed] [Google Scholar]
- 9.
- 9a. Cai Z., Lou G., Cai T., Yang J., Wu N., J. Clin. Virol. 2011, 52, 288–294; [DOI] [PubMed] [Google Scholar]
- 9b. Mori Y., Kitao M., Tomita N., Notomi T., J. Biochem. Biophys. Methods 2004, 59, 145–157; [DOI] [PubMed] [Google Scholar]
- 9c. Chen S. Y., Ge B. L., BMC Microbiol. 2010, 10, 41; [DOI] [PMC free article] [PubMed] [Google Scholar]
- 9d. Toriniwa H., Komiya T., Microbiol. Immunol. 2006, 50, 379–387; [DOI] [PubMed] [Google Scholar]
- 9e. Cai T., Lou G. Q., Yang J., Xu D., Meng Z. H., J. Clin. Virol. 2008, 41, 270–276. [DOI] [PubMed] [Google Scholar]
- 10.
- 10a. Kuboki N., Sakurai T., Di Cello F., Grab D. J., Suzuki H., Sugimoto C., Igarashi I., J. Clin. Microbiol. 2003, 41, 5517–5524; [DOI] [PMC free article] [PubMed] [Google Scholar]
- 10b. Kimura Y., de Hoon M. J., Aoki S., Ishizu Y., Kawai Y., Kogo Y., Daub C. O., Lezhava A., Arner E., Hayashizaki Y., Nucleic Acids Res. 2011, 39, e59. [DOI] [PMC free article] [PubMed] [Google Scholar]
- 11. Safavieh M., Ahmed M. U., Ng A., Zourob M., Biosens. Bioelectron. 2014, 58, 101–106. [DOI] [PubMed] [Google Scholar]
- 12. Jiang Y. S., Bhadra S., Li B., Wu Y. R., Milligan J. N., Ellington A. D., Anal. Chem. 2015, 87, 3314–3320. [DOI] [PubMed] [Google Scholar]
- 13. Zhang D. Y., Seelig G., Nat. Chem. 2011, 3, 103–113. [DOI] [PubMed] [Google Scholar]
- 14.
- 14a. Zhang D. Y., Turberfield A. J., Yurke B., Winfree E., Science 2007, 318, 1121–1125; [DOI] [PubMed] [Google Scholar]
- 14b. Seelig G., Soloveichik D., Zhang D. Y., Winfree E., Science 2006, 314, 1585–1588; [DOI] [PubMed] [Google Scholar]
- 14c. Yin P., Choi H. M., Calvert C. R., Pierce N. A., Nature 2008, 451, 318–322; [DOI] [PubMed] [Google Scholar]
- 14d. Chakraborty K., Veetil A. T., Jaffrey S. R., Krishnan Y., Annu. Rev. Biochem. 2016, 85, 349–373. [DOI] [PMC free article] [PubMed] [Google Scholar]
- 15.
- 15a. Qian L., Winfree E., Science 2011, 332, 1196–1201; [DOI] [PubMed] [Google Scholar]
- 15b. Qian L., Winfree E., DNA Computing 2009, 5347, 70–89. [Google Scholar]
- 16. Qian L., Winfree E., Bruck J., Nature 2011, 475, 368–372. [DOI] [PubMed] [Google Scholar]
- 17. Bhadra S., Jiang Y. S., Kumar M. R., Johnson R. F., Hensley L. E., Ellington A. D., PLoS One 2015, 10, e0123126. [DOI] [PMC free article] [PubMed] [Google Scholar]
- 18. Mackey B. M., Miles C. A., Parsons S. E., Seymour D. A., J. Gen. Microbiol. 1991, 137, 2361–2374. [DOI] [PubMed] [Google Scholar]
- 19.
- 19a. Jorth P., Turner K. H., Gumus P., Nizam N., Buduneli N., Whiteley M., MBio 2014, 5, e01012-14; [DOI] [PMC free article] [PubMed] [Google Scholar]
- 19b. Kreimeyer A., Perret A., Lechaplais C., Vallenet D., Medigue C., Salanoubat M., Weissenbach J., J. Biol. Chem. 2007, 282, 7191–7197. [DOI] [PubMed] [Google Scholar]
- 20.
- 20a. Kim J. J., Kim C. J., Camargo P. M., J. Calif. Dent. Assoc. 2013, 41, 119–124; [PMC free article] [PubMed] [Google Scholar]
- 20b. Eke P. I., Dye B. A., Wei L., Slade G. D., Thornton-Evans G. O., Borgnakke W. S., Taylor G. W., Page R. C., Beck J. D., Genco R. J., J. Periodontol. 2015, 86, 611–622. [DOI] [PMC free article] [PubMed] [Google Scholar]
- 21. Scott T. M., Rose J. B., Jenkins T. M., Farrah S. R., Lukasik J., Appl. Environ. Microbiol. 2002, 68, 5796–5803. [DOI] [PMC free article] [PubMed] [Google Scholar]
- 22. Green H. C., Haugland R. A., Varma M., Millen H. T., Borchardt M. A., Field K. G., Walters W. A., Knight R., Sivaganesan M., Kelty C. A., Shanks O. C., Appl. Environ. Microbiol. 2014, 80, 3086–3094. [DOI] [PMC free article] [PubMed] [Google Scholar]
- 23. Tani H., Teramura T., Adachi K., Tsuneda S., Kurata S., Nakamura K., Kanagawa T., Noda N., Anal. Chem. 2007, 79, 5608–5613. [DOI] [PubMed] [Google Scholar]
- 24. Niemz A., Ferguson T. M., Boyle D. S., Trends Biotechnol. 2011, 29, 240–250. [DOI] [PMC free article] [PubMed] [Google Scholar]
Associated Data
This section collects any data citations, data availability statements, or supplementary materials included in this article.
Supplementary Materials
As a service to our authors and readers, this journal provides supporting information supplied by the authors. Such materials are peer reviewed and may be re‐organized for online delivery, but are not copy‐edited or typeset. Technical support issues arising from supporting information (other than missing files) should be addressed to the authors.
Supplementary