

Abstract
Objectives
The selection and dose of antibiotic therapy for biofilm-related infections are based on traditional pharmacokinetic studies using planktonic bacteria. The objective of this study was to characterize the time course and spatial activity of human exposure levels of meropenem and tobramycin against Pseudomonas aeruginosa biofilms grown in an in vitro flow-chamber model.
Methods
Pharmacokinetic profiles of meropenem and tobramycin used in human therapy were administered to GFP-labelled P. aeruginosa PAO1 grown in flow chambers for 24 or 72 h. Images were acquired using confocal laser scanning microscopy throughout antibiotic treatment. Bacterial biomass was measured using COMSTAT and pharmacokinetic/pharmacodynamic models were fitted using NONMEM7.
Results
Meropenem treatment resulted in more rapid and sustained killing of both the 24 and 72 h PAO1 biofilm compared with tobramycin. Biofilm regrowth after antibiotic treatment occurred fastest with tobramycin. Meropenem preferentially killed subpopulations within the mushroom cap of the biofilms, regardless of biofilm maturity. The spatial killing by tobramycin varied with biofilm maturity. A tobramycin-treated 24 h biofilm resulted in live and dead cells detaching from the biofilm, while treatment of a 72 h biofilm preferentially killed subpopulations on the periphery of the mushroom stalk. Regrowth occurred primarily on the mushroom caps. Combination meropenem and tobramycin therapy resulted in rapid and efficient killing of biofilm cells, with a spatial pattern similar to meropenem alone.
Conclusions
Simulated human concentrations of meropenem and tobramycin in young and mature PAO1 biofilms exhibited differences in temporal and spatial patterns of killing and antibiotic tolerance development.
Introduction
Biofilms are structured communities of bacteria enclosed in an extracellular matrix composed of polysaccharides, proteins and extracellular DNA adherent to a surface.1 Compared with planktonic bacteria, cells in biofilms are more heterogeneous and exhibit differences in metabolism, antibiotic susceptibility and ability to evade the immune system. In humans, biofilms are typically associated with chronic infections but up to 80% of acute infections may also involve biofilm formation.2,3 Patients with cystic fibrosis (CF) are uniquely predisposed to biofilm-associated chronic Pseudomonas aeruginosa lung infections, which, once established in the CF lung, are nearly impossible to eradicate with antimicrobial therapy alone.
Pharmacokinetic (PK) and pharmacodynamic (PD) studies are integral for choosing the optimal antimicrobial dose and dosing schedule for maximizing bacterial killing while minimizing development of antimicrobial resistance and adverse drug events. In vitro PD models are used to quantify the effect of single or combination drugs on bacteria. While static in vitro models use fixed antibiotic concentrations on a set inoculum of bacteria, dynamic in vitro PD models have the advantage of mimicking human PK, allowing the characterization of the time course of antibiotic activity. At present, antibiotic susceptibility testing and PD studies utilizing planktonic culture are considered the norm to guide antibiotic selection and dosing yet are known to be poor predictors of treatment outcomes for biofilm infections.4
Various in vitro model systems have been used to evaluate the activity of antibiotics on biofilms.5–8 Most in vitro studies use statically grown biofilms or dynamic models of constant drug concentrations, which may not be physiologically or clinically relevant. The time course and spatial killing of bacteria in biofilms utilizing antibiotic concentrations used to treat human infections are unstudied.
To assess the effect of in vivo antimicrobial drug concentrations on killing and regrowth of bacteria in biofilms, we conducted a combined spatiotemporal study by first simulating human antibiotic concentrations and then quantifying the bacterial biomass over the time course of antibiotic exposure while visualizing the location and extent of killing and regrowth within the biofilm. Intermittent (e.g. bolus) administration of meropenem and tobramycin and combination therapy of meropenem and tobramycin were chosen to correspond to clinical dosing regimens used to treat CF pulmonary infections. We describe the effects of these antibiotic regimens on early and mature P. aeruginosa biofilms.
Materials and methods
Bacterial strain
GFP-tagged P. aeruginosa PAO1 was used.5 The MICs of meropenem and tobramycin were determined by broth macrodilution and interpreted in accordance with CLSI guidelines.9 The minimum biofilm inhibitory concentrations (MBICs) were determined using a previously established biofilm susceptibility assay.10
Antibiotics and medium
Meropenem for intravenous injection (lot KA662; expiration date, March 2015; AstraZeneca) and tobramycin for intravenous injection (lot 6005971; expiration date, January 2015; Fresenius Kabi USA, LLC) were obtained from the pharmacy of the University of California San Francisco Medical Center. M9 minimal medium (Amresco, Solon, OH, USA) supplemented with 1 mM MgSO4, 0.1 mM CaCl2, 0.01 mM FeCl3 and 0.3 mM glucose was used in the flow-chamber experiments.5
Antibiotic concentrations
The free-drug concentrations resulting from intermittent (e.g. bolus) administration of meropenem and tobramycin and combination therapy using continuous-infusion meropenem with bolus administration of tobramycin were chosen to correspond to typical human dosage regimens. Concentration–time profiles were based on previously described PK parameters of meropenem and tobramycin from healthy volunteers and patients with CF.11,12 The target meropenem peak concentration (Cp) was computed to be 107.53 mg/L with t½ = 0.893 h. The target tobramycin peak concentration, based on a dose of 10 mg/kg in a 70 kg adult, was 32.79 mg/L with t½ = 2.75 h.
In vitro PD biofilm model
The one-compartment dynamic biofilm PD model system has been previously described.13 In brief, PAO1 biofilms were cultured in flow chambers and subsequently treated with one or three doses of meropenem or tobramycin (Table 1). Biofilms were cultured for 24 or 72 h to investigate the effect of maturity on antimicrobial PD. Each flow chamber was inoculated with 250 μL of an overnight culture of PAO1 (OD600 = 0.05) and left without flow for 1 h, at which time flow was started (20 mL/h) with minimal media via a peristaltic pump (Watson Marlow 205S). Antibiotics were administered after culture for 24 or 72 h. To simulate the human PK of a single dose of meropenem or tobramycin, the medium flask was replaced with an antibiotic flask containing the Cp of meropenem or tobramycin. Medium was pumped from a dilution flask to the antibiotic flask and, subsequently, to the flow chambers at a rate calculated to simulate the antibiotic elimination rate constant. To simulate multiple bolus doses of meropenem or tobramycin, the antibiotic bottle was replaced with a fresh bottle of antibiotic at the start of each dosing interval. For the combination study of meropenem plus tobramycin, the dilution flask was replaced with a bottle of meropenem at a concentration of 20 mg/L. Two control channels and three treatment channels were used for each experiment. Each experiment was conducted in duplicate.
Table 1.
Antibiotic regimens simulated in flow chambers
| Antibiotic(s) | Antibiotic regimen | Maturity of PAO1 biofilm (h) |
|---|---|---|
| Meropenem | 2 g intravenous bolus × 1 dose | 24 |
| 2 g intravenous bolus × 3 doses | 72 | |
| Tobramycin | 700 mg intravenous bolus × 1 dose | 24 |
| 700 mg intravenous boluses × 3 doses | 72 | |
| Meropenem plus tobramycin | meropenem 6 g continuous infusion over 24 h | 72 |
| tobramycin 700 mg intravenous bolus × 1 dose | 72 |
The PK of each antibiotic regimen was simulated in the flow chambers on PAO1 biofilms cultured for 24 or 72 h.
Antibiotic concentration determinations
Drug samples were taken via a Luer lock distal to each channel and immediately stored at −80 °C until analysis. Meropenem samples were taken at times 0, 0.5, 1, 2, 4, 6 and 8 h. Tobramycin samples were taken at times 0, 0.5, 1, 2, 4, 6, 8 and 24 h. Meropenem was quantified by LC–MS/MS as previously described.14 Tobramycin was quantified by LC–MS/MS with a calibration range of 50–25 000 ng/mL. Quality control samples for meropenem exhibited relative standard deviations (RSDs) ranging from 1.8% to 6.1% and intra-assay mean accuracies ranging from 94.3% to 107% at 150 ng/mL (n = 10), 1500 ng/mL (n = 10), 8000 ng/mL (n = 10) and 100 000 ng/mL (n = 16). Quality control samples for tobramycin exhibited RSDs ranging from 2.4% to 5.2% and intra-assay mean accuracies ranging from 96.8% to 109% at 150 ng/mL (n = 5), 1500 ng/mL (n = 9), 20 000 ng/mL (n = 9) and 40 000 ng/mL (n = 9).
Microscopy and image acquisition
Microscopic observations of bacterial biofilms in the flow chambers were acquired using a Leica TCS SP2 confocal laser scanning microscope (CLSM) equipped with an argon/krypton laser and detectors/filter sets for simultaneous monitoring of GFP (excitation 488 nm, emission 517 nm) representing live cells and propidium iodide (excitation 543 nm, emission 565 nm), which only stains dead cells. Images were obtained using a 40×/1.3 Plan-Neofluar oil objective. Each flow-chamber channel was randomly imaged at two locations per timepoint, resulting in six images of the drug channels and four images of the control channels per timepoint. Image locations were randomly selected to provide a broad overview of the effect of antibiotic exposure on overall biomass. Multichannel simulated fluorescence projections and sections through the biofilms were generated using Imaris (Bitplane AG, Switzerland). CLSM images were analysed using COMSTAT.15
PK/PD modelling
The mathematical models used to characterize the action of antibiotics on bacterial growth take into account the drug PK, the intrinsic bacterial growth rate and the action of drug on the growth rate (PD).
For the PK, we used a linear interpolant of the observed drug concentrations to obtain a continuous function of time (t) that obtains drug concentration, C(t), at an arbitrary time t. The linear interpolant was used to simplify the incorporation of the PK data corresponding to the different modes of administration.
For the bacterial intrinsic growth rate (in absence of drug) we used a Gompertz model.16 The rate of change for (live) biofilm (B) is given by:
where B0 is the initial condition (inoculation), kbis the growth rate of the biofilm and Bmax is the maximum biomass. The growth rate is at its maximum at inoculation when the actual birth rate is at kb log(Bmax/B0), and approaches zero, i.e. kb log(Bmax/Bmax), when B(t) approaches the maximum growth level. To describe the action of drug on bacterial growth we used standard PD models.17 In presence of two drugs, C1(t), meropenem, C2(t), tobramycin, the general model for action of drug is:
The function g(C1,C2,B) represents the action of drug on bacterial growth rate. We also used two alternative models for g(C1,C2,B). In the first we assumed a linear killing action of drug on biofilm:
where k1 and k2 are the kill rates for meropenem and tobramycin, respectively. The second adds an interaction term, and takes the form:
where k12 is the killing rate for the drug interaction. Alternative models for bacterial growth or drug action did not show statistically significant improvements of the model.
PK/PD simulations
Simulations of PD response were based on final parameter estimates for the selected models. Drug elimination rates used in the simulation were 0.767 and 0.252 h−1 for meropenem and tobramycin, respectively. When simulating a bolus dose followed by mono-exponential disposition, the dose was adjusted to achieve an initial concentration of 107.53 mg/L for meropenem and 32.79 mg/L for tobramycin. For the simulated interaction experiment we used the same dosage for tobramycin; for meropenem, we used a constant infusion of 107 × 0.252 L−1 h−1 lasting 24 h.
Statistical analysis
The parameters B0, Bmax, kb, k1 and k2, and k12 were estimated from the data using the non-linear minimization program NONMEM7,18 using the first-order conditional expectation method (FOCE). The compiler used was the public domain GFORTRAN.19 NONMEM7 minimizes as objective function (OBJ) minus twice the logarithm of the linearized maximum likelihood. To simplify the analysis, we quantify two sources of variability: (i) in the model parameters, due to growth/killing variation across channels (inter-channel variability), assuming that the parameters are log-normally distributed; and (ii) in the observations, due to measurement error (residual variability), assuming normally distributed constant (homoscedastic) error. To determine the statistical significance between competing models, different statistical selection criteria were used that required a minimal decrease of 2–10 points in the OBJ to accept a model with one additional parameter.20–22 To compare between models, we used standard regression diagnostic plots.
Results
Static antibiotic susceptibility testing
The MIC of both meropenem and tobramycin was found to be 2 mg/L. The MBIC of both meropenem and tobramycin was found to be 16-fold higher than the MIC (32 mg/L).
Temporal effect of meropenem and tobramycin on P. aeruginosa biofilms
Table 1 shows the antibiotic regimens administered in the flow chambers. Single doses of meropenem or tobramycin were administered to 24 h-cultured P. aeruginosa PAO1 biofilms. Multi-dose and combination drug regimens were administered to 72 h-cultured P. aeruginosa PAO1 biofilms. Parameter estimates representing the temporal killing effects of the antibiotic regimens are shown in Table 2. Bmax, in the absence of drug, was 39.3 μm3/μm2 with a kb of 0.0425 h−1. Using a 24 h P. aeruginosa PAO1 biofilm, a single dose of meropenem exhibited more rapid killing (k1 = 0.0296 h−1 L mg−1) compared with a single dose of tobramycin (k2 = 0.0530 h−1 L mg−1). The kill rates for meropenem and tobramycin were approximately 10-fold slower when applied to a 72 h biofilm compared with the kill rates using a 24 h biofilm (k1 = 0.0310 h−1 L mg−1; k2 = 0.0478 h−1 L mg−1). Interaction was tested using a continuous infusion of meropenem with a single bolus of tobramycin. Significant interaction was observed between the two drugs [combined kill rate (k12) of 0.0004931 h−1 L2 mg−2. The diagnostic plots for the fits of the model are shown in Figures S1–S3 (available as Supplementary data at JAC Online).
Table 2.
Biofilm growth and kills rates associated with meropenem and tobramycin
| Parameter | Parameter estimate | Inter-channel variability (%) |
|---|---|---|
| Bmax (μm3/μm2) | 39.3 (1.34) | 17.8 |
| kb (h−1) | 0.0425 (0.0406) | 6.79 |
| 24 h biofilm | ||
| k1 (h−1 cu−1) | 0.0296 (0.0008) | 2.1 |
| k2 (h−1 cu−1) | 0.0530 (0.007) | 3.1 |
| 72 h biofilm | ||
| k1 (h−1 cu−1) | 0.00310 (0.000134) | 17.2 |
| k2 (h−1 cu−1) | 0.00478 (0.000159) | 25.0 |
| 72 h biofilm with drug interaction | ||
| k1 (h−1 cu−1) | 0.00297 (0.000142) | 15.1 |
| k2 (h−1 cu−1) | 0.00338 (0.000161) | 21.0 |
| k12 (h−1 cu−2) | 0.000493 (0.000081) | 4.5 |
| σ (μm3/μm2) | 6.02 | – |
Bmax, maximum biomass in absence of drugs; kb, biofilm growth rate in absence of drug; σ, residual variability (measurement error); cu, concentration units (mg/L).
Inter-channel variability is an estimate of the parameter variability across different channels. Standard errors for the estimated parameters are noted in parentheses.
Simulated plots for each experiment are shown in Figure 1. Table 3 lists the time and antibiotic concentration associated with biofilm regrowth during each dosing interval. Both meropenem and tobramycin exhibited rapid killing and regrowth with a 24 h biofilm. However, with a 72 h biofilm treated with multiple doses of meropenem, regrowth occurred earlier and at progressively higher drug concentrations with each repeated dose, indicating rapid development of antibiotic tolerance.23 By the third dose, regrowth occurred at almost 8 × MIC. Repeated doses of tobramycin on a 72 h biofilm resulted in constant times to regrowth, occurring between 25% and 27% of the dosing interval, and minimal increases in concentrations (e.g. 2.8–3.6 × MIC). Repeated exposure of meropenem led to an overall decrease in biomass. With repeated doses of tobramycin, bacterial biomass returned to near pretreatment levels with little decrease in overall biomass, indicative of rapid tolerance development. The combination treatment of tobramycin and meropenem resulted in the most rapid killing (k12 = 0.000493 h−1 L2 mg−2) or 10-fold faster than either meropenem or tobramycin alone (Table 2 and Figure 1).
Figure 1.

PD simulations of effects of meropenem and tobramycin on P. aeruginosa PAO1 biofilms grown in flow chambers. 24 h biofilms were treated with either a single dose of meropenem or tobramycin at t = 24 h. 72 h biofilms were treated with either three doses of meropenem (at t = 72, 80 and 88 h) or tobramycin (at t = 72, 96 and 120 h) or a combination of meropenem and tobramycin (at t = 72 h) MEM, meropenem; TOB, tobramycin.
Table 3.
Time to regrowth, antibiotic concentration and live biomass of 24 and 72 h PAO1 biofilms during treatment with meropenem and tobramycin based on the parameter estimates reported in Table 2
| 24 h PAO1 |
72 h PAO1 |
|||||||
|---|---|---|---|---|---|---|---|---|
| time to regrowth |
antibiotic concentration (mg/L) | biomass (μg3/μm2) | time to regrowth |
antibiotic concentration (mg/L) | biomass (μg3/μm2) | |||
| h | % dosing interval | h | % dosing interval | |||||
| Meropenem | ||||||||
| dose 1 | 3.5 | 43.8 | 7.30 | 0.15 | 3.5 | 43.8 | 7.30 | 20.8 |
| dose 2 | – | – | – | 3.0 | 37.5 | 10.7 | 16.9 | |
| dose 3 | – | – | – | 2.5 | 31.25 | 15.8 | 14.6 | |
| Tobramycin | ||||||||
| dose 1 | 7.5 | 31.25 | 4.9 | 0.057 | 6.5 | 27.0 | 5.61 | 20.3 |
| dose 2 | – | – | – | 6.5 | 27.0 | 6.39 | 19.3 | |
| dose 3 | – | – | – | 6 | 25.0 | 7.2 | 19.0 | |
| Meropenem plus tobramycin | – | – | – | 12 | 50 | meropenem 17.0; tobramycin 1.59 | 7.99 | |
Time to regrowth represents the duration of time for biofilm cells to restart growing during antibiotic treatment. The concentration at regrowth represents the meropenem or tobramycin concentration in the flow chambers when regrowth occurs.
Spatial effect of meropenem and tobramycin on P. aeruginosa biofilms
The spatial effect of each antibiotic regimen was evaluated using CLSM images acquired at multiple timepoints throughout each dosing interval. Figure 2 shows the formation of PAO1 biofilm in the absence of antibiotic treatment. Figure 3 shows the effect of a single bolus dose of meropenem (top panels) or tobramycin (bottom panels) on a 24 h PAO1 biofilm. With one dose of meropenem, bacterial killing was rapid, occurring within the first hour of antibiotic exposure. By 8 h (e.g. the end of a typical 8 h dosing interval), biofilm killing was near complete, with a layer of dead cells remaining attached to the substratum surface. Tobramycin exposure resulted in slower killing and a distinct spatial pattern of killing compared with meropenem. While meropenem-killed cells remained attached to the substratum, treatment with tobramycin led to detachment of most cells (live and dead). Few live cells remained attached at 16 and 24 h, with no dead cells remaining.
Figure 2.

PAO1 biofilm formation in flow chambers in the absence of antibiotic exposure (control). CLSM images were acquired at t = 24, 48, 72, 80, 88, 96, 120 and 144 h. All x/y plots are presented as simulated fluorescence projections. Shown to the right of and below the x/y plots are vertical sections through the biofilm.
Figure 3.
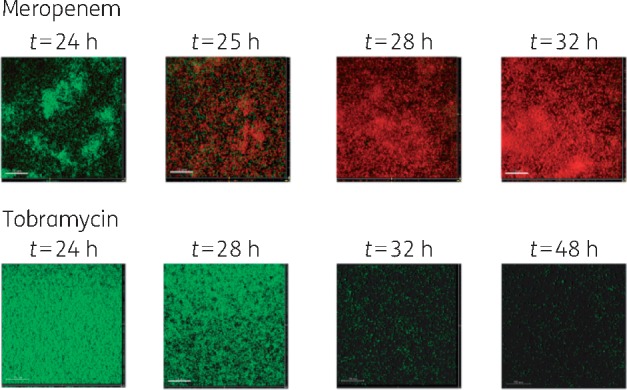
Effect of a single dose of meropenem (top panels) or tobramycin (bottom panels) on a 24 h PAO1 biofilm. For meropenem, CLSM images were acquired prior to antibiotic exposure (t = 24 h) and 1, 4 and 8 h later. For tobramycin, CLSM images were acquired prior to antibiotic exposure (t = 24 h) and 4, 6 and 24 h later. Green cells correspond to live cells and red cells correspond to dead cells after staining with propidium iodide. All x/y plots are presented as simulated fluorescence projections. Shown to the right of and below the x/y plots are vertical sections through the biofilm.
Figure 4 (part I) shows the spatial killing due to three boluses of meropenem on a 72 h biofilm. Panel (a) shows the effects of the first dose of meropenem. Biofilm cell kill was rapid, taking place within the first hour (t = 73 h), and initiating from the top cell layer of microcolonies closest to the biofilm surface and the tops of the mushroom caps. At t = 76 h (4 h into treatment), killing was observed deeper within the mushroom cap, with cells within the mushroom stem remaining viable. With repeated meropenem doses (panels b and c), cells deeper within the biofilm were killed incrementally, reaching the substratum cell layer by the end of the second dose. However, subpopulations in the biofilm remained viable throughout all three doses, as shown in the cut-out sections in panel (c).
Figure 4.

72 h P. aeruginosa PAO1 treated with: (I) three bolus doses of meropenem (2 g) administered every 8 h; (II) three bolus doses of tobramycin (700 mg) administered every 24 h; and (III) meropenem continuous infusion (20 mg/L) with one bolus dose of tobramycin (700 mg). Green cells correspond to live cells and red cells correspond to dead cells. All x/y plots are presented as simulated fluorescence projections. Shown to the right of and below the x/y plots are vertical sections through the biofilm.
Figure 4 (part II) shows the spatial killing due to three boluses of tobramycin. Like meropenem, early killing with the first dose appeared to preferentially target the populations at the outer surface of the biofilm and the mushroom caps (panel a). However, with the second and third tobramycin doses (panels b and c), subpopulations on the sides of the mushroom stalk were preferentially killed, leaving the mushroom caps and biofilm surfaces unaffected. The centres of the mushroom caps appeared to collapse inward, forming empty, crater-like areas, which may be indicative of cell dispersal.24 Robust cell proliferation continued at the tops of the mushroom caps, even with repeated tobramycin doses, accounting for the rebound increase in biomass seen in the temporal modelling. Unlike the tobramycin-treated 24 h biofilm, dead cells remained adherent to the substratum with minimal detachment observed.
The effect of combination meropenem and tobramycin therapy is shown in Figure 4 (part III). The spatial pattern of killing appeared to be a combination of the effect of meropenem and tobramycin alone. The predominant mode of killing was ‘top-down’; however, by t = 76 h the formation of hollow spaces in the biofilm appeared similar to that seen with tobramycin monotherapy. By t = 88 h, killing was near complete throughout the biofilm with minimal regrowth.
Discussion
In this study, a simultaneous spatial and temporal approach to PD modelling was performed on P. aeruginosa PAO1 biofilms after treatment with clinical human exposures of meropenem and tobramycin.13P. aeruginosa biofilms were difficult to eradicate with the most clinically utilized doses of meropenem and tobramycin used in CF patients. The effectiveness of antimicrobial killing was dependent upon the amount of biomass present and biofilm maturation. We observed differences in the spatiotemporal organization of cell death and antibiotic tolerance development within the biofilm that suggest a potential mechanism for the known synergistic effects of β-lactam antibiotics in combination with aminoglycosides on P. aeruginosa.25–28
Temporally, the rate and extent of biofilm killing and recovery varied between antibiotic classes and maturity of the biofilm. Rapid antibiotic tolerance was observed with both antibiotics, exemplified by the ability of biofilm cells to grow in increasingly higher meropenem and tobramycin concentrations. Tobramycin was less effective at eradicating biofilms compared with meropenem, and the ability of the 72 h tobramycin-treated biofilms to rapidly return to pretreatment biomass by the start of each subsequent antibiotic dose was especially concerning.
Spatially, meropenem and tobramycin displayed different patterns of antimicrobial killing and regrowth, which likely contributed to the differences in the timing of antibiotic tolerance development. The pattern of killing with meropenem treatment was similar for early and mature biofilms, taking a top-down approach targeting subpopulations at the periphery of the mushroom first. Subsequent doses allowed killing deeper into the biofilm cap and stem. Both killed and live cells remained adherent to the substratum. In contrast, the spatial selectivity of tobramycin differed by maturity of the biofilm. This phenomenon warrants future investigation and suggests the presence of distinct heterogeneous subpopulations within a mature biofilm that can be distinguished based on their susceptibility to pulse-administered antibiotics.
The observed spatiotemporal selectivity of meropenem and tobramycin is complex and reflects the unique features associated with the physiology of biofilm cells and the pharmacological properties of the antibiotic. During biofilm formation, bacterial cells diversify into physiologically and metabolically distinct populations (dependent on nutrient availability and other environmental cues) with varying degrees of antibiotic tolerance.5,29–31P. aeruginosa forms heterogeneous ‘mushroom-like’ structures when grown in glucose-containing minimal media in flow chambers. After initial surface attachment, the mushroom ‘stalks’ are composed of non-motile bacteria, while the mushroom ‘cap’ is predominantly composed of motile bacteria requiring type IV pili and flagella.29,30 Antibiotic treatment can eradicate susceptible populations within the biofilm, leaving antibiotic-tolerant populations viable and able to proliferate at higher antibiotic concentrations. The regrowth of tobramycin-tolerant cells at the tops of the mushroom caps is of particular interest. In colistin-treated P. aeruginosa, tolerant cells were seen to migrate to the tops of the microcolonies and proliferate at the top of dead cells.32 A similar phenomenon may be occurring with tobramycin even though tobramycin exhibits a different mechanism of action and targets different subpopulations of cells within the biofilm compared with colistin.
The distinct effects of the two antibiotic classes could be related to biofilm cell detachment and dispersal, a coordinated process that is thought to occur in response to environmental cues or self-produced signals.33,34 During cell dispersion, motile bacteria are released from the inner portion of the biofilms, leaving behind shell-like, hollow structures with walls consisting of non-motile bacteria, such as those we observed.33 Detached and dispersed cells are physiologically distinct from both planktonic cells and cells in other stages of biofilm development.33,35 Cells within the interior of the biofilm, potentially protected from the effects of tobramycin by peripheral cells, may have adapted to a more antibiotic-tolerant state prior to dispersal.
The detachment and dispersion of the biofilm may have important implications in clinical treatment. Multiple studies have shown that monotherapy with an aminoglycoside for Gram-negative bacteraemia was associated with higher microbiological failure and increased mortality compared with treatment with an appropriate β-lactam.36–42 We hypothesize that the increased mortality associated with aminoglycoside monotherapy could be due to the induced detachment of live biofilm cells, which can then spread to other sites within the body.
β-Lactam antibiotics inhibit bacterial cell wall synthesis, while aminoglycosides bind to the 30S ribosomal subunit, interfering with protein synthesis. Both antibiotic classes require metabolically active cells to exert their antimicrobial effect. Microcolonies at the surface of the mushroom cap are more metabolically active, making this area of the biofilm more hospitable to active growth and susceptible to antibiotic treatment.43,44 We expected the majority of killing to occur at the tops of the mushroom caps for both meropenem and tobramycin. While this was the predominant pattern of killing for meropenem, this was not the case with tobramycin. Tobramycin targeted the periphery of the mushroom stem, with biofilm regrowth and thus antibiotic tolerance development mainly occurring at the top of the mushroom caps. Additionally, antibiotics exhibit selective penetration through the biofilm due to differences in diffusivity and reactivity of the agent in the biofilm, and dose and duration of exposure.45–48 β-Lactams freely penetrate biofilms, while aminoglycosides display lower overall penetration and rate of penetration due to interactions of the positively charged tobramycin with the negatively charged exopolysaccharide alginate.47–50 These factors could account for the slower kill rate and shorter duration of killing with tobramycin, particularly in the mature biofilms.
With our biofilm model, it is possible to investigate the spatiotemporal effects of antibiotic exposure that more closely recapitulate clinical regimens used to treat human P. aeruginosa infections. These studies reveal temporally and spatially distinct subpopulations of bacterial cells within the biofilm in response to clinically important antibiotic dosing regimens. Ongoing studies using time-lapse imaging and evaluation of additional biofilm parameters (e.g. biofilm thickness) are needed to further assess the effects of antibiotics on heterogeneous structures within the biofilm and distinguish the mechanisms of antibiotic response and tolerance development. These studies may lead to improved antibiotic therapy directed towards biofilm infections such as CF.
Funding
This work was supported by the National Institute of Allergy and Infectious Diseases of the National Institutes of Health (4R01AI738-05).
Transparency declarations
D. V. and K. Y. have received funding from Merck. All other authors: none to declare.
Supplementary data
Figures S1, S2 and S3 are available as Supplementary data at JAC Online.
Supplementary Material
References
- 1. Parsek MR, Tolker-Nielsen T.. Pattern formation in Pseudomonas aeruginosa biofilms. Curr Opin Microbiol 2008; 11: 560–6. [DOI] [PubMed] [Google Scholar]
- 2. Davies D. Understanding biofilm resistance to antibacterial agents. Nat Rev Drug Discov 2003; 2: 114–22. [DOI] [PubMed] [Google Scholar]
- 3. Hoiby N, Bjarnsholt T, Moser C. et al. ESCMID guideline for the diagnosis and treatment of biofilm infections 2014. Clin Microbiol Infect 2015; 21Suppl 1: S1–25. [DOI] [PubMed] [Google Scholar]
- 4. Smith AL, Fiel SB, Mayer-Hamblett N. et al. Susceptibility testing of Pseudomonas aeruginosa isolates and clinical response to parenteral antibiotic administration: lack of association in cystic fibrosis. Chest 2003; 123: 1495–502. [DOI] [PubMed] [Google Scholar]
- 5. Haagensen JAJ, Klausen M, Ernst RK. et al. Differentiation and distribution of colistin- and sodium dodecyl sulfate-tolerant cells in Pseudomonas aeruginosa biofilms. J Bacteriol 2006; 189: 28–37. [DOI] [PMC free article] [PubMed] [Google Scholar]
- 6. Merritt JH, Kadouri DE, O'Toole GA.. Growing and analyzing static biofilms. Curr Protoc Microbiol 2005; Chapter 1: Unit 1B. [DOI] [PMC free article] [PubMed] [Google Scholar]
- 7. Ceri H, Olson ME, Stremick C. et al. The Calgary Biofilm Device: new technology for rapid determination of antibiotic susceptibilities of bacterial biofilms. J Clin Microbiol 1999; 37: 1771–6. [DOI] [PMC free article] [PubMed] [Google Scholar]
- 8. Pamp SJ, Sternberg C, Tolker-Nielsen T.. Insight into the microbial multicellular lifestyle via flow-cell technology and confocal microscopy. Cytometry A 2009; 75: 90–103. [DOI] [PubMed] [Google Scholar]
- 9. Clinical and Laboratory Standards Institute. Performance Standards for Antimicrobial Susceptibility Testing: Twenty-Third Informational Supplement M100-S23. CLSI, Wayne, PA, USA, 2013. [Google Scholar]
- 10. Moskowitz SM, Foster JM, Emerson J. et al. Clinically feasible biofilm susceptibility assay for isolates of Pseudomonas aeruginosa from patients with cystic fibrosis. J Clin Microbiol 2004; 42: 1915–22. [DOI] [PMC free article] [PubMed] [Google Scholar]
- 11. Kuti JL, Dandekar PK, Nightingale CH. et al. Use of Monte Carlo simulation to design an optimized pharmacodynamic dosing strategy for meropenem. J Clin Pharmacol 2003; 43: 1116–23. [DOI] [PubMed] [Google Scholar]
- 12. Touw DJ, Knox AJ, Smyth A.. Population pharmacokinetics of tobramycin administered thrice daily and once daily in children and adults with cystic fibrosis. J Cyst Fibros 2007; 6: 327–33. [DOI] [PubMed] [Google Scholar]
- 13. Haagensen JA, Verotta D, Huang L. et al. New in vitro model to study the effect of human simulated antibiotic concentrations on bacterial biofilms. Antimicrob Agents Chemother 2015; 59: 4074–81. [DOI] [PMC free article] [PubMed] [Google Scholar]
- 14. Huang L, Haagensen J, Verotta D. et al. Determination of meropenem in bacterial media by LC-MS/MS. J Chromatogr B Analyt Technol Biomed Life Sci 2014; 961: 71–6. [DOI] [PMC free article] [PubMed] [Google Scholar]
- 15. Heydorn A, Nielsen AT, Hentzer M. et al. Quantification of biofilm structures by the novel computer program COMSTAT. Microbiology 2000; 146: 2395–407. [DOI] [PubMed] [Google Scholar]
- 16. Gompertz B. On the nature of the function expressive of the law of human mortality, and on a new mode of determining the value of life contingencies. Philos Trans R Soc 1825; 115: 513–85. [DOI] [PMC free article] [PubMed] [Google Scholar]
- 17. Csajka C, Verotta D.. Pharmacokinetic-pharmacodynamic modelling: history and perspectives. J Pharmacokinet Pharmacodyn 2006; 33: 227–79. [DOI] [PubMed] [Google Scholar]
- 18. Beal S, Sheiner LB, Boeckmann A, Bauer RJ. NONMEM User Guides. Icon Development Solutions, Ellicott City, MD, USA. 2011. [Google Scholar]
- 19. The GNU Fortran Project 2016 https://gcc.gnu.org/fortran/.
- 20. Akaike H. A new look at the statistical model identification. IEEE Trans Automat Contr 1974; 19: 716–23. [Google Scholar]
- 21. Hannan EJ. Rational transfer function approximation. Statist Sci 1987; 2: 135–51. [Google Scholar]
- 22. Schwarz G. Estimating the dimension of a model. Ann Statist 1978; 6: 461–4. [Google Scholar]
- 23. Brauner A, Fridman O, Gefen O. et al. Distinguishing between resistance, tolerance and persistence to antibiotic treatment. Nat Rev Microbiol 2016; 14: 320–30. [DOI] [PubMed] [Google Scholar]
- 24. Purevdorj-Gage B, Costerton WJ, Stoodley P.. Phenotypic differentiation and seeding dispersal in non-mucoid and mucoid Pseudomonas aeruginosa biofilms. Microbiology 2005; 151: 1569–76. [DOI] [PubMed] [Google Scholar]
- 25. Chan EL, Zabransky RJ.. Determination of synergy by two methods with eight antimicrobial combinations against tobramycin-susceptible and tobramycin-resistant strains of Pseudomonas. Diagn Microbiol Infect Dis 1987; 6: 157–64. [DOI] [PubMed] [Google Scholar]
- 26. Comber KR, Basker MJ, Osborne CD. et al. Synergy between ticarcillin and tobramycin against Pseudomonas aeruginosa and Enterobacteriaceae in vitro and in vivo. Antimicrob Agents Chemother 1977; 11: 956–64. [DOI] [PMC free article] [PubMed] [Google Scholar]
- 27. Fass RJ. Comparative in vitro activities of β-lactam-tobramycin combinations against Pseudomonas aeruginosa and multidrug-resistant gram-negative enteric bacilli. Antimicrob Agents Chemother 1982; 21: 1003–6. [DOI] [PMC free article] [PubMed] [Google Scholar]
- 28. Lyon MD, Smith KR, Saag MS. et al. In vitro activity of piperacillin, ticarcillin, and mezlocillin alone and in combination with aminoglycosides against Pseudomonas aeruginosa. Antimicrob Agents Chemother 1986; 30: 25–30. [DOI] [PMC free article] [PubMed] [Google Scholar]
- 29. Klausen M, Aaes-Jorgensen A, Molin S. et al. Involvement of bacterial migration in the development of complex multicellular structures in Pseudomonas aeruginosa biofilms. Mol Microbiol 2003; 50: 61–8. [DOI] [PubMed] [Google Scholar]
- 30. Klausen M, Heydorn A, Ragas P. et al. Biofilm formation by Pseudomonas aeruginosa wild type, flagella and type IV pili mutants. Mol Microbiol 2003; 48: 1511–24. [DOI] [PubMed] [Google Scholar]
- 31. Shrout JD, Chopp DL, Just CL. et al. The impact of quorum sensing and swarming motility on Pseudomonas aeruginosa biofilm formation is nutritionally conditional. Mol Microbiol 2006; 62: 1264–77. [DOI] [PubMed] [Google Scholar]
- 32. Chua SL, Yam JK, Hao P. et al. Selective labelling and eradication of antibiotic-tolerant bacterial populations in Pseudomonas aeruginosa biofilms. Nat Commun 2016; 7: 10750. [DOI] [PMC free article] [PubMed] [Google Scholar]
- 33. Sauer K, Camper AK, Ehrlich GD. et al. Pseudomonas aeruginosa displays multiple phenotypes during development as a biofilm. J Bacteriol 2002; 184: 1140–54. [DOI] [PMC free article] [PubMed] [Google Scholar]
- 34. Webb JS, Thompson LS, James S. et al. Cell death in Pseudomonas aeruginosa biofilm development. J Bacteriol 2003; 185: 4585–92. [DOI] [PMC free article] [PubMed] [Google Scholar]
- 35. Rollet C, Gal L, Guzzo J.. Biofilm-detached cells, a transition from a sessile to a planktonic phenotype: a comparative study of adhesion and physiological characteristics in Pseudomonas aeruginosa. FEMS Microbiol Lett 2009; 290: 135–42. [DOI] [PubMed] [Google Scholar]
- 36. Vidal L, Gafter-Gvili A, Borok S. et al. Efficacy and safety of aminoglycoside monotherapy: systematic review and meta-analysis of randomized controlled trials. J Antimicrob Chemother 2007; 60: 247–57. [DOI] [PubMed] [Google Scholar]
- 37. Hilf M, Yu VL, Sharp J. et al. Antibiotic therapy for Pseudomonas aeruginosa bacteremia: outcome correlations in a prospective study of 200 patients. Am J Med 1989; 87: 540–6. [DOI] [PubMed] [Google Scholar]
- 38. Korvick JA, Bryan CS, Farber B. et al. Prospective observational study of Klebsiella bacteremia in 230 patients: outcome for antibiotic combinations versus monotherapy. Antimicrob Agents Chemother 1992; 36: 2639–44. [DOI] [PMC free article] [PubMed] [Google Scholar]
- 39. Leibovici L, Paul M, Poznanski O. et al. Monotherapy versus β-lactam-aminoglycoside combination treatment for gram-negative bacteremia: a prospective, observational study. Antimicrob Agents Chemother 1997; 41: 1127–33. [DOI] [PMC free article] [PubMed] [Google Scholar]
- 40. Crabtree TD, Pelletier SJ, Gleason TG. et al. Analysis of aminoglycosides in the treatment of gram-negative infections in surgical patients. Arch Surg 1999; 134: 1293–8; discussion 1298–9. [DOI] [PubMed] [Google Scholar]
- 41. Bailey JA, Virgo KS, DiPiro JT. et al. Aminoglycosides for intra-abdominal infection: equal to the challenge? Surg Infect (Larchmt) 2002; 3: 315–35. [DOI] [PubMed] [Google Scholar]
- 42. Paul M, Benuri-Silbiger I, Soares-Weiser K. et al. β Lactam monotherapy versus β lactam-aminoglycoside combination therapy for sepsis in immunocompetent patients: systematic review and meta-analysis of randomised trials. BMJ 2004; 328: 668.. [DOI] [PMC free article] [PubMed] [Google Scholar]
- 43. Walters MC 3rd, Roe F, Bugnicourt A. et al. Contributions of antibiotic penetration, oxygen limitation, and low metabolic activity to tolerance of Pseudomonas aeruginosa biofilms to ciprofloxacin and tobramycin. Antimicrob Agents Chemother 2003; 47: 317–23. [DOI] [PMC free article] [PubMed] [Google Scholar]
- 44. Williamson KS, Richards LA, Perez-Osorio AC. et al. Heterogeneity in Pseudomonas aeruginosa biofilms includes expression of ribosome hibernation factors in the antibiotic-tolerant subpopulation and hypoxia-induced stress response in the metabolically active population. J Bacteriol 2012; 194: 2062–73. [DOI] [PMC free article] [PubMed] [Google Scholar]
- 45. Stewart PS. Theoretical aspects of antibiotic diffusion into microbial biofilms. Antimicrob Agents Chemother 1996; 40: 2517–22. [DOI] [PMC free article] [PubMed] [Google Scholar]
- 46. Stewart PS, Hamilton MA, Goldstein BR. et al. Modeling biocide action against biofilms. Biotechnol Bioeng 1996; 49: 445–55. [DOI] [PubMed] [Google Scholar]
- 47. Kumon H, Tomochika K, Matunaga T. et al. A sandwich cup method for the penetration assay of antimicrobial agents through Pseudomonas exopolysaccharides. Microbiol Immunol 1994; 38: 615–9. [DOI] [PubMed] [Google Scholar]
- 48. Shigeta M, Tanaka G, Komatsuzawa H. et al. Permeation of antimicrobial agents through Pseudomonas aeruginosa biofilms: a simple method. Chemotherapy 1997; 43: 340–5. [DOI] [PubMed] [Google Scholar]
- 49. Nichols WW, Dorrington SM, Slack MP. et al. Inhibition of tobramycin diffusion by binding to alginate. Antimicrob Agents Chemother 1988; 32: 518–23. [DOI] [PMC free article] [PubMed] [Google Scholar]
- 50. Tseng BS, Zhang W, Harrison JJ. et al. The extracellular matrix protects Pseudomonas aeruginosa biofilms by limiting the penetration of tobramycin. Environ Microbiol 2013; 15: 2865–78. [DOI] [PMC free article] [PubMed] [Google Scholar]
Associated Data
This section collects any data citations, data availability statements, or supplementary materials included in this article.