Summary
Unusually among ATP-Binding Cassette (ABC) proteins, the sulphonylurea receptor (SUR) acts as a channel regulator. ATP-sensitive potassium (KATP) channels are octameric complexes made up from 4 pore-forming Kir6.2 subunits and 4 regulatory SUR subunits. Two different genes encode SUR1 (ABCC8) and SUR2 (ABCC9), with the latter being differentially spliced to give SUR2A and SUR2B which differ only in their C-terminal 42 amino acids. KATP channels containing these different SUR2 isoforms are differentially modulated by MgATP, with Kir6.2/SUR2B being activated more than Kir6.2/SUR2A. We show here that purified SUR2B has a lower ATPase activity and 10-fold lower Km for MgATP than SUR2A. Similarly, the isolated nucleotide-binding domain 2 (NBD2) of SUR2B was less active than that of SUR2A. We further found that the NBDs of SUR2B (but not SUR2A) interact and that the activity of full-length SUR cannot be predicted from that of either the isolated NBDs or NBD mixtures. Notably, deletion of the last 42 amino acids from SUR2-NBD2 resulted in ATPase activity resembling SUR2-NBD2A rather than SUR2-NBD2B: this might indicate that these amino acids are responsible for the lower ATPase activity of SUR2B and isolated SUR2-NBD2B. We suggest that the lower ATPase activity of SUR2B may result in an enhanced duration of the MgADP-bound state that leads to channel activation.
Keywords: sulphonylurea receptor, SUR2A, SUR2B, KATP channel, ABC transporter
Introduction
ATP-sensitive potassium (KATP) channels link the metabolic state of the cell to its electrical excitability [1]. They are involved in the response to cardiac stress, ischemic preconditioning, vascular smooth muscle tone, skeletal muscle glucose uptake, neuronal excitability and transmitter release, and insulin secretion from pancreatic beta-cells [2].
The pore of the KATP channel consists of four Kir6.2 subunits, each of which is associated with a regulatory sulphonylurea receptor (SUR) subunit. The latter comes in several flavours, being SUR1 in beta-cells and neurones, SUR2A in cardiac and skeletal muscle, and SUR2B in smooth muscle and some neurones [1]. SUR2A and SUR2B are splice variants of a single gene and differ only in their final exon, which alters the C-terminal 42 amino acids.
ATP blocks KATP channel activity by binding to Kir6.2, whereas the SUR subunit endows the channel with sensitivity to inhibition by sulphonylurea drugs and to the stimulatory actions of MgADP and the KATP channel openers [1,3]. SUR has multiple transmembrane domains (TMDs) and two intracellular nucleotide-binding domains (NBDs). It is thought that like other ABC proteins [4], the NBDs of SUR associate in a head-to-tail conformation to form two dimeric nucleotide-binding sites (Site 1 and Site 2) that comprise the Walker A and Walker B motifs of one NBD and the linker domain of the other.
In the absence of Mg2+, there is little difference in ATP block of Kir6.2/SUR2A and Kir6.2/SUR2B channels [5], indicating SUR2A and SUR2B do not differentially influence ATP binding to Kir6.2. In the presence of Mg2+, however, ATP inhibits Kir6.2/SUR2B less than Kir6.2/SUR2A. This suggests MgATP has a greater stimulatory action on Kir6.2/SUR2B than Kir6.2/SUR2A, leading to an apparent reduction in ATP inhibition. In support of this idea, when an ATP-insensitive Kir6.2 mutation was used to remove the effects of ATP on Kir6.2, MgATP activated KATP channels containing SUR2B subunits but blocked those comprised of SUR2A [6].
The current consensus is that channel opening is enhanced by MgADP occupation of Site 2 and that activation by MgATP requires its hydrolysis to MgADP. At least in the case of SUR2, the prehydrolytic state does not promote channel opening [7]. Because MgADP activates Kir6.2/SUR2B and Kir6.2/SUR2A to similar extents [5] it appears that they bind MgADP with similar affinity and transduce this binding into channel opening with similar efficacy. This has led to the proposal that ability of MgATP to stimulate the activity of Kir6.2/SUR2B channels more than Kir6.2.SUR2A channels is due to greater ATP hydrolysis by SUR2B than SUR2A [6]. In this paper we test this hypothesis explicitly, by measuring the ATPase activity of full-length SUR2A and SUR2B, and that of their isolated NBDs.
Results
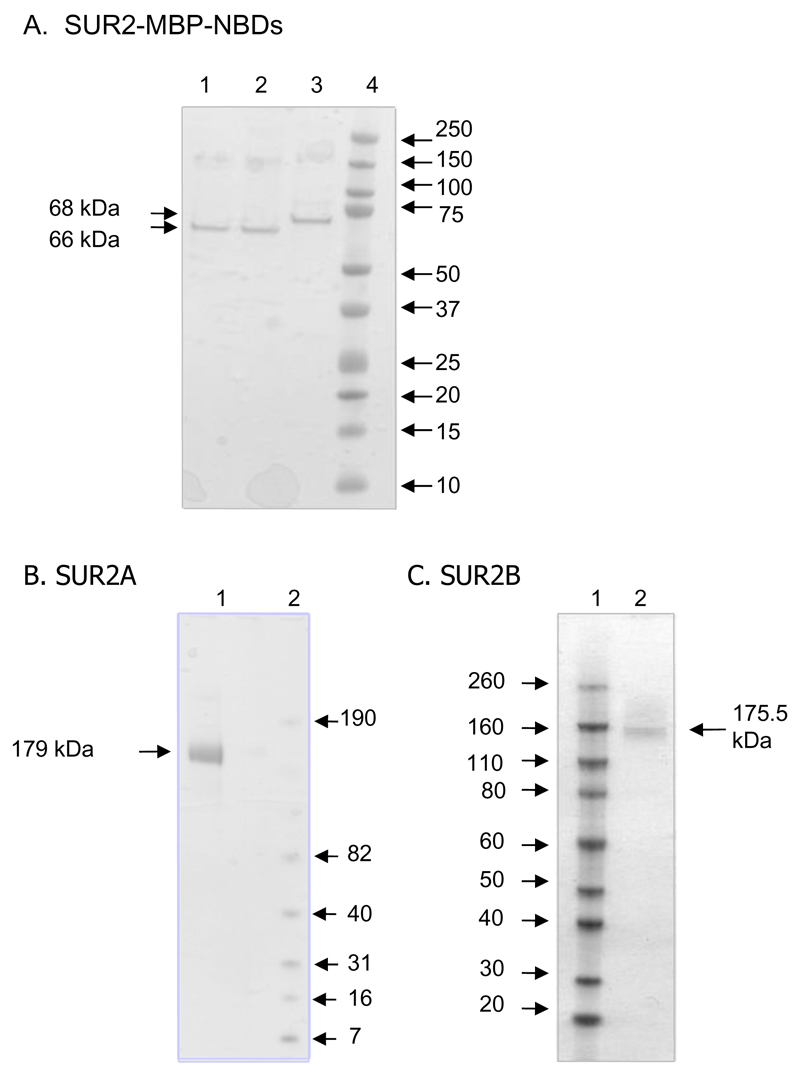
Fig 1 shows SDS-PAGE analysis of purified MBP-SUR2-NBD fusion proteins (Fig 1A) and full length SUR2A and SUR2B (Fig1B and 1C). MALDI-TOF analysis confirmed their identities. For simplicity, we refer to MBP fusion proteins subsequently as NBD1, NBD2A (SUR2A-NBD2) and NBD2B (SUR2B-NBD2).
Figure 1. Protein purification.
Coomassie-stained denaturing gels of purified MBP-NBDs (A) and full-length SUR2A (B), SUR2B (C). Numbers adjacent to the gel indicate the molecular weights (mw, kDa). (A) Lanes: 1=NBD2A; 2=NBD2B; 3=NBD1; 4, mw markers. (B) Lanes: 1=SUR2A; 2, mw markers. (C) Lanes: 1, mw markers; Lane 2=SUR2B. Samples are purified eluates from affinity resins without further purification (A) or eluates from the gel filtration column (B, C).
ATP hydrolysis by NBDs
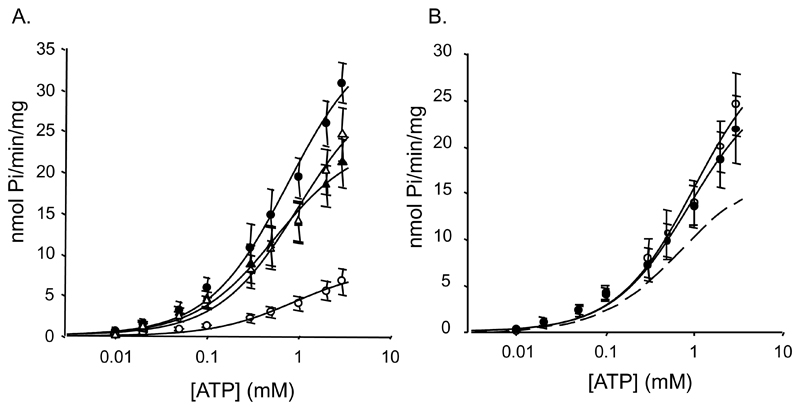
NBD1 and NBD2A displayed higher ATPase activity than NBD2B (Fig 2A, Table 1), with NBD1 having the highest rate. Km values were similar for NBD1 (647μM), NBD2B (792μM) and NBD2A (529 μM). The different activities of NBD2A and NBD2B could result from an inhibitory effect of the C-terminal 42 amino acids of NBD2B or a stimulatory effect of equivalent residues of NBD2A. To determine which of these hypotheses is correct, we generated a truncated NBD2 construct, NBD2-ΔC, which lacked the last 42 amino acids. Fig 2A and Table 1 show that the ATPase activity of NBD2-ΔC was greater than that of SUR2B but similar to that of NBD2A, favouring the idea that the last 42 residues of NBD2B reduce its catalytic activity. The Km value was the lowest of all the isolated NBDs (336 μM).
Figure 2. ATPase activity of NBDs.
A, ATPase activity of NBD1 (●, n=5), NBD2A (▲, n=7), NBD2B (○, n=7) or NBD2-ΔC (Δ, n=3). The lines are fit to the Michaelis-Menten equation with estimated Vmax of 37, 26, 8 and 31 nmol Pi/min/mg and Km of 769, 556, 882 μM and 340, respectively. B, ATPase activity of a mixture of NBD1 and either NBD2A (○, n=4) or NBD2B (●, n=4). The solid lines are fit to the Michaelis-Menten equation with estimated Km of 995 and 878μM and Vmax of 31 and 27nmol Pi/min/mg protein, respectively. Dashed line, average of the ATPase activity of NBD1 and NBD2B.
Table 1. ATPase activities and kinetic constants.
WT, wild-type. n, number of preparations. *, p<0.01 against NBD1+NBD2B. **, p<0.005 against NBD1.
| Construct | Turnover Rate (s-1 x 10⁻³) |
Vmax (nmol Pi/min/mg) |
Km (μM) | n |
|---|---|---|---|---|
| NBD1 | 33.8 ± 2.4 | 30.8 ± 2.2 | 647 ± 110 | 5 |
| NBD2A | 19.3 ± 3.0 | 21.2 ± 2.8 | 529± 170 | 7 |
| NBD2B | 6.1 ± 1.5** | 6.7 ± 1.6 | 792 ± 151 | 7 |
| NBD2-ΔC | 24.5 ± 4.1 | 29.5 ± 4.4 | 336 ± 30 | 3 |
| NBD1+NBD2A | 27.0 ± 3.3 | 27.1 ± 3.3 | 941 ± 174 | 4 |
| NBD1+NBD2B | 25.2 ± 3.2 | 24.6 ± 3.0 | 880 ± 308 | 4 |
| Average NBD1,NBD2B | 14.0 ± 4.4* | 15.3 ± 4.8** | 528 ± 180 | 4 |
| SUR2A | 6.1 ± 2.3 | 2.6 ± 0.8 | 373 ± 93 | 4 |
| SUR2B | 2.3 ± 0.3 | 0.8 ± 0.1 | 38 ± 11 | 3 |
We next examined ATP hydrolysis in a 1:1 mixture of NBD1 and either NBD2A or NBD2B (Fig 2B). The estimated maximal turnover rate was similar in both cases. For the NBD1+NBD2A mixture, kcat was intermediate between that of the individual NBDs and the Km was not significantly different from either NBD alone (Fig 2B, Table 1). This differs from previous observations on SUR2A [8], but is in agreement with studies of SUR1 [9] and MRP1 [10] where mixing the NBDs did not have a major impact on their catalytic activity.
In contrast, the maximal turnover rate of the NBD1+NBD2B mixture was very different from the average of the activities of NBD1 and NBD2B (Fig 2B, Table 1), suggesting these NBDs interact. However, the Km remained unchanged, at around 1mM ATP.
ATP hydrolysis by SUR2A and SUR2B
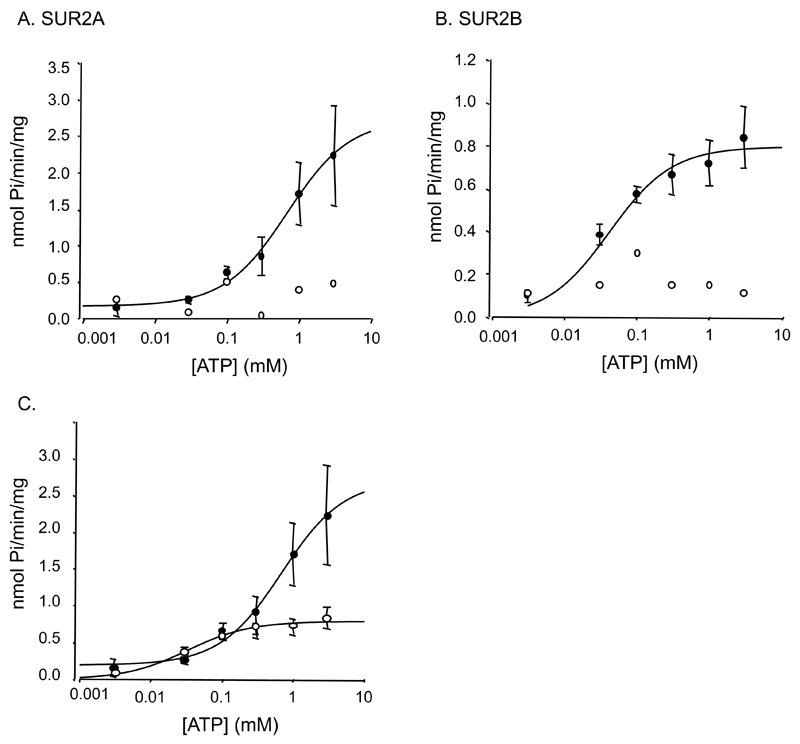
We next examined the ATPase activity of the full-length proteins. Recombinant SUR2A and SUR2B hydrolyzed MgATP slowly, with maximal turnover rates of 6.1x10⁻³ s-1 and 2.3x10⁻³ s-1, and Km of 373μM and 38μM, respectively (Fig 3, Table 1). No ATPase activity was detected in the absence of Mg2+ (Fig 3A). SUR2A and SUR2B were approximately 4-fold and 10-fold, respectively, less active than previously reported for SUR1 (kcat 26.3x10⁻³ s-1, [9]), and also less active than a mixture of the respective NBDs. However, they were only 3-fold less active than their respective NBD2. The difference in ATPase activity between full-length SUR2A and SUR2B and their isolated NBDs is not a consequence of the small amount of detergent (0.2% dodecylmaltoside) and lipid (0.05% 1,2-dimyristoyl-sn-glycero-phosphocholine) associated with the full-length proteins, as this was without effect on the activity of either isolated SUR2A or SUR2A-ΔC (data not shown).
Figure 3. ATPase activity of SUR2.
A, ATPase activity in the presence (●, n=4) or absence (○, n=1) of Mg2+ for purified SUR2A. B, ATPase activity of purified SUR2B with (●, n=3) or without (○, n=1) Mg2+. C. ATPase activity of SUR2A and SUR2B plotted on the same scale. The lines are fit to the Michaelis-Menton equation using Km=460μM, Vmax=2.52nmol Pi/min/mg and an offset of 0.1nmol Pi/min/mg for SUR2A, and Km=41μM, and Vmax=0.73nmol Pi/min/mg and an offset of 0.05 for SUR2B.
SUR2B showed a ten-fold lower Km than SUR2A, suggesting binds ATP more tightly than SUR2A. The Km of all four isolated NBDs was significantly larger than that of SUR2B.
Inhibition of ATP hydrolysis by MgADP and Beryllium Fluoride
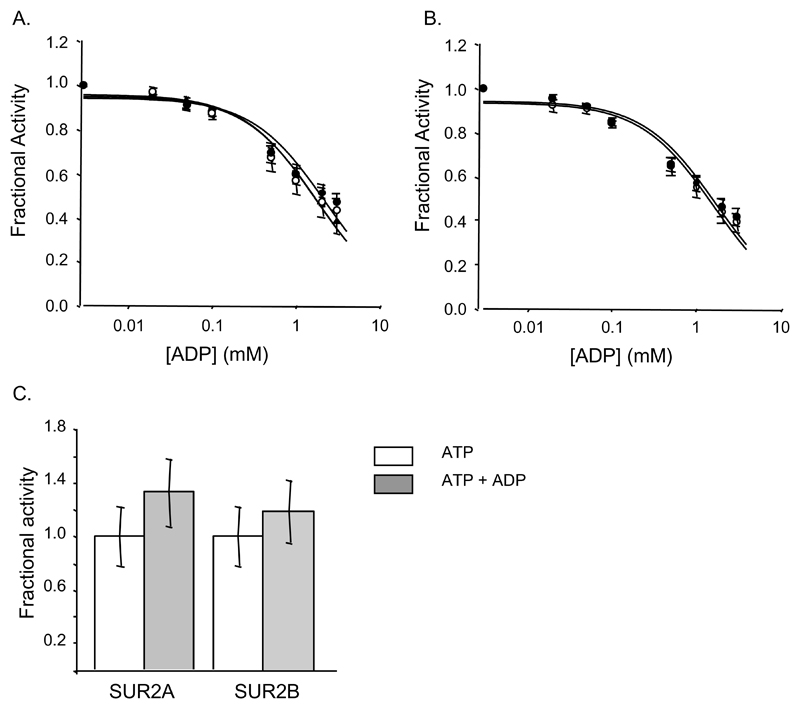
MgADP inhibited ATP hydrolysis by NBD1, NBD2A and NBD2B with Ki of 305-443μM (Fig 4A, Table 2). Inhibition was unchanged by mixing NBD1 and NBD2 (Fig 4B, Table 2). In contrast to the isolated NBDs, the ATPase activities of full-length SUR2A and SUR2B were unaffected by 3 mM MgADP (Figure 4C).
Figure 4. Inhibition by MgADP.
A,B Inhibition of ATPase activity at 1mM MgATP by ADP for (A) NBD1 (▲, n=4), NBD2A (○, n=3) and NBD2B (●, n=3); (B) a mixture of NBD1 and either NBD2A (○, n=3) or NBD2B (●, n=3). C, ATPase activity of SUR2A and SUR2B at 1mM MgATP with (white bars) or without (grey bars) 3mM MgADP (n=3). Data are expressed as a fraction of the turnover rate in the absence of inhibitor. (A,B) The lines are fit to eqn 1 and Ki values calculated using eqn 2.
Table 2. Inhibition by ADP and Beryllium fluoride.
WT, wild-type. n, number of preparations
| Construct | ADP (μM) | n | Beryllium fluoride (μM) | n |
|---|---|---|---|---|
| NBD1 | 443 ± 107 | 3 | 26.0 ± 4.6 | 4 |
| NBD2A | 368 ± 109 | 3 | 25.8 ± 3.3 | 4 |
| NBD2B | 305 ± 52 | 3 | 28.3 ± 5.7 | 4 |
| NBD1+NBD2A | 370 ± 138 | 3 | 23.9 ± 1.4 | 4 |
| NBD1+NBD2B | 352 ± 106 | 3 | 22.7 ± 2.3 | 4 |
| SUR2A | No inhibition | 3 | nd | |
| SUR2B | No inhibition | 3 | nd |
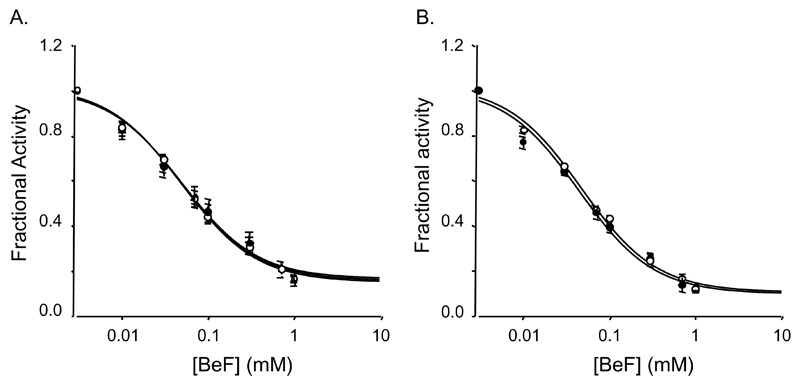
Beryllium fluoride a potent inhibitor of ATP hydrolysis by many ABC proteins that acts by arresting the ATPase cycle in the prehydrolytic conformation, inhibited the ATPase activity of NBD1, NBD2A and NBD2B with Ki of ~25μM (Fig 5A, Table 2). Mixing NBD1 with either NBD2A or NBD2B did not alter the Ki (Fig 5B, Table 2).
Figure 5. Inhibition by Beryllium Fluoride.
A, Inhibition of ATPase activity at 1mM MgATP by Beryllium Fluoride for NBD1 (▲, n=4), NBD2A (○, n=3) and NBD2B (●, n=3). B, Inhibition of ATPase activity at 1mM MgATP by Beryllium Fluoride for a mixture of NBD1 and either NBD2A (○, n=3) or NBD2B (●, n=3). Data are expressed as a fraction of the turnover rate in the absence of inhibitor. Lines are fit to eqn 1 and Ki values calculated using eqn 2.
Discussion
ATP hydrolysis by the NBDs
Previous studies of ATP hydrolysis by the NBDs of SUR2A have yielded Km of 220μM for NBD1 [11] and ranged from 370μM [11] to 4.4mM [12] for NBD2A. The values we obtained for the isolated NBDs lie within this range (0.8mM for NBD1, 0.529 mM for NBD2A).
The rate of ATP hydrolysis of NBD1 was greater than that reported before, the Vmax being 31nmol Pi/min/mg protein compared to earlier values of 6-9nmol Pi/min/mg protein [8,11,12]. These differences may be due to the residues used for the various constructs: G635-G889 in this study compared to S684-S884 [11,12] and D666-E890 [8] in previous work. Alternatively, it might result from the different techniques which were used to estimate protein concentration, or differences in the assay conditions. Likewise, the hydrolytic activity of our NBD2A (Vmax 21nmol Pi/min/mg protein) was also greater than previously reported (10nmol Pi/min/mg protein [Beinengraber, Nature Gen].
Mixing NBD1 and NBD2 of SUR2A did not alter ATPase activity, as found for SUR1 [9] and MRP1 [10], but in contrast to a previous study of the NBDs of SUR2A [8]. This may also reflect construct differences: our NBD1 is 31 amino acids longer at the N terminus, and our NBD2 is 26 amino acids shorter at the N terminus, than those of Parks et al (2008) [8].
To our knowledge, this is the first time the activity of NBD2B or full-length SUR2B have been reported. Consistent with the fact that full-length SUR2B has a lower turnover rate than SUR2A, NBD2B displayed the slowest hydrolytic rate of the isolated NBDs (kcat 6 s-1 x10⁻³, >3-fold lower than either NBD1, NBD2A or NBD2-ΔC).
The ATPase activity of NBD2-ΔC, which lacks the C-terminal 42 residues (i.e. K1333-V1502) was 30nmol Pi/min/mg protein, within the range (11 [11], 18 [12] or 78 [13] nmol Pi/min/mg protein) of that previously reported for a similar construct (G1306-T1498). Importantly, the kcat was greater than that of NBD2B but similar to that of NBD2A. This suggests that the final 42 residues of SUR2B may reduce its hydrolytic activity and that the catalytic activity of SUR2A is not measurably affected by its final 42 amino acids.
Unlike SUR2A, mixing NBD1 and NBD2 of SUR2B enhanced ATPase activity (above the average of the individual NBDs), indicating the NBDs must interact and emphasizing the functional importance of the last 42 amino acids of SUR2. One possibility is that interaction of the heterodimer produces a conformational change that physically ablates the inhibitory effect of the last 42 amino acids of SUR2B on ATPase activity. Presumably this conformational change is prevented by the presence of the transmembrane domains, as the activity of full-length SUR2B is 4-fold less than that of SUR2A. There is an increasing body of evidence that suggests that isolated NBDs, which are presumably free from the conformational constraints imposed by their TMDs, behave very differently from their full-length cousins and our data supports this idea further [14,15].
ATP hydrolysis by full-length SUR2A and SUR2B
The ATPase activities of purified SUR2A (Vmax 3nmol Pi/min/mg protein) and SUR2B (0.8nmol Pi/min/mg protein) are significantly less than that of SUR1 (9nmol Pi/min/mg protein) [9]. They are also less than that of CFTR (60nmol Pi/min/mg protein, [16] and MRP1 (from 5-470nmol Pi/min/mg [17,18], two other members of the ABCC subfamily. However, the ATPase activity is not dissimilar from that found for ABCR (1.3nmol Pi/min/mg protein; [19]. The lower ATPase activity of the various SUR may be related to their role as channel regulators, rather than transporters. It is also possible that ATP hydrolysis is enhanced when SUR2A and SUR2B are coexpressed with Kir6.2, as found for SUR1 [9,20].
Like SUR1 [9], the Km for ATP hydrolysis by SUR2A and SUR2B were lower than those measured for the isolated NBDs. This suggests the transmembrane domains induce conformational changes in the NBDs, or in their association, that influence nucleotide handling.
The Km for MgATP was substantially lower for SUR2B (38μM) than that of SUR2A (400μM) or SUR1 (100μM, [9]), suggesting SUR2B binds MgATP more tightly. This is harmonious with a previous report that the Ki for ATP inhibition of 8-azido-[α32P]ATP binding to NBD1 and NBD2 of native SUR2B were less than those for the NBDs of SUR2A [21]. SUR2A and SUR2B differ only in their last 42 amino acids, which do not form part of the catalytic site. Thus these residues may interact with the NBDs to modulate binding affinity. This interaction appears to require the transmembrane domains of SUR2 as the Km of NBD2 and the NBD1-NBD2B mixture are much greater than that of full-length SUR2B.
Effects of Inhibitors
MgADP inhibited ATP hydrolysis by the isolated NBDs, albeit with low affinity (Ki of 0.3 to 0.4mM), as reported for NBD2 of SUR2A [13]. In contrast, MgADP did not block ATP hydrolysis by full-length SUR2A or SUR2B: similar results were found for SUR1 [9]. A possible explanation is that the ADP affinity of the full-length proteins is much lower than that of the isolated NBDs. However, the lack of MgADP inhibition must somehow be ameliorated in the KATP channel complex, because MgADP is able to stimulate channel activity and reverse channel inhibition by ATP via interaction with the NBDs of SUR2 [12]. Furthermore, MgADP is able to displace azido-[α32P]ATP binding to NBD1 and NBD2 of full-length SUR2B and SUR2B [21]: the Ki for MgADP they measured for NBD2B (70 μM) was lower than that we found for the isolated NBD mixture (350 μM), but that for NBD2A was not significantly different.
Implications for channel gating
Unlike other ABC proteins, SUR2 serves as a channel regulator, and ATP hydrolysis by SUR2 plays a key role in the metabolic regulation of the KATP channel. Current evidence suggests the presence of MgADP at NBD2 results in KATP channel opening, and that MgATP must be hydrolysed to MgADP in order for channel activation to occur [7]. Consistent with the fact that the Ki for MgADP inhibition of ATPase activity is similar for NBD2A and NBD2B, Kir6.2/SUR2A and Kir6.2/SUR2B are activated by MgADP to about the same extent [5].
The IC50 for MgATP inhibition of Kir6.2/SUR2A currents is less than for Kir6.2/SUR2B [22]. In contrast, ATP blocks via both channels to a similar extent in the absence of Mg2+. This suggests that MgATP activation of Kir6.2/SUR2A is less than that of Kir6.2/SUR2B [22]. In support of this idea, if KATP channels are pre-blocked with AMP-PCP, then GTP (at concentrations which do not interact with Kir6.2) activates SUR2B-containing channels but blocks Kir6.2-SUR2A channels [5].
It has been proposed that the reduced ability of MgATP to stimulate Kir6.2/SUR2A channels is because SUR2A is less efficient at hydrolysing MgATP than SUR2B [6]. In direct opposition to this idea, we found that SUR2B hydrolyses ATP much less vigorously that SUR2A. We cannot exclude the possibility that the opposite is true when Kir6.2 is present. However, an alternative explanation is afforded by previous studies showing that mutations at site 2 that reduce the ATPase activity of SUR1 can lead to enhanced activation of Kir6.2/SUR1 channels by MgATP [23].
We speculate that the lower rate of ATP hydrolysis of SUR2B is associated with a prolonged occupancy of Site 2 of SUR2B by MgADP. This would lead to enhanced activation of Kir6.2/SUR2B channels and a reduced turnover rate. Consistent with the idea that SUR2B-NBD2 remains in the MgADP-bound, activated state for longer, MgATP first blocks Kir6.2/SUR2B channels and then current slowly increases, as if channels slowly accumulate in the MgADP-bound activated state [5]. MgATP was also more effective at slowing the off-rate of KATP channel openers on Kir6.2/SUR2B than Kir6.2/SUR2A, which might also reflect a longer occupancy of Site 2 by MgADP [5].
We therefore conclude that the lower ATP hydrolysis rate of SUR2B is associated with longer occupancy of the MgADP-bound activated state and thus increased channel activation.
Methods
Protein expression and purification
A FLAG tag was inserted into rat SUR2 between residues A1026 and D1027. Full-length SUR2A and SUR2B were expressed in insect cells (Sf9) using a baculovirus expression system (Invitrogen) and purified essentially as described for SUR1 (de Wet et al, 2007). Briefly, protein expression was verified by [3H]glibenclamide binding to infected Sf9 cells 48 hours after infection. Cells were lysed under high pressure and membranes purified by a sucrose gradient (10%/46%w/v) centrifugation step. Membranes were then solubilized in 150 mM NaCl, 50 mM Tris/HCl (pH 8.8), supplemented with 0.5% w/v dodecylmaltoside (DDM) for 20 min at room temperature. Solubilized membranes were bound to anti-FLAG M2 affinity gel, washed and eluted with 100 μM 3-FLAG peptide at 4°C (Sigma, Poole, UK). The wash buffer was 150 mM NaCl, 50 mM Tris/HCl (pH 8.8), supplemented with 0.2% w/v DDM and 0.05% w/v 1,2-dimyristoyl-sn-glycero-phosphocholine (DMPC). The elution buffer was the same as the wash buffer plus 100 μM 3-FLAG peptide. Purified protein averaged 50μg/l. Protein identity and purity was confirmed by MALDI-TOF mass spectrometry. All assays were performed on freshly prepared protein.
Rat SUR2 NBDs were cloned into the pMAL-c2X vector (New England Biolabs) to yield maltose-binding protein (MBP) fusion constructs. The sequences used were Gln635-Glu889 for NBD1, Lys1333-Lys1545 for NBD2 of SUR2A (NBD2A), Lys1333-Met1545 for NBD2 of SUR2B (NBD2B) and Lys1333-Val1502 for NBD2-ΔC. Plasmids were transformed into BL21-CodonPlus E.coli cells (Stratagene). Protein expression and purification were carried out as described previously for SUR1-NBDs (de Wet et al, 2007), but without a gel filtration step. Briefly, BL21-CodonPlus E.coli cells expressing MBP-fused NBDs were lysed under pressure in 150 mM NaCl, 50 mM Tris/HCl (pH 7.5) and 10% glycerol. Insoluble protein and debris were removed by centrifugation at 48 400 g for 30 min. The supernatant was mixed with amylose resin for 1 hour at 4°C (New England Biolabs), washed and eluted in the presence of 10 mM maltose. Wash and elution buffers contained 150 mM NaCl, 50 mM Tris/HCl (pH 7.5), plus20% glycerol to promote protein stability but no detergents or lipids. Protein identity and purity was confirmed by MALDI-TOF analysis. Yields were typically ~3mg/l for all NBDs and comprised >95% of total purified protein.
Proteins were separated on 4%-12% gradient Bis-Tris gels and visualized by Coomassie staining (Invitrogen).
Nucleotide hydrolysis
ATPase activities were measured as described for SUR1 and SUR1-NBDs (de Wet et al, 2007). The ATPase activity of SUR2B was measured using a protein concentration of >1mg/ml to ensure a robust signal above background; that of SUR2A was measured at 0.2-0.5 mg/ml.
Selwyns’ control test showed Pi release for MBP-NBDs was linear over the time course of the assay and that the relationship between protein concentration and activity was linear (Suppl Info, Fig 1). The protein concentration was 1μM for BeF (BeF3- and BeF42-) inhibition and 3-10μM for MgADP inhibition.
In some experiments, equal amounts of MBP-NBD1 and MBP-NBD2 (μg:μg) were mixed and allowed to interact on ice for 45-min prior to the hydrolysis assay.
To control for contaminating Pi in commercial ATP preparations, we included negative controls for each experimental condition, in which the protein was denatured by 5% SDS (final concentration) prior to the hydrolysis assay. Absorbance from denatured controls was subtracted from the equivalent experimental values. The maximal concentration of MgNTP that could be used without gross interference from contaminating Pi was 3mM. We used the Na salt of ATP and the K salt of MgADP. ATP and ADP were from Sigma and of ≥99% purity. Beryllium fluoride was prepared as described (de Wet et al, 2007).
Data analysis
Experimental repeats (n) refer to separate protein preparations. Data points from each preparation were done in duplicate. Values are given as mean±SEM. Significance was tested using Student's t-test.
The Michaelis-Menten equation was fitted to concentration-activity relationships to obtain the Km. All activities were expressed as Vmax (nmol Pi released/min/mg protein) and as maximal turnover rate (nmol Pi released/s/nmol protein) to allow direct comparison between proteins of different sizes.
IC50 for MgADP and Beryllium fluoride inhibition were calculated by fitting the Langmuir equation to the data:
| eqn 1 |
where y is the ATP hydrolysis rate, IC50 is the concentration of inhibitor I at half-maximal inhibition and B is ATPase activity remaining at maximal inhibition (where B=0 for complete inhibition). Ki were calculated from IC50 using the equation for competitive inhibition of Chen and Prusoff (1973):
| (eqn 2). |
Supplementary Material
Acknowledgements
This work was supported by the Wellcome Trust and the Royal Society.
Abbreviations
- ABC
ATP-binding cassette
- BeF
beryllium fluoride
- CFTR
cystic fibrosis transmembrane conductance regulator
- DDM
dodecylmaltoside
- KATP
ATP-sensitive potassium
- MBP
maltose binding protein
- MRP1
multidrug resistance protein
- NBD
nucleotide-binding domain
- SUR
sulfonylurea receptor
- TMD
transmembrane domain
References
- [1].Nichols CG. Nature. 2006;440:470–6. doi: 10.1038/nature04711. [DOI] [PubMed] [Google Scholar]
- [2].Seino S, Miki T. Prog Biophys Mol Biol. 2003;81:133–76. doi: 10.1016/s0079-6107(02)00053-6. [DOI] [PubMed] [Google Scholar]
- [3].Tucker SJ, Gribble FM, Zhao C, Trapp S, Ashcroft FM. Nature. 1997;387:179–83. doi: 10.1038/387179a0. [DOI] [PubMed] [Google Scholar]
- [4].Oldham ML, Davidson AL, Chen J. Curr Opin Struct Biol. 2008;18:726–33. doi: 10.1016/j.sbi.2008.09.007. [DOI] [PMC free article] [PubMed] [Google Scholar]
- [5].Reimann F, Dabrowski M, Jones P, Gribble FM, Ashcroft FM. J Physiol. 2003;547:159–68. doi: 10.1113/jphysiol.2002.031625. [DOI] [PMC free article] [PubMed] [Google Scholar]
- [6].Tammaro P, Ashcroft F. J Physiol. 2007;581:1259–69. doi: 10.1113/jphysiol.2007.130211. [DOI] [PMC free article] [PubMed] [Google Scholar]
- [7].Zingman LV, Hodgson DM, Bienengraeber M, Karger AB, Kathmann EC, Alekseev AE, Terzic A. J Biol Chem. 2002;277:14206–10. doi: 10.1074/jbc.M109452200. [DOI] [PubMed] [Google Scholar]
- [8].Park S, Lim BB, Perez-Terzic C, Mer G, Terzic A. J Proteome Res. 2008;7:1721–8. doi: 10.1021/pr7007847. [DOI] [PMC free article] [PubMed] [Google Scholar]
- [9].de Wet H, Mikhailov MV, Fotinou C, Dreger M, Craig TJ, Venien-Bryan C, Ashcroft FM. Febs J. 2007;274:3532–44. doi: 10.1111/j.1742-4658.2007.05879.x. [DOI] [PubMed] [Google Scholar]
- [10].Ramaen O, Sizun C, Pamlard O, Jacquet E, Lallemand JY. Biochem J. 2005;391:481–90. doi: 10.1042/BJ20050897. [DOI] [PMC free article] [PubMed] [Google Scholar]
- [11].Masia R, Enkvetchakul D, Nichols CG. J Mol Cell Cardiol. 2005;39:491–501. doi: 10.1016/j.yjmcc.2005.03.009. [DOI] [PubMed] [Google Scholar]
- [12].Bienengraeber M, Alekseev AE, Abraham MR, Carrasco AJ, Moreau C, Vivaudou M, Dzeja PP, Terzic A. Faseb J. 2000;14:1943–52. doi: 10.1096/fj.00-0027com. [DOI] [PubMed] [Google Scholar]
- [13].Zingman LV, Alekseev AE, Bienengraeber M, Hodgson D, Karger AB, Dzeja PP, Terzic A. Neuron. 2001;31:233–45. doi: 10.1016/s0896-6273(01)00356-7. [DOI] [PubMed] [Google Scholar]
- [14].Dietrich D, Schmuths H, de M Lousa C, Baldwin JM, Baldwin SA, Baker A, Theodoulou FL, Holdsworth MJ. Mol Biol Cell. 2009;20:530–43. doi: 10.1091/mbc.E08-07-0745. [DOI] [PMC free article] [PubMed] [Google Scholar]
- [15].De Marcos Lousa C, Dietrich D, Johnson B, Baldwin SA, Holdsworth MJ, Theodoulou FL, Baker A. Commun Integr Biol. 2009;2:97–9. [PMC free article] [PubMed] [Google Scholar]
- [16].Rosenberg MF, Kamis AB, Aleksandrov LA, Ford RC, Riordan JR. J Biol Chem. 2004;279:39051–7. doi: 10.1074/jbc.M407434200. [DOI] [PubMed] [Google Scholar]
- [17].Chang XB, Hou YX, Riordan JR. J Biol Chem. 1998;273:23844–8. doi: 10.1074/jbc.273.37.23844. [DOI] [PubMed] [Google Scholar]
- [18].Mao Q, Leslie EM, Deeley RG, Cole SP. Biochim Biophys Acta. 1999;1461:69–82. doi: 10.1016/s0005-2736(99)00150-9. [DOI] [PubMed] [Google Scholar]
- [19].Sun H, Molday RS, Nathans J. J Biol Chem. 1999;274:8269–81. doi: 10.1074/jbc.274.12.8269. [DOI] [PubMed] [Google Scholar]
- [20].Mikhailov MV, et al. Embo J. 2005;24:4166–75. doi: 10.1038/sj.emboj.7600877. [DOI] [PMC free article] [PubMed] [Google Scholar]
- [21].Matsuo M, Tanabe K, Kioka N, Amachi T, Ueda K. J Biol Chem. 2000;275:28757–63. doi: 10.1074/jbc.M004818200. [DOI] [PubMed] [Google Scholar]
- [22].Reimann F, Gribble FM, Ashcroft FM. Mol Pharmacol. 2000;58:1318–25. doi: 10.1124/mol.58.6.1318. [DOI] [PubMed] [Google Scholar]
- [23].de Wet H, et al. EMBO Rep. 2008;9:648–54. doi: 10.1038/embor.2008.71. [DOI] [PMC free article] [PubMed] [Google Scholar]
Associated Data
This section collects any data citations, data availability statements, or supplementary materials included in this article.


