

Summary
Maternal behaviors are essential for the survival of the young. Previous studies implicated medial preoptic area (MPOA) as an important region for maternal behaviors but details of the maternal circuit remain incompletely understood. Here, we identify estrogen receptor alpha (Esr1) expressing cells in MPOA as key mediators of pup approach and retrieval. Reversible inactivation of MPOAEsr1+ cells impairs those behaviors whereas optogenetic activation induces immediate pup retrieval. In vivo recordings demonstrate preferential activation of MPOAEsr1+ cells during maternal behaviors and changes in MPOA cell responses across reproductive states. Furthermore, channelrhodopsin-assisted circuit mapping reveals a strong inhibitory projection from MPOAEsr1+ cells to ventral tegmental area (VTA) non-dopaminergic cells. Pathway specific manipulations reveal that this projection is essential for driving pup approach and retrieval and that VTA dopaminergic cells are reliably activated during those behaviors. Altogether, this study provides new insight into the neural circuit that generates maternal behaviors.
eTOC
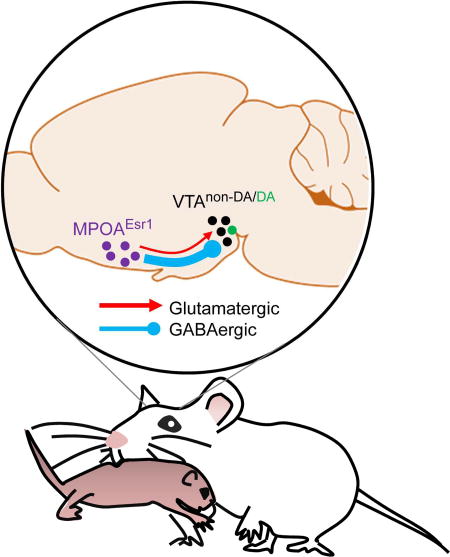
Maternal behavior is mediated by hardwired neural circuit that remains poorly understood. Fang et. al. find that medial preoptic Esr1+ cells (MPOAESR1+) are highly active during maternal behaviors. Activation of MPOAESR1+ projection to ventral tegmental area drives immediate pup retrieval.
Introduction
Across mammalian species, females exhibit elaborate maternal behaviors to ensure offspring survival (Numan and Insel, 2003). In rodents, maternal behaviors include approach and retrieving of pups strayed away from the nest, crouching over pups to provide warmth and nutrition, and grooming and licking. Decades of research have identified MPOA as a key region for expressing maternal behaviors. Damage to MPOA, including electrical and excitotoxic lesions (Lee et al., 1999; Numan, 1974; Numan et al., 1988), deafferentation (Numan and Callahan, 1980; Terkel et al., 1979), chemical inactivation (Arrati et al., 2006; Pereira and Morrell, 2009) and specific cell ablation (Wu et al., 2014) disrupt both the onset and maintenance of maternal behaviors. Immediate early gene studies revealed a high level of c-Fos (a surrogate of neural activity) in MPOA after females are exposed to pups (Calamandrei and Keverne, 1994; Lonstein et al., 2000; Tsuneoka et al., 2013).
MPOA is a heterogeneous hypothalamic structure containing cells that express several fast-acting neurotransmitters (e.g., glutamate, GABA and dopamine) and neuropeptides (Simerly et al., 1986; Tsuneoka et al., 2013; Tsuneoka et al., 2017). In addition to maternal behaviors, MPOA plays vital roles in thermoregulation (Szymusiak and Satinoff, 1982), sexual behaviors (McHenry et al., 2017), sleep (Chung et al., 2017) and object craving (Park et al., 2018). Thus, an essential first step to tease apart maternal circuits is to delineate subpopulations of neurons within MPOA relevant to maternal behaviors. To achieve this, we considered neurochemicals capable of influencing maternal behaviors, such as oxytocin (Pedersen et al., 1982), prolactin (Bridges et al., 1985), dopamine (Silva et al., 2001), norepinephrine (Smith et al., 2012) and estrogen (Siegel and Rosenblatt, 1975). Among them, evidence supporting a role for estrogen is particularly compelling. Seminal work by Rosenblatt and colleagues demonstrated that an estrogen surge during late pregnancy is essential for facilitating the onset of maternal behaviors (Rosenblatt and Siegel, 1975; Siegel and Rosenblatt, 1975). In ovariectomized virgin rats, estrogen reduces the latency for females to initiate maternal behaviors following pup exposure (Bridges, 1984; Doerr et al., 1981). This facilitating effect occurs in part through MPOA cells that express estrogen receptor alpha (Esr1), a nuclear receptor and transcription factor activated by estrogen. MPOA is one of the brain regions that express the highest levels of Esr1 (Mitra et al., 2003; Shughrue et al., 1997). In virgin female rats, implantation of estradiol in MPOA, but not in other hypothalamic regions hastened the onset of maternal behaviors (Fahrbach and Pfaff, 1986). In mice however, the importance of estrogen on maternal behaviors is less well established. Whereas knock down of Esr1 mRNA in MPOA using RNAi before pregnancy impaired the emergence of maternal behaviors in lactating females (Ribeiro et al., 2012), Esr1 knockout mice showed only mild impairment in maternal behaviors (Ogawa et al., 1998). In addition, maternal behaviors can be induced in ovariectomized females or in mice lacking aromatase, a key enzyme for estrogen synthesis (Stolzenberg and Rissman, 2011). Together, while these studies suggest a potential role for estrogen acting through Esr1 in MPOA in modulating maternal behaviors, the importance of this modulation might vary across species.
As estrogen ultimately alters the properties of Esr1-expressing cells, we hypothesized that Esr1-positive cells in MPOA are important for mediating maternal behaviors. Here, we test this hypothesis by investigating the natural responses and functional contribution of MPOAEsr1+ cells in maternal behaviors and examine the pathways downstream of the MPOAEsr1+ cells.
Results
Activity of MPOAEsr1+ cells is necessary for maternal behaviors
Esr1+ is expressed in approximately one third of MPOA cells (Esr1+/Nissl+: 7864/22144, 35.5%, from 2 animals Bregma level 0.14 to −0.22 mm,) spanning approximately 400 µm along the anterior-posterior axis (Figure S1). We first asked whether the activity of MPOAEsr1+ cells is necessary for various maternal behaviors by virally expressing hM4Di-mCherry (Armbruster et al., 2007) in MPOAEsr1+ cells using Esr1-2A-Cre female mice (Lee et al., 2014)(Figure 1A). Histological analysis revealed that hM4Di-mCherry was largely confined in the Esr1+ cells (86.3% ± 1.7%, N =3 animals) (Figure 1B). One group of females were tested between postpartum day 2 and 7, the other group consisted of spontaneously retrieving virgin females. On the day before the testing, all virgin females were screened for spontaneous retrieval and 7/10 females that retrieved all five pups within 10 minutes were used for subsequent testing. An hour before the test, we injected females with saline or clozapine-N-oxide (CNO, the engineered ligand of hM4Di) intraperitoneally. During testing, we introduced five pups into the female’s home cage at a location distant from the nest and observed the female and pup interaction for 10 minutes (Figure 1C). After saline injection, the average latency to retrieve the first pup was less than 30 s for both lactating and virgin females and all pups were retrieved within the 10 minutes testing period (Figure 1D–1E). After CNO injection, the latency to retrieve both the first and all pups increased significantly (Figure1D, Movie S1). The majority of females (virgin: 6/7; lactating: 9/10) failed to retrieve all pups during the testing period (Figure 1E). Other pup directed behaviors, including pup grooming, sniffing and crouching over were not significantly changed in duration after CNO injection (Figure 1F). GFP (or mCherry) expressing control animals showed similar pup directed behaviors on CNO and saline injected days (Figure 1G–1I).
Figure 1. Inactivation of Esr1+ cells in MPOA impaired pup approach and retrieval.

(A) Experimental design. (B) Overlap between the Esr1 (green) and hM4Di-mCherry (Red). Right shows the boxed areas on the left. Scale bars: 250 and 30 µm. (C) Experimental design. (D, E, F) Latency to retrieve the first pup (D, left) and all pups (D, right), the total number of pups successfully retrieved (E) and the total percentage of time the females spent on pup sniffing, grooming and crouching over (F) after CNO or saline injections. (G, H, I) Results from the control animals. (J) Experimental design. (K, L) Left shows tracking traces after saline (K) or CNO (L) injection. Each color indicates one trial. White arrows indicate the pup location. Raster plots show the behaviors of the female after pup introduction. (M–Q) The average latency to encounter the pup after the females walked out of the nest (M), the average distance traveled by the female before encountering the pup (N), the mean movement velocity (O), the average number of encounters per trial (P) and the percentage of successfully retrieved trials (Q) after CNO and saline injection in the test group. (R–T) the results from the control group. Error bars: ± SEM. Paired t-test. ***p<0.001, **p<0.01, *p<0.05. See also Figure S1 and Movie S1 and S2.
We also tested changes in maternal behavior after MPOAEsr1+ inactivation in a large arena, a condition under which the approach behavior can be better quantified due to the longer distance between the female and the introduced pup. The arena contained a “home base” at one corner that contains a pup, several food pellets and some nesting material from her home cage (Figure 1J). Once the female settled down in the home base, usually 10 to 20 mins after introduction, a pup was placed to the corner distant from the home base. If the female did not retrieve the pup within two minutes, the pup was then removed and a new pup was introduced 20 s later. On CNO injected days, the latency to encounter the pup significantly increased due to the longer path took by the female to reach the pup without significantly changing the movement velocity (Figure 1K–1O, Movie S2). Upon encountering the pup, the female retrieved the pup on 92% of trials on saline injected days and only 30% on CNO injected days (Figure 1P–1Q, Movie S2). In three extreme cases, lactating females treated with CNO attacked the pup after encountering it. Control animals expressing mCherry showed similar pup approach and retrieval behavior after CNO and saline injections (Figure 1R–1T).
Optogenetic stimulation of MPOAEsr1+ cells promotes pup approach and retrieval
To test the sufficiency of MPOAEsr1+ cells in promoting the onset and expression of maternal behaviors, we bilaterally expressed Cre dependent channelrhodopsin (Boyden et al., 2005) fused with yellow fluorescent protein (ChR2–EYFP) or cell filling ChR2-2A-EYFP in MPOA of virgin Esr1-2A-Cre female mice and simultaneously implanted bilateral cannula guides 0.6 mm above the injected sites to allow light delivery (Figure 2A–2B). Histology analysis showed that over 80% of light induced Fos overlapped with Esr1, supporting that the light stimulation mainly activates Esr1+ cells (Figure 2B–2C). Three weeks after injection, we first probed the spontaneous maternal behaviors by scattering 5 pups in the female’s home cage for 5 minutes on two separate days. For the 18 virgin females that showed no spontaneous pup retrieval in both probe tests, we delivered 1-min blue light (20 ms, 20 Hz) repeatedly following the second probe test. Light stimulation significantly increased retrieval probability within the 20 minute stimulation period (Figure 2E). 8/18 animals showed retrieval behavior during light stimulation and 7 out of those 8 animals also retrieved spontaneously after the test. The time spent on pup sniffing also significantly increased during light stimulation while other pup-directed behaviors were unchanged (Figure 2F). In the GFP control group, none of the 7 animals showed stimulation-evoked retrieval or developed pup retrieval behavior within the 20 min test session (Figure 2E–2F). These results suggest that repeated activation of MPOAEsr1+ cells is sufficient to promote the onset of pup retrieval behavior.
Figure 2. Optogenetic activation of MPOAEsr1+ cells induced pup retrieval.

(A) Experimental schematics. (B) The overlap between ChR2-EYFP (green) and Esr1 (red) in MPOA. Right images show the boxed area. Scale bars: 250 and 40 µm. (C) Quantification of overlap between Esr1+ and light-induced Fos in MPOA. (D) Experimental design. (E) PETH of accumulated retrieval probability in test (blue) and control (black) animals. Insets show the percentage of trials the animal retrieved before and during stimulation. (F) PETHs showing the percentage of time spent on pup grooming, sniffing and crouching of test (blue) and control (black) animals before and during light. Insets compare the average percentage spent on a maternal behavior before and during light stimulation. (G) Experiment design. (H) Left shows tracking results during three stimulation (blue) and three sham trials (white). Right shows the behavioral changes during each trial. (I–K) Percentage of sham and stimulation trials the animals walked out the home base (I) and retrieved the pup (J), and the latency to encounter the pup after walking out the home base (K) in test and control animals. In K, only animals with at least two walk-out trials during sham and real stimulation were included. (L) Experimental design. (M) Behaviors during pre-encounter and post-encounter termination trials. (N–P) The percentage of trials that the pup was retrieved (N), the latency to encounter after walking out of the home base (O), and the percentage of trials encountered a pup (P) in pre-encounter and post-encounter-termination trials. Paired t-tests. *p<0.05; **p<0.01; ***p<0.001. Error bars: ± SEM. See also Figures S2 and Movie S3.
We next investigated whether light activation can drive pup retrieval after its natural onset. For 10 spontaneously retrieving virgin females, we tested light induced behavioral changes in a larger arena where the spontaneous retrieval rate is low (Gandelman et al., 1970). During testing, after the female settled in the “home base”, a pup was introduced into the farthest corner from the female and we delivered blue light (1.5 mW, 20 ms, 20 Hz) or not (sham trials) to MPOA for 60 s or until the pup was retrieved back to the nest, whichever happened first (Figure 2G). During the 60 s sham stimulation, the females stayed in the home base for most trials and only retrieved the pup in 15% of trials (Figure 2H–2J). In contrast, upon light stimulation, the animals quickly walked out of the nest and encountered the pup in virtually all trials and retrieved the pup in 90% of trials (Figure 2H–2J). When comparing only sham and stimulation trials during which the female walked out the nest, we found that the latency to encounter the pup was shorter during MPOAEsr1+ stimulation trials, suggesting that MPOAEsr1+ activation promotes approaching behavior (Figure 2K, Movie S3). In GFP control animals that retrieved spontaneously in home cages, the probability of retrieval in the large arena was equally low during sham and stimulation trials (Figure 2I–2K).
We varied the stimulation frequency from 0 Hz to 20 Hz and found that the retrieval behavior can be induced at frequencies as low as 1 Hz. The probability of inducing retrieval increased with stimulation frequency from 1 Hz to 10 Hz, at which point performance plateaued (Figure S2A and S2B). Amongst successful trials, the retrieval latency was slightly longer during 1 and 5 Hz trials compared to the 10 and 20 Hz trials (Figure S2C).
To test whether the retrieval behavior was pup oriented or not, we introduced a pup-sized object into the large arena. Upon stimulation, the females walked out of the nest in 100% of trials, often encountered the object repeatedly but only one animal (2 sites) retrieved the object with an average latency of 38 s, suggesting that the stimulation induced retrieval is largely pup-directed (Figures S2D–S2F, Movie S3).
We sought to distinguish whether stimulation promoted pup retrieval or whether it only mobilized the female and the retrieval was a natural progression of the behavior afterwards by comparing trials where stimulation was terminated before or after pup encounter (Figure 2L). In comparison to post-encounter termination trials, the success rate of pup retrieval decreased by 60% (Figure 2M–2N) and the latency to encounter was significantly longer in pre-encounter termination trials (Figure 2O). Importantly, in 91% of pre-encounter termination trials, the female did encounter the pup (Figure 2P). Thus, the reduced retrieval rate could not be simply accounted for by a reduction in approach behavior but rather points to MPOAEsr1+ stimulation promoting pup retrieval.
We also tested MPOAEsr1+ stimulation induced behavioral change in lactating females. When the lactating female was nursing pups in their home base within the large arena, she often ignored pups introduced in the far end of the area. However, upon light stimulation, the lactating female quickly aborted nursing, walked out of the nest, approached the distal pup and retrieved it back to the nest, further supporting the idea that MPOAEsr1+ cells preferentially promote active maternal behaviors (Figure S2G–2J).
Lastly, tyrosine hydroxylase (Th) positive neurons in the anteroventral periventricular nucleus (AVPV) (Scott et al., 2015) have recently been identified as cells capable of promoting pup retrieval. In three animals expressing cytoplasm-filling ChR2-2A-EFYP in MPOAEsr1+ neurons and showing light-induced pup approach and retrieval, we observed very few AVPVTh+ cells (average 1 cell per brain section) positive for ChR2-2A-EFYP, indicating that the induced behavioral changes are unlikely resulted from activation of AVPVTh+ cells (Figure S2K–2O). Taken together, our results suggest that activation of MPOAEsr1+ cells is sufficient to facilitate the onset of maternal behaviors as well as to drive pup approach and retrieval once maternal behaviors are established.
Differential responses of MPOAEsr1+ and MPOAEsr1− populations during maternal behaviors
To reveal how MPOAEsr1+ cells change their activity during maternal behaviors, we performed photometric recordings in freely moving animals (Cui et al., 2013; Falkner et al., 2016; Gunaydin et al., 2014; Hashikawa et al., 2017). We virally expressed Cre inducible GCaMP6 (Chen et al., 2013), a genetically encoded fluorescent Ca2+ sensor, unilaterally in MPOA of the Esr1-2A-Cre female mice and simultaneously implanted a 400-µm optic fiber immediately above the injection site to deliver the excitation light and collect the emission light (Figure 3A). Post-hoc histological analysis revealed that the majority of GCaMP6 positive cells expressed Esr1 (GCaMP6+Esr1+/GCaMP6+: 635/785, 81.2% cells from 3 animals) and that approximately 15% (635/4255) of the total population of Esr1+ cells contained GCaMP6 (Figures 3B). During recording, we introduced one pup at a time for at least 6 times into the home cage of the female at a location away from the nest. After introducing the last pup, we continued recording for 30 min while the female and pups freely interacted. A total of 7 virgin females and 7 lactating female were recorded including 5 females that were recorded under both virgin and lactating states. All but one virgin female and all lactating females retrieved spontaneously.
Figure 3. MPOAEsr1+ cells are highly active during pup approach and retrieval in both virgin and lactating females.

(A) Fiber photometry setup. (B) Viral construct, targeted brain area a histological image with a fiber track (yellow line) in MPOA (dashed white line). Green: unstained GCaMP6. Red: Esr1; Blue: DAPI. Right shows the boxed area. Scale bars: 500 and 50 µm. (C) The peak frequency before and during pup presentation in virgin and lactating females. (D, E) Traces showing GCaMP6 signal (ΔF/F) during pup presentation when the female was under virgin (d) or lactating state (E). Color shades indicate various maternal behaviors. Pup is introduced at time 0. (F, H) Averaged PETHs aligned to the onset of various maternal behaviors from the session shown in d and e. Gray lines indicate individual trials and color lines indicate the average. Red dots indicate the end of trials. (G, I) Average ΔF/F during various maternal behaviors shown in F and H. One-way ANOVA. (J–L) ΔF/F during various maternal behaviors and in virgin and lactating females. One-way ANOVA and t-test. Color convention in G–K as that in F. (K–L) Average ΔF/F during various maternal behaviors (K) and maximum ΔF/F (L) in the same females under virgin (V) and lactating (L) states. Paired t-test. *p<0.05; **p<0.01; ***p< 0.001. Error bars: ± SEM. See also Figure S3–S6.
In the presence of pups, we observed a significant increase in the frequency of Ca2+ peaks in both virgin and lactating females in comparison to the before-pup baseline period (Figure 3C). The GCaMP6 signal started to rise as the female approached the pup and peaked at the onset of retrieval. When the female sniffed the pups, the Ca2+ activity also increased significantly but to a lesser extent than retrieval. Sniffing an object (plastic tube) caused no change in MPOAEsr1+ cell activity. During pup grooming, the Ca2+ activity was more variable and not significantly changed across animals. As the female quietly crouched over the pups or gathering nesting materials, Ca2+ activity either did not change or slightly decreased (Figure 3D–3J). When comparing the responses of MPOAEsr1+ responses of the same animal in different reproductive states, we found that the average response during pup approach and retrieval was significantly larger during lactation than during virgin state (Figure 3K). This increase in response was not due to general enhancement in the GCaMP6 signal since the maximum amplitude did not differ (Figure 3L). In five control animals that expressed GFP in MPOAEsr1+ cells, we observed little change in fluorescence during any maternal behaviors (Figure S3).
We also introduced an adult female and an adult male, each for 10 minutes, into the home cage of the recorded female after the pup session. When the recorded virgin or lactating females sniffed the male for the first time, the Ca2+ signal increased to a similar extent as that during sniffing pups (Figure S4A and S4F). However, the response to males quickly adapted during subsequent sniffing trials. By the third trial, the response to male was significantly lower than that to pups in both virgin and lactating females (Figures S4A–S4D and S4F–S4I). The peak response during the last sniffing trial towards a male was below 30% of the first trial while the last pup sniffing trial evoked a response between 60% (virgin) and 70% (lactating) of the first sniffing trial (Figures S4E and S4J). When the recorded female encountered a female intruder, the Ca2+ response during initial sniffing was significantly lower than that towards pups and males and continued to decease with repeated sniffing (Figures S4A–S4J). When all trials are considered, MPOAEsr1+ cell response to pups was significantly higher than that towards males and females in both virgin and lactating females (Figure S4K and S4L). Lastly, in the five females that were recorded under both virgin and lactating states, the average responses during male or female investigation did not differ significantly between reproductive states (Figure S4M).
To address whether MPOAEsr1+ cells represent a unique population preferentially involved in maternal behavior or a random subset of all MPOA cells, we designed a Cre-out GCaMP6f construct that expresses GCaMP6f exclusively in non-Cre expressing cells (Figure S5A–S5C). Histological analysis revealed a large number of GCaMP6+ cells present in MPOA (Average cells per section in Cre-out animals:198; Cre-in animals: 60) and minimal overlap between GCaMP6 and Esr1 expression (Esr1+GCaMP6+/GCaMP6+: 13/2971 (0.4%) cells in 3 animals; a total of 3693 Esr1+ cells were present in those images) (Figures S5A–S5C). In contrast to recordings from the Esr1+ population, we found that in the five virgin and three lactating Cre-out females the GCaMP6 peaks occurred at a similar frequency before and during pup presentation (Figure S5D). During maternal behaviors including pup retrieval, we observed little change (1–2%) in signal in both lactating and virgin females (Figures S5E–S5G). The Ca2+ activity change during maternal behaviors was not significantly different from that during object investigation (Figures S5E–S5G). Thus, in comparison to the Esr1− cells, Esr1+ cells are preferentially activated during maternal behaviors. Analysis with Z-score normalized GCaMP6 signals reached qualitatively similar conclusion (Figures S6).
Individual MPOA cells signal components of maternal actions
To understand the responses of individual MPOA cells and their potential change with the reproductive state, we next performed chronic in vivo single unit recording in freely moving animals using a movable 16-microwire bundle (Falkner et al., 2014; Lin et al., 2011) (Figure 4A). We recorded from 5 females under virgin, lactating and/or post-lactation states. In three of those animals, we attempted to identify Esr1+ cells using ChR2-assissted cell identification (Cardin et al., 2010). We injected Cre dependent ChR2-EFYP into MPOA of Esr1-2A-Cre mice and implanted a 100-µm optic fiber together with the microwire bundle for light delivery (Figure 5A). During recording, the test female was alone in the home cage for the first 5 min and then multiple pups, one at a time, were presented for 15–20 minutes. After pup session, a male intruder and a female intruder was introduced for 10–15 minutes of each. At the end of the recording, post-hoc histology was obtained to confirm the position of the electrodes and only animals with correct MPOA targeting were included in the final analysis (Figure 4B and 5A).
Figure 4. Electrophysiological recording of individual MPOA cells during maternal behaviors in virgin and lactating females.

(A) Recording schematics. (B) Histology showing the electrode track in MPOA (red dashed lines). Scale bar: 500 µm. (C) Average spontaneous firing rate of MPOA cells in females of different reproductive states. Each dot represents one cell. V: virgin; L: lactating; P: post-lactation. Student t-test. (D) The firing rate change in the presence of a pup is negatively correlated with the baseline firing rate. Pearson’s cross-correlation. (E) The average firing rate before pup introduction, during no interaction period in the presence of a pup and during pup sniffing. One way ANOVA with repeated measures. (F) The percentage of excited (red), inhibited (blue) and non-responsive (gray) cells in animals of different reproductive states. (G) Raster plots and PETHs of an example cell aligned to various maternal behaviors. (H) The percentage of excited and inhibited cells during various maternal behaviors. (I) The Z scored responses of excited cells (Z>2) across maternal behaviors. One way ANOVA. p< 0.05. (J) Average Z scored PETHs of excited cells (Z>2) aligned to pup approach, retrieval and sniffing in virgin (black), lactating (red) and post-lactation (blue) females. One-way ANOVA for each time point. Red dots: p< 0.05; black dots: p< 0.1. Insets show the percentage of excited cells in females of different reproductive states. Fisher’s exact test. (K) Heat map showing the PETHs of all cells excited during pup retrieval. Black dots indicate the first time bin with Z >2. (L) Response matrix of firing rate change sorted by the score of the first principal component (PC). N = 64 cells with data from all six behaviors. (M) The coefficients of the first three PCs that explained 72%, 17% and 5% of the variability in the response matrix shown in L. V: virgin; L: lactating: P: post-lactation. *p< 0.05; ***p< 0.001. See also Figure S7.
Figure 5. Optrode recording shows preferential responses of MPOAEsr1+ cells during pup approach and retrieval.

(A) The optrode track (yellow arrow heads) in MPOA (white dashed lines). Green: unstained ChR2-EYFP; Blue: DAPI. Scale bar: 250 µm. (B) Average waveforms of spontaneous spikes (green) and light evoked spikes (blue) from a representative light-excited cell. Scale bars: 25 µV (vertical) and 0.25 ms (horizontal). Pearson’s cross correlation. (C) Raster plots and PETHs showing the cell responses to 1s (left) and 1ms (right) light stimulation. Bin sizes: 100 ms (left) and 1 ms (right). Shades represent light-on periods. (D) Raster plots and PETHs of a putative Esr1+ cell aligned to the onset of various maternal behaviors. Red marks indicate the behavioral offset. (E) Heat map shows the Z scored responses of MPOA cells during pup retrieval, approach, sniffing, and nest building, sorted by responses during pup retrieval. Putative Esr1+ cells are indicated with white dots. N = 117 cells that contain data from all four behaviors. (F) The percentage of Esr1+ cells (open) and total cells (filled) that are excited (Z > 2) during each maternal behavior. Fisher’s exact test. *p<0.05. See also Figure S8.
A total of 299 well-isolated single units were recorded. We first compared the spontaneous firing rates of MPOA cells in animals under different reproductive states. Although previous studies indicated an increase in baseline c-Fos in lactating females (Tsuneoka et al., 2013), we found that the spontaneous activities of MPOA cells were significantly lower in lactating than non-lactating animals. The mean firing rates of cells in virgin and post-lactation animals were 3.36 ± 0.46 (mean ± SEM, n =126 cells) and 3.18 ± 0.52 sp/s (n = 81 cells) respectively, which were almost twice as high as that in lactating animals (1.89 ± 0.34 sp/s, n = 92 cells) (Figure 4C). This decrease in baseline firing may be advantageous for detecting the pup cues given that the response to pup was significantly negatively correlated with the baseline firing rate across the population such that MPOA cells with low baseline firing rate were more likely to increase firing in the presence of the pup (Figure 4D). Indeed, the presence of pup, even without any physical interaction, induced a small but significant increase in firing rate of MPOA cells in lactating females (paired t-test, p = 0.03) but not in non-lactating females (virgin: p = 0.80; post-lactation: p = 0.88) (Figure 4E). Sniffing the pup further increased the firing rate in lactating females but not in virgin and post-lactation females (Figure 4E).
We next analyzed the firing rate change during approaching, sniffing, retrieving, grooming, crouching over pups and nest building (Figures 4G). Approximately 30% (87/299) of all MPOA cells significantly increased (Z >2) and 10% (30/299) significantly decreased firing (Z < −2) during at least one pup-directed behaviors. The pup-excited cells were most abundant in lactating females (virgin: 28/126, 22.2%; lactating: 40/92, 43.5%; post-lactation: 19/81, 23.5%, Fisher probability test 2×3 table: p = 0.0017) (Figure 4F) whereas the proportion of pup-inhibited cells were comparable across reproductive state (virgin: 10/126, 7.9%; lactating: 12/92, 13.0%; post-lactation: 8/81, 9.9%, Fisher probability test 2×3 table: p = 0.475) (Figure S7A).
MPOA cells can be excited or inhibited during all aspects of maternal behaviors although the proportion of responsive cells and the magnitude of response varied across behaviors (Figure 4G–4I). The most dramatic response was observed during pup retrieval: some cells reached a peak firing rate over 50 Hz from a baseline firing rate of 2Hz before pup introduction (Figure 4G). Importantly, most retrieval-excited cells (33/41, Z>2) started to respond (Z > 2) before the retrieval onset, which was defined as the moment of jaw opening (Figure 4K), suggesting that the neural responses in MPOA preceded instead of resulted from the retrieving actions. Across the reproductive states, the lactation females contained the highest percentage of MPOA cells that were excited during various pup-directed behaviors and the response magnitude of the excited cells was the largest during lactation (Figure 4J).
We next examined the relationship of cell responses during various maternal behaviors and found that cell responses during pup approach, sniffing and retrieval were highly correlated, but approximately one third of retrieval-excited cells (Z > 2) were not activated during pup sniffing (Z<2), suggesting that those cells might specifically signal the retrieving behavior rather than the pup-related sensory cues (Figure 4L and 4M, Figure S7B–S7C). The activity increase during pup grooming also was weakly correlated with the activity change during pup retrieval (Figure S7D) although the overall activity change during pup grooming was low (Figure 4I). The response during crouching over pup was negatively correlated with the response during pup retrieval (Figure S7E). Lastly, although pup-retrieval and nest building both involve jaw movements, the responses of MPOA cells during these two behaviors were significantly negatively correlated: all the cells that were highly activated during pup retrieval (Z > 10) were suppressed during nest building to some extent (Z < 0) (Figure S7F). Consistent with the correlation analysis, principal component analysis (PCA) revealed that the main variance in the response matrix could be explained by the combined responses during active pup directed behaviors, especially pup retrieval (PC1, 72%), opposing responses during crouching and grooming pups and pup retrieval (PC2, 17%), and response during nest building (PC3, 5%) (Figure 4L and 4M).
In the three animals that were implanted with an optrode, we delivered short pulsed blue light (473 nm, 5 Hz, 1 or 2ms) and 1s continuous light through the optrode during each recording session and found a total of 17 putative Esr1+ cells that exhibited reliable light-evoked spiking with short latency (mean ± STD = 5.5 ± 1.4 ms) and low jitter (mean ± STD = 0.75 ± 0.50 ms) and had waveforms similar to that of spontaneous spikes (r = 0.97 ± 0.03) (Figures 5A–5C and S8). Approximately 60% of the Esr1+ cells (Virgin: 3/7; Lactating: 4/6; and Post-lactation: 3/4) increased activity (Z >2) during at least one pup-directed behavior and no Esr1+ cells were inhibited. Across the maternal behaviors, 60% of Esr1+ cells (7/12) increased firing rate during pup retrieval and 6/13 cells increased during pup approach, whereas less than 30% of Esr1+ cells responded during pup sniffing (5/17) and grooming (1/9) and no cell responded during crouching over pups (0/6) or nest building (0/10) (Figure 5D–5F, Figure S8). In comparison to the total population, Esr1+ cells were significantly more likely to become activated during pup approach and retrieval but not other maternal behaviors (Figure 5F).
Differential MPOA populations respond to adult social cues and pups
In additional to the response to pups, we found that 12% of MPOA cells increased firing rate (Z > 2) during adult male (30/255) or female investigation (30/249) (Examples shown in Figures 6A–6C). In non-lactating females, the percentage of cells excited during sniffing male, female and pup was comparable (approximately 10 to 15% of the total population) (Figure 4J and 6D). In lactating animals, the percentage of cells excited during pup sniffing was more than doubled (Figure 4J) while the percentage of male- or female-excited cells did not increase (Figure 6D). Moreover, in lactating females, the response magnitude of individual cells during pup sniffing increased significantly (Figure 4J) while responses during male or female sniffing did not (Figure 6D).
Figure 6. The relationship among MPOA cell responses to pups, adult male and adult female.

(A–C) Raster plots and PETHs aligned to the onset of sniffing pup, male and female from three representative cells. (D) Average Z scored PETHs aligned to the onsets of male (left) and female sniffing (right) in virgin (black), lactating (red) and post-lactation (blue) females. Shades show ± SEM. Insets show the percentage of behavior-excited cells in females under different reproductive states. Fisher’s exact 2 × 3 tests, p > 0.05. V: virgin; L: lactating; P: post-lactation. (E–G) The relationships of cell responses (Z score) during pup, male and female sniffing. Each dot represents one cell. Color represents response type. Pearson’s cross correlation. (H) Venn-diagram showing the number of responsive cells to male, female and pup.
Across the whole population, the response to pups and males was uncorrelated (r = −0.0028, p = 0.967) (Figure 6E). In contrast, responses during sniffing of males and females were highly correlated (R = 0.392, p = 1.55 ×10⁻⁹) (Figure 6B, 6C and 6F). Responses during sniffing of females were also weakly correlated with responses during pup investigation (R = 0.269, p = 5.03 × 10⁻⁵) although none of the strongly pup-excited cells (Z > 10) were excited during sniffing of females (Figure 6G). Thus, largely distinct subsets of MPOA cells are excited by pups and adult males while female-excited cells partially overlap with both male- and pup-excited cells (Figure 6H).
Projection of MPOAEsr1+ cells
We took advantage of the strong labeling of axonal arbors by virally delivered ChR2-EYFP to study the innervation of pattern of MPOAEsr1+ cells across the brain (Figure S9A–S9C). MPOAEsr1+ cells project via both the periventricular and the medial forebrain bundle (MFB) descending pathways, as described in previous tracing studies (Simerly and Swanson, 1988). The periventricular descending pathway provides dense inputs to several midline structures, including paraventricular nucleus of the hypothalamus (PVN), both anterior and posterior part of periventricular nucleus (Pv), and arcuate nucleus (ARC) while the MFB pathway targets a wide collection of hypothalamic and midbrain regions, including the retrochiasmatic area (RCh), dorsomedial hypothalamus (DMH), ventrolateral part of the ventromedial hypothalamus (VMHvl), tuberal area (Tu), lateral hypothalamic area (LHA), ventral premammillary nucleus (PMv), supramammillary nucleus (SUM) and ventral tegmental area (VTA). A branch of this projection travels more caudally to target mainly the periaqueductal gray (PAG) (Figure S9A–S9C).
We asked whether neurons in any of these downstream regions are preferentially targeted by MPOAEsr1+ cells in comparison to MPOAEsr1− cells, reasoning that regions preferentially targeted by MPOAEsr1+ cells are more likely to be relevant for maternal behaviors. We injected a fluorescent retrograde tracer into downstream regions and examined the overlap between the retrogradely labeled cells in MPOA and Esr1. We examined DMH, VMHvl, and VTA and found that Esr1 is expressed in 60 to 70% of MPOA cells that are retrogradely labeled from VMHvl or VTA, which is significantly higher than chance, whereas only 35% of MPOA cells labeled from DMH express Esr1 (Figure S9D–S9H).
VTA dopaminergic cells are reliably excited during pup retrieval
The preferential projections from MPOAEsr1+ cells to VTA and VMHvl suggest their participation in maternal behaviors, especially pup retrieval. However, population recordings from VMHvl did not reveal changes in neural activity during pup retrieval (Hashikawa et al., 2017). In addition, VMHvl inactivation failed to impair pup retrieval, arguing against a role of VMHvl in MPOA-mediated maternal behaviors (Hashikawa et al., 2017). We therefore investigated whether VTA dopaminergic cells may be recruited during maternal behaviors using photometric recording of Cre-dependent GCaMP6f virally expressed in the VTA of dopamine transporter (DAT)-ires-Cre mice (Figure 7A–7B). Histology analysis revealed high overlap between the GCaMP6f and tyrosine hydroxylase (TH), confirming the identity of the recorded neurons as dopaminergic (Figure 7C). In spontaneously retrieving virgin females, Ca2+ activity increased significantly and maximally during pup retrieval (Figure 7D–7F). Interestingly, VTADAT+ and MPOAEsr1+ cells differed in their response dynamics: while MPOAEsr1+ cells showed sustained activity increases until completion of retrieval, VTADAT+ cells transiently elevated their activity at the onset of the pup retrieval (Figure 7G–7H). At retrieval offset, Ca2+ responses in VTADAT+ and MPOAEsr1+ cells were 30% and 95% of initial peak values, respectively (Figure 7I). Moreover, VTADAT+ cell responses during maternal behaviors were stable across repeated trials (Figure 7J), in stark contrast to the fast-adapting responses observed during adult investigation (Figure S10)(Gunaydin and Deisseroth, 2014).
Figure 7. Responses of VTA dopaminergic neurons during maternal behaviors.

(A) Experimental schematics. (B) A histology image showing the fiber track and GCaMP6f expression in the VTA. Scale bar: 1 mm. (C) Zoomed in of the boxed area in B. Green: GCaMP6f; Red: tyrosine hydroxylase (TH); Blue: DAPI. Scale bar: 40 µm. (D) ΔF/F during a pup session. Color shades indicate manually annotated behavior episodes. (E) PETHs of ΔF/F aligned to the onset of various maternal behaviors. (F) The average GCaMP6 responses during various maternal behaviors. One way ANOVA with repeated measures and t-test. (G) Heat maps showing the GCaMP6 signal during repeated retrieval trials in D. (H) Average PETHs of GCaMP6 signals from MPOAEsr1+ cells (red, N = 6 virgin females) and VTADAT+ cells (green, N = 4 virgin females) aligned to the onset (left) and offset (right) of pup retrieval. (I) The ratio between the offset ΔF/F to the maximum ΔF/F during the first 2 s after retrieval onset. Student t-test. (J) The peak ΔF/F over repeated pup retrieval trials. One way ANOVA with repeated measures. p > 0.05. *p<0.05; **p< 0.01; ***p<0.001. Error bars: ± SEM. See also Figure S9–S11.
To address whether MPOAEsr1+ cells provide maternal behavior related information to the VTA, we next examined the natural responses of MPOAEsr1+ to VTA projectors by injecting retrograde HSV expressing Cre-dependent GCaMP6f into the VTA of Esr1-2A-Cre mouse and placing a 400 µm optic fiber above MPOA. Similar to the recording from MPOAEsr1+ cells, MPOAEsr1+ to VTA projectors reliably increased activity during pup retrieval (Figure S11).
The projection from MPOAEsr1+ to VTA drives maternal behaviors
To understand how MPOAEsr1+ cells synaptically impact dopaminergic neurons in VTA we performed whole-cell voltage-clamp recordings in horizontal slices of VTA from mice expressing ChR2-EYFP in MPOAEsr1+ neurons (Figure 8A). We distinguished dopaminergic from non-dopaminergic neurons using injections of fluorescent retrobeads into nucleus accumbens, which overwhelmingly label dopaminergic neurons in VTA (Lammel et al., 2011), as well as electrophysiological parameters (Chieng et al., 2011). Full-field illumination of recorded neurons for 1 ms with blue light revealed a mixture of monosynaptic (synaptic delay: 2.1 +/− 0.1 ms) excitatory and inhibitory postsynaptic currents (EPSCs and IPSCs; Figure 8B), consistent with the existence of both GABAergic and glutamatergic MPOAEsr1+ neurons (Figure S12A–S12C). In both populations of VTA neurons, glutamatergic EPSCs were never observed without accompanying IPSCs and were on average smaller in amplitude compared to IPSCs (Figure 8B, D). Whereas IPSCs reliably occurred in all recorded non-dopaminergic neurons, they were only detected in 7 out of 18 (39%) dopaminergic cells (Figure 8C). In addition, GABAergic IPSCs in non-dopaminergic cells were ~3-fold larger than in dopaminergic neurons, suggesting that MPOAEsr1+ cells preferentially target and inhibit non-dopaminergic neurons within VTA (Figure 8D).
Figure 8. MPOAEsr1+ to VTA projection is essential for driving pup approach and retrieval.

(A) Image from a recorded brain slice (horizontal section) that contains ChR2-EFYP fiber from MPOAEsr1+ cells (green), retrobeads (red) from the nucleus accumbens and TH staining (blue). Scale bar: 100 µm. All recording attempts were made from regions containing ChR2-EYFP fibers and bead+ cells. (B) Examples of excitatory (black) and inhibitory (red) postsynaptic currents measured in putative dopaminergic (DA) and non-dopaminergic (non-DA) VTA neurons voltage-clamped at the reversal potential for GABAergic (−70 mV) and glutamatergic (0 mV) conductances upon optogenetic stimulation (blue bar, 1 ms) of MPOAEsr1+ afferents. (C) Proportion of recorded cells (in parentheses) in which light stimulation reliably evoked EPSCs and IPSCs >10 pA in amplitude. Chi-square tests. (D) Box plots of absolute light-evoked EPSC and IPSC amplitudes in putative VTA DA and non-DA neurons. (E) Experimental schematics. (F) Histology images showing expression of ChR2-EYFP and the fiber tracks (white lines) at MPOA and VTA (dashed yellow lines). Scale bars: 250 µm. (G–I) The percentage of trials the animals walked out (G) and retrieved (H), and the latency to encounter the pup after walking out the home base (I) during sham and real stimulation. In I, only animals with at least two walk-out trials during sham stimulation were included in the analysis. (J) Experimental schematics. (K–N) The percentage of trials animals walked out of the home base (K) and encountered pup after walking out (L), the latency to encounter the pup after walking out of the home base (M), and the percentage of trials animals retrieved the pup (N) after saline and drug injection in sham (black) and light stimulation trials (blue). Paired t-test. *p< 0.05 and *** p< 0.001. Error bars: ± SEM. See also Figure S12 and Movie S4.
To test how the MPOAEsr1+ projection to VTA affects behavior in vivo, we virally expressed ChR2-EYFP in MPOAEsr1+ cells and delivered light in VTA (Figure 8E–8F). Upon stimulation, females approached pups with a shorter latency and retrieved pups in 92% of trials (Figure 8G–8I). To investigate the possibility that VTA terminal activation also recruit other downstream areas through collateral axons, we examined the projection pattern of MPOAEsr1+ neurons that innervate VTA across the brain by injecting retrograde HSV expressing Cre-dependent flipase (Flp) into VTA and an AAV expressing EGFP contingent on the presence of both Flp and Cre into MPOA of Esr1-2A-Cre mice (Figure S12D). Three weeks after injection, we observed EGFP expressing cells in MPOA and abundant fibers in VTA (Figure S12E–S12F). Additionally, we noticed fibers in various regions along the MFB pathway, including dense fibers in RCh, Tu and LHA moderate fibers in VMHvl, DMH and SUM, and relatively weak fibers in PAG (Figure S12E–S12F). These fibers were studded with enlarged boutons, hinting at synaptic connections with local neurons (Figure S12F). Noticeably, PMv (a medial hypothalamic structure posterior to VMHvl) appeared devoid of fibers. Few fibers were also observed within midline structures (Pv, PVN, ARC and PvP; Figure S12E–S12F). Thus, MPOAEsr1+ -VTA projectors target other structures along the MFB but provide limited inputs to midline structures.
Given that VTA-projecting MPOAEsr1+ neurons also innervates other regions along the MFB pathway, we asked whether activation of VTA is necessary for MPOA-evoked behavioral changes by blocking neuronal spiking within VTA with a sodium channel blocker bupivacaine (Figure 8J). Bupivacaine-injected females continuously walked out of the home base upon MPOAEsr1+ light stimulation and encountered pups at least once during the 60 s stimulation period (Figure 8K–8L). However, the latency to encounter increased significantly in the presence of bupivacaine (Figure 8M). Strikingly, bupivacaine injection nearly abolished spontaneous as well as MPOAEsr1+ stimulation-induced retrieval behavior, whereas saline injected females continuously retrieved pups upon MPOAEsr1+ activation (Figure 8N, Movie S4).
Discussion
Here, we identified MPOAEsr1+ cells as an essential population for mediating maternal behaviors, especially pup approach and retrieval, in female mice. These cells are preferentially activated prior to and during pup retrieval. Inactivation of MPOAEsr1+ cells specifically impairs approach and retrieval behaviors whereas optogenetic activation acutely drives these behaviors, at least in part through efferent projections to the VTA.
Response patterns of female MPOA cells during maternal behaviors
Our in vivo recordings reveal how MPOA cells respond during maternal behaviors. First, MPOA cells show increased activity during all “active” maternal behaviors and decreased activity during “inactive” maternal behaviors (e.g. crouching). Second, MPOA cells are most excited during the “appetitive” phase of maternal behaviors (Numan and Insel, 2003) which involves active, voluntary motor components for the purpose of acquiring pups. Importantly, the rise in activity precedes retrieval onset, suggesting a potential role in promoting behavior. Third, the activity of MPOA cells during baseline and in responses to pups varies with reproductive state. During lactation, spontaneous firing rate decreases while the percentage of MPOA cells active and their response to pups increase. One possible factor mediating these changes is estrogen (Woolley, 1998). During pregnancy, sequential waves of sex hormones induce significant increases in soma size and dendritic length of MPOA neurons, suggesting enhanced cellular metabolism and protein synthesis (Keyser-Marcus et al., 2001). These newly generated proteins might modify synaptic connections and alter the membrane composition of ion channels and receptors, ultimately leading to enhanced responses to pup cues. Another important contributor may be oxytocin. In vitro slice recordings showed that oxytocin increases signal to noise in hippocampal and auditory cortex pyramidal neurons by elevating the discharge of fast-spiking interneurons that synapse onto pyramidal cells (Marlin et al., 2015; Owen et al., 2013). In dams, the surge of oxytocin may similarly enhance MPOA cells’ responses towards pups, as MPOA neurons express oxytocin receptors abundantly, especially during lactation (Meddle et al., 2007).
Esr1 as a molecular marker for MPOA cells essential for pup retrieval
Our results suggest that MPOA cells that mediate pup approach and retrieval express Esr1. Optrode recordings revealed that Esr1+ cells are more likely to become activated during pup approach and retrieval compared to other MPOA neurons. Optical recordings showed that Esr1+ cells are highly activated during pup retrieval while Esr1− cells, which represent over 60% of all MPOA cells are not. However, it is important to note that MPOAEsr1+ cells do not constitute a homogenous population. MPOAEsr1+ cells respond to interactions with both pups and adults. A recent study demonstrated that optogenetic activation of MPOAEsr1+ cells drives not only pup retrieval, but also mounting in both males and females (Wei et al., 2018). Detailed characterization of MPOA neuropeptide expression patterns revealed that Esr1 partially overlaps with several neuropeptides, including neurotensin and galanin (Tsuneoka et al., 2017). The neurotensin and galanin expressing cells are found important for female-male attraction (McHenry et al., 2017) and pup grooming (Wu et al., 2014), respectively. Future studies employing intersectional molecular strategies will help refine the identity of MPOA cells essential for individual aspects of maternal and other social behaviors.
VTA transforms motivation into action during social behaviors
Lesion and immediate early gene studies suggest a key role for VTA in maternal behaviors (Hansen et al., 1991; Numan and Smith, 1984; Stack et al., 2002). Our results provide additional evidence for this and suggest that MPOAEsr1+ afferents to VTA are particularly important in mediating pup retrieval in female mice. MPOAEsr1+ cells provide inhibitory synaptic inputs to non-dopaminergic VTA neurons, many of which are GABAergic neurons that tonically inhibit neighboring dopaminergic cells (Tan et al., 2012). Dopaminergic neurons may consequently be activated by MPOAEsr1+ afferents through disinhibition. Consistent with this, dopaminergic cells in VTA show reliable activity increase at the onset of pup retrieval episodes, supporting a phasic role for those cells in driving maternal behaviors.
MPOAEsr1+ cells that project to VTA also innervate several other brain regions along the MFB pathway. This one-to-many organization is common for medial hypothalamic neurons and may allow for the coordinated expression of multiple aspects (e.g. motor, autonomic and neuroendocrine) of complex behaviors (Ciriello et al., 2003; Vertes and McKenna, 2000; Wang et al., 2015). Because MPOAEsr1+ neurons are mainly GABAergic, it is likely that these other target brain areas are similarly inhibited by MPOAEsr1+ neurons. MPOAEsr1+ cells may, for instance, inhibit VMHvl to eliminate the expression of aggression and sexual behaviors (Hashikawa et al., 2017; Lee et al., 2014; Lin et al., 2011; Yang et al., 2013), while innervation of caudal PAG may suppress nursing (Salzberg et al., 2002). In addition, LHA also innervates VTA (Nieh et al., 2016). Thus, MPOAEsr1+ cells may influence VTA though direct and indirect pathways that either synergize or balance one another. One of the limitations of our bupivacaine inactivation experiment is that it does not distinguish between these possibilities, warranting future studies using pathway specific functional manipulations to delineate their respective contributions to maternal behavior.
How the motivational system is connected to motor system is a long standing question in neuroscience. A widely cited model proposed by Mogenson et. al. places VTA as an essential node between the hypothalamic motivational and striatal motor systems (Mogenson et al., 1980). In support of this, recent studies showed that inputs from lateral hypothalamus GABAergic cells and MPOA neurotensin cells promote social approach and social interaction (McHenry et al., 2017; Nieh et al., 2016). Here, we further demonstrated that MPOAEsr1+ afferents to VTA are sufficient to drive a specific component of maternal behavior: pup retrieval. As the identities of hypothalamic neurons contributing to specific social behaviors become increasingly understood (Hashikawa et al., 2017; Lee et al., 2014; Wu et al., 2014; Yang et al., 2013), so too will the involvement of VTA as a common gateway for transforming motivation into social actions.
STAR METHODS
Detailed methods are provided in the online version of this paper and include the following:
KEY RESOURCES TABLE
CONTACT FOR REAGENT AND RESOURCE SHARING
EXPERIMENTAL MODEL AND SUBJECT DETAILS
- METHOD DETAILS
-
◦Viruses
-
◦Stereotactic surgery
-
◦Behavioral annotation and tracking
-
◦hM4Di neural silencing
-
◦ChR2 mediated cell activation
-
◦Fiber photometry
-
◦In vivo electrophysiological recordings
-
◦In vitro electrophysiological recordings
-
◦Tracing
-
◦Immunohistochemistry and image analysis
-
◦
QUANTIFICATION AND STATISTICAL ANALYSIS
DATA AND SOFTWARE AVAILABILITY
REFERNECES
CONTACT FOR REAGENT AND RESOURCE SHARING
Further information and requests for resources and reagents should be directed to and will be fulfilled by the Lead Contact, Dayu Lin (Dayu.lin@nyumc.org).
EXPERIMENTAL MODEL AND SUBJECT DETAILS
All procedures were approved by the IACUC of NYULMC in compliance with the NIH guidelines for the care and use of laboratory animals. Mice were housed under a 12 h light-dark cycle (12 p.m. to 12 a.m. light), with food and water available ad libitum. Test animals were adult Esr1-2A-Cre female mice (> 10 weeks). They were originally provided by D.J. Anderson (Lee et al., 2014) and now available from Jackson Laboratory (Stock No. 017911). Vgat-ires-Cre and Vglut2-ires-Cre knock-in mice (Vong et al., 2011) were provided by B. Lowell and are now from Jackson Laboratory (stock No: 016962 and 016963). DAT-ires-Cre line was purchased from Jackson laboratory (stock No.006660). Ai6 (Madisen et al., 2010) was purchased from the Jackson Laboratory (Stock No.007906) and crossed with Vgat-ires-Cre and Vglut2-ires-Cre mice. Stimulus animals were 3–10 days old pups from C57BL/6N pairs. For all functional manipulation experiments, the age matched pups were used for control and test groups. After surgery, all the animals are single housed or housed with the litter. All the experiments are performed during the dark cycle of the animals.
METHOD DETAILS
Viruses
AAV1- EF1α -DIO-hM4D(Gi)-mCherry (3.0 × 10¹² vg/ml), AAV1-hSyn-DIO-mCherry (3.0×10¹² vg/ml), AAV2-EF1α-DIO-ChR2-EYFP (6.8 × 10¹² vg/ml) and AAV5 hSyn-Con/Fon-eYFP (4.8 × 10¹² vg/ml) were purchased from University of North Carolina vector core facility. AAV1-CAG-Flex-GCaMP6s (2.0×10¹² vg/ml), AAV1-CAG-Flex-GCaMP6f (1.59 × 10¹² vg/ml) and AAV2 CAG-Flex-GFP (3.7 × 10¹² vg/ml) were purchased from the University of Pennsylvania vector core facility. HSV hEF1α-LSL-mCherry-ires-flpoHT (1 × 10⁹ vg/ml) and HSV hEF1α-LSL-GCaMP6f (1 × 10⁹ vg/ml) was purchased from MIT vector core. AAV2-EF1α-loxP-GCaMP6f-loxP-WPRE (1× 10¹³ vg/ml) was custom constructed and prepared by NYU Abu Dabi viral center of G. Fishell lab. All viruses were stored in aliquots at −80 °C until use.
Stereotactic Surgery
For functional manipulation experiments, virus was stereotactically injected into the MPOA (AP: 0.02 mm, ML: 0.325 mm, DV: 5.1 mm) bilaterally through a glass capillary using nanoinjector (World Precision Instruments, Nanoliter 2000) at 20 nl/min. For gain of function experiments, a bilateral guide cannula (Plastics One, center to center distance = 1.0 mm) was inserted 0.6 mm above the MPOA or VTA (AP: −3.28 mm, ML: 0.5 mm, DV: 4.0 mm) and was secured using dental cement (C&B Metabond, S380). For recording of Esr1+ cells, an optrode, which was composed of a 16 channel microwire bundle and a 105 mm multimode optic fiber, was implanted into the MPOA after injecting the ChR2-expressing virus. The tip of optrode was aimed at the dorsal boundary of the MPOA during implantation (AP: 0.02 mm, ML: 0.325 mm, DV: 4.5 mm). For fiber photometry experiments, after unilateral injection of GCaMP6s or GCaMP6f expressing virus, a custom made optic fiber assembly (Thorlabs, BFH48-400, CF440-10) was inserted ~100 µm above the dorsal boundary of the MPOA of Esr1-2A-Cre mice or VTA of DAT-ires-Cre mice. For the slice recording experiment, after injecting the ChR2-EYFP expressing virus into the MPOA, 50 nl red Retrobeads (Lumafluor) were injected into the NAc (AP: 1.54 mm, ML: 0.325 mm, DV: 4.6 mm). Stereotactic coordinates for targeting the MPOA, VTA NAc were determined based on a three dimensional fMRI mouse atlas (Chan et al., 2007).
Behavioral annotation and tracking
Animal behaviors in all experiments were video recorded from both the side and top of the cage using two synchronized cameras (Basler, acA640-100gm) and a commercial video acquisition software (StreamPix 5, Norpix) in a semi-dark room with infrared illumination at a frame rate of 25 frames/s. Manual behavioral annotation was performed on a frame-by-frame basis using custom software written in MATLAB (http://vision.ucsd.edu/~pdollar/toolbox/doc/index.html)(Burgos-Artizzu et al., 2012; Lin et al., 2011). Tracking was done using a custom written software in Matlab (Burgos-Artizzu et al., 2012). Pup approach was defined as the first step towards the pup from the point farthest away from the pup. Pup sniffing was defined as close contact to any parts of the body of the pup by the frontal end of the female. Pup grooming was defined as close female and pup interaction that is accompanied by rhythmic up and down head movement of the female and displacement of the pup. Pup retrieval was defined as the moment the female opened her jaw or made clear contact with the pup to the moment when the pup was dropped in or around the nest. Crouching over was defined as female situated herself quietly on top of the pups with no obvious movement of any body parts. Nest building was defined as orally collecting the nesting material. Object sniffing was defined as nose contact with any part of an object. In the optogenetic experiment, the onset of walk-out was defined as the first step landed outside of the boundary of the home base or nesting area. Most behavioral annotation was not done blindly. For a subset of videos, we compared the annotations done by an annotator blind to the experimental conditions and one that was not and found high consistency (>90%).
hM4Di mediated neural silencing
To silence Esr1+ population, we injected 200 nl of AAV1-Ef1α-DIO-hM4Di-mCherry bilaterally into the MPOA of Esr1-2A-Cre mice. Control animals were of the same genetic background and were injected with 200 nl/side AAV1-hSyn-DIO-mCherry or AAV2 CAG-Flex-GFP. One group of females were paired with males one week after surgery until the female became visibly pregnant and tested between postpartum day 2 and 7. The other group of spontaneous retrieving virgin females was tested three weeks after surgery. On the day before the testing, all virgin females were screened for their spontaneous retrieval behavior in her home cage. Only females that retrieved all five pups within 10 minutes were used for subsequent testing. Mice were intraperitoneally injected with saline or CNO (1 mg/kg, Sigma, C0832) on interleaved days. For lactating females, all pups except one were removed from the cage immediately after the CNO or saline injection. During testing, we introduced five pups into the female’s home cage distant from the nest and observed the female and pup interaction for 10 minutes.
We also tested lactating animals in the large arena from postpartum day 2 to day 7, mice were intraperitoneally injected with saline or CNO on interleaved days. Ten minutes later, we introduced the female into the test arena (L × W × H: 60 cm × 60 cm × 30 cm) with a home base composed of a piece of paper towel, nesting material, several food pellets, and a pup in one corner. After 20 minutes of free exploration, the female settled down in the home base and then a pup was introduced. If the pup was not retrieved in 2 minutes after its introduction, it would be removed and a new pup would be introduced to start a new trial 20 seconds later. At least 6 trials were tested on each day.
For behavioral analysis, all animals with minimally 10% of Esr1+ cells expressing hM4Di-mCherry were included. To compare the retrieval performance after CNO and saline injections, for each animal, data from all CNO injected days were combined whereas data from all saline injected days were combined given that no significant differences in behaviors were found across CNO days or across saline days. The latency to retrieve will be considered as 600 seconds if the animal failed to retrieve the pup within the 10 minutes testing period.
ChR2 mediated cell activation
Two to three weeks after viral injection, we evaluated the spontaneous maternal behaviors of each animal by scattering 5 pups (<10 days old) in the home cage of the female for 5 minutes and recorded the number of pups that were retrieved back to the nest. The test was done on two separate days with three to four days in between when the females are in estrus. The estrous status of the female was determined prior to test based on vaginal smear. Immediately after the second preliminary maternal test, we tested the light stimulation evoked behavioral change for females that did not retrieve spontaneously in their home cage. We inserted and secured two 230 µm multimode optic fibers (Thorlabs, TS1450308) through the implanted cannula to deliver the light. The ends of the optic fiber were flush with the cannula ends. During the test, five pups were introduced into the home cage of the female and 5 to 10 minutes later, we unilaterally delivered 0.5 – 3 mW, 20 Hz, 20 ms 473 nm light stimulation for 60 seconds at random time points. At least 60 seconds were allowed between stimulation trials. The light intensity started at 0.5 mW and increased incrementally until obvious behavioral changes were induced or reaching 3 mW. Once the final stimulation intensity was determined, 10 stimulation trials were presented. During testing, if all 5 pups were retrieved, they were removed and reintroduced 30 seconds later. After completing the stimulation, we tested the spontaneous retrieval behavior again by scattering 5 pups in the home cage of the female for 5 minutes.
For animals that showed spontaneous pup retrieval in the home cage during the preliminary test, we tested the simulation induced behavioral change in a large area identical to the one described in the hM4Di experiment. After the female acclimated to the arena for approximately 20 min and settled down in the home base, we introduced a pup into the farthest corner away from the female and started the real or sham stimulation (real: 0.5–3 mW, 20Hz, 20ms; sham: 0mW) immediately afterwards. The stimulation lasted for either 60 s or terminated as soon as the pup was retrieved back to the home base, whichever happened first. If the pup was not retrieved, it was removed and reintroduced to start a new trial. At least 6 real stimulation trials were performed on a testing day. For the frequency variation test, we varied the stimulation frequency from 0Hz, 1Hz, 5Hz, 10Hz to 20Hz, each for 3–6 trials and examined the induced behavioral change. For a subset of animals, we also tested the stimulation evoked behavioral change towards a pup-size object (a 1/2 inch set screw). During test, the screw was introduced into the large arena at the similar location as that in the pup test.
For VTA terminal stimulation, two 230µm optic fibers were inserted through the implanted bilateral cannula and the fiber tips were 500 µm above the VTA. For MPOA stimulation with VTA inhibition, we injected either 0.3 µL saline or 4% burpivacaine (Sigma) into the VTA using a 0.5-µL Hamilton syringe (part no. 7000.5) through the implanted cannulae when the animals were lightly anaesthetized with 2% isoflurance and tested the animals 15 minutes after injection. During the test, the female was introduced into the large test arena. After the female acclimated to the arena for approximately 20 minutes and settled down in the home base, we introduced a pup distant from the home base and started the real or sham stimulation (real: 0.5–3 mW, 20 Hz, 20 ms; sham: 0 mW) immediately afterwards. The stimulation lasted for either 60 seconds or less, if the pup was retrieved back to the home base sooner. If the pup was not retrieved, it was removed and reintroduced to start a new trial. At least 6 stimulation and 6 sham trials were performed on a testing day.
The latency to walk out was defined as the time elapsed from the light onset to the first step out of the nest or the home base. The latency to encounter was defined as the time elapsed from the moment of walking out of the home base to the moment of encountering the pup. Only trials during which the female walked out of the home base were used for calculating the latency to encounter.
To confirm the efficacy of ChR2 stimulation induced neural activation, one and a half hours before euthanizing the animals, unilateral blue light was delivered through the optic fiber when the animal was alone in its home cage. The light intensity was the same as that optimized for eliciting retrieval on previous testing days (20 ms, 20 Hz, 1–2 mW, 10 times, 20 seconds on and 40 seconds off). The neural activation was then assessed by c-Fos staining.
Fiber photometry
For fiber photometry recording of Esr1+ cells, 5 mice were injected with AAV1-CAG-Flex-GCaMP6f and 4 animals were injected with AAV1-CAG-Flex-GCaMP6s. We switched the virus due to variable viral expression when using different batches of AAV1-CAG-Flex-GCaMP6f. This problem has now been solved by optimizing the final titer for each batch through dilution. GCaMP6f and GCaMP6s signal changes during maternal behaviors were qualitatively similar and thus were combined for final analysis. For recording the Esr1− cells, we injected 5 mice with AAV2-EF1α-loxP-GCaMP6f-loxP-WPRE. Three of those mice were recording during both virgin and lactating stages. For recording MPOA Esr1+ cells that project to VTA, we injected 6 virgin Esr1-2A-Cre mice with HSV hEF1α-LSL-GCaMP6f into the VTA but only 3 mice showed GCaMP6f expression in the MPOA and retrieval behaviors. For recording VTA dopaminergic cells, we injected 6 virgin DAT-ires-Cre mice with AAV1-CAG-Flex-GCaMP6f into the VTA and 4 mice showed retrieval behavior and proper targeting. Five Esr1-2A-Cre mice were injected with AAV2 CAG-Flex-GFP at MPOA as a control.
The fiber photometry setup was constructed following basic specifications previously described (Falkner et al., 2016; Hashikawa et al., 2017). Briefly, a 390-Hz sinusoidal blue LED light (30 µW) (LED light: M470F1; LED driver: LEDD1B; both from Thorlabs) were bandpass filtered (passing band: 472 ± 15 nm, FF02-472/30-25, Semrock) and delivered to the brain to excite GCaMP6s or GCaMP6f. The emission lights traveling back through the same optic fiber, bandpass filtered (passing bands: 535 ± 25 nm, FF01-535/505, Semrock), passing through an adjustable zooming lens (Thorlab, SM1NR01 and Edmund optics, #62-561), detected by a Femtowatt Silicon Photoreceiver (Newport, 2151) and recorded using a real-time processor (RP2, TDT). The envelope of the 390-Hz signals reflected the intensity of the GCaMP and was extracted in real time using a custom TDT program. The signal was low pass filtered with a cut-off frequency of 5 Hz.
During recording, the baseline fluorescence was set around 1 (arbitrary unit) for all animals by adjusting the zooming lens attached to the photoreceiver. The animal was first alone in her cage for approximately 10 minutes. Then, a pup was introduced into the home cage at a location distant from the nest. If the female retrieved the pup back to the nest or completely ignored the pup, the pup was then gently removed and a different pup was introduced 30–60 seconds later to encourage more active interaction. This procedure was repeated for 6–10 times and then the female was allowed to interact freely with the last introduced pup for 30 minutes without any disturbance. After the pup session, we sequentially introduced an adult Balb/C male mouse, an adult C57BL/6 female mouse and an object (15 ml plastic tube) into the cage of the recorded female mouse, each for 10 minutes.
To analyze the recording data, the Matlab function “msbackadj” with a moving window of 25% of the total recording duration was first applied to obtain the instantaneous baseline signal. The instantaneous ΔF/F was calculated as (Fraw −Fbaseline)/Fbaseline. For each recording session, the acute response during a behavior was calculated as the average ΔF/F during the behavior minus the average ΔF/F in the duration-matched period prior to the behavior onset. The average response of all the episodes of a behavior for each animal was then calculated for population analysis. The Z-score normalized ΔF/F was calculated as (ΔF/F − mean(ΔF/Fbefore))/std(ΔF/Fbefore). ΔF/Fbefore refers to the ΔF/F signal during the 10-mintues period before pup introduction. The peri-event histogram (PETH) of a given behavior was constructed by aligning the ΔF/F signal of each trial to the onset or offset of the behavior. To determine the peaks of GCaMP6 signal, we first identified local maximum and minimum and then calculated the difference between each maximum and its preceding minimum as the size of each peak. Peaks with magnitude above 33.3% of the maximum peak size were included in the peak frequency analysis.
In vivo electrophysiological recordings
The recording electrode was composed of sixteen 13-µm tungsten microwires fitted through a 26G stainless steel tube. The optrode was composed of the same wire bundle and a 100 µm multimode optic fiber (Thorlab). The fiber was etched at its tip with hydrofluoric acid. On recording days, the electrode or optrode was connected to a chronic headstage through an omnetics nano-connector. The headstage was then connected to a torqueless, feedback-controlled commutator (TDT), which was further connected to a 16-channel preamplifier (TDT, RA16PA). Signals from electrodes were band-pass filtered from 300 Hz to 3000 Hz. Each video frame acquisition was triggered by a TTL pulse from the recording setup to ensure synchronization between the video and the electrophysiological recording.
Before recording, pups, if any, were removed. During recording, the female was first left alone in the cage for 3–5 minutes, then a pup (<10 days) was introduced into the cage away from the female. If the female retrieved the pup, the pup was then gently removed and a different pup was introduced 10–30 seconds later. Each pup recording session lasted for 10–20 minutes. After the pup session, an adult Balb/C male and then a C57BL/6 female intruder was introduced into the cage sequentially, each for approximately 10 minutes with 3 minutes in between. After each day of recording, the electrode bundle was advanced by 40 µm. For animals that went through multiple reproductive stages, the electrode was advanced for approximately 8 times when the female was under virgin state. Then, the electrode was retracted and the female was paired with an adult male until she was visibly pregnant. From postpartum Day 1, the recording resumed until postpartum Day 10 when the pups were removed. Seven days after pup removal, we recorded for additional 6 sessions. Histological analyses were performed on all animals to verify the locations of the electrodes. Only animals with the successful targeting of the MPOA were included in the final analysis. The estrous status of the animal was not monitored in this experiment.
Spike sorting was performed using Offline Sorter (Plexon). Individual units recorded from the same electrode were isolated using principal component analysis. Three criteria were imposed for identifying single units. 1) Signal to noise ratio was above 3; 2) The waveform of the spikes was stable in the entire recording session; 3) Spikes with inter-spike intervals below 3 ms were no more than 0.1 %. Only units meeting all three criteria were included in the final analysis.
To calculate the average firing rate of a cell during a behavior, we divided the number of spikes occurred during a specific behavior to the total duration of the behavior. To investigate the acute responses of a cell during a behavior, we construct the PETH (±5s window, 250-ms bin) by aligning the spikes to the onset of a behavior. The Z-score normalized PETHs were constructed from the PETHs using the −5 to −2.5 s as the baseline period. The average response during retrieval was obtained by calculating the mean Z score between 0 and 1s of the Z-score normalized PETH. The window for calculating the response of other behaviors was 0– 500 ms. Cells with Z score above 2 in a specific behavior were regarded as excited during the behavior whereas cells with Z score below −2 were considered as inhibited. The onset of the response during a behavior was determined as the earliest time point with a Z value above 2 in the Z-score normalized PETH. The heat maps in Figure 4K were arranged based on the onset of the responses in a descending order. The population PETH was constructed by calculating the mean of the PETHs at each time bin from all relevant cells. Principal components (Figure 4M) were extracted using single variable decomposition of the response matrix shown in Figure 4L. The association between responses during pairs of behaviors was measured using Pearson product-moment correlation using all the cells that contain data for both behaviors.
Before behavioral testing, 1-ms or 2-ms blue light (4–5 mW) that was controlled by a mechanic shutter (Uniblitz, LS3T2) was delivered through the optrode. Cells that met the following criteria are regarded at a direct light-excited cell. (1) The unit meets the criteria as a single unit; (2) The 1-ms or 2-ms light pulse can evoke spiking in at least 10% of the trials within 15 ms of the light onset; (3) The evoked spike has an average latency below 8 ms; (3) The evoked spike has a jitter below 1ms; All direct light-excited cells were also excited by 1-s light delivery, but some cells that were excited by 1-s light did not respond during 1-ms or 2-ms light pulses and were considered as not directly light-excited. The light-evoked responses were tested both at the beginning and the end of a daily recording session. Only cells that showed responses in both tests were considered as light-excited cells. The light evoked spiking and the spontaneous spiking were sorted independently and the waveforms were compared using Pearson product-moment cross correlation. If the waveforms of the evoked spikes and the spontaneous spikes were the same (correlation coefficient >0.9), the cell recorded during the behavioral tests was regarded as light-excited, or in other words, Esr1+.
In vitro electrophysiological recordings
Acute horizontal brain slices of VTA (275 µm in thickness) were obtained using standard methods. Mice were anesthetized by isoflurane inhalation and perfused with ice-cold artificial cerebrospinal fluid (ACSF) containing (in mM) 125 NaCl, 2.5 KCl, 25 NaHCO3, 2 CaCl2, 1 MgCl2, 1.25 NaH2PO4 and 11 glucose (295 mOsm•kg−1). Slices were obtained in cold choline-based cutting solution (consisting of (in mM): 110 choline chloride, 25 NaHCO3, 2.5 KCl, 7 MgCl2, 0.5 CaCl2, 1.25 NaH2PO4, 25 glucose, 11.6 ascorbic acid, and 3.1 pyruvic acid) using a Leica VT1200s vibratome, transferred for 10–20 min to a holding chamber containing oxygenated ACSF at 34°C and subs equently maintained at room temperature until use. Individual slices were transferred to a recording chamber mounted on an upright microscope (SliceScope Pro 1000; Scientifica) and continuously superfused with ACSF warmed to 32–34°C (SH-27B; Warner Instruments). Cells were visualized through an Olympus 40× water-immersion objective with infrared differential interference contrast optics and epifluorescence to identify retrobead-labeled neurons within VTA lying in close proximity to ChR2-EYFP+ axons originating in MPOA Esr1+. Whole-cell voltage-clamp recordings were made from putative dopaminergic (bead+) and non-dopaminergic (bead−) neurons with borosilicate glass pipettes (G150F-3, Warner Instruments) filled with (in mM) 135 CsMeSO3, 10 HEPES, 1 EGTA, 3.3 QX-314 (Cl− salt), 4 Mg-ATP, 0.3 Na-GTP, 8 Na2-Phosphocreatine (pH 7.3 adjusted with CsOH; 295 mOsm•kg−1). Dopaminergic neurons were further distinguished from neighboring non-dopaminergic cells while in cell-attached mode prior to break-in based on their characteristically long spontaneous action potential waveform (dopaminergic: 1.8 +/− 0.2 ms [range: 1.4–3.2 ms]; non-dopaminergic: 1.0 +/− 0.1 ms [range: 0.7–1.3 ms]; p = 0.002)(Chieng et al., 2011). To activate ChR2-expressing axons, brief pulses of full field illumination (1 ms duration; 10 mW•mm−2 under the objective) were delivered onto the recorded cell at 30 s intervals using light from a blue LED (pE-300 white; CoolLED). Membrane currents were amplified and low-pass filtered at 3 kHz using a Multiclamp 700B amplifier (Molecular Devices), digitized at 10 kHz and acquired using National Instruments acquisition boards and a custom version of ScanImage written in MATLAB (Mathworks). Detection thresholds for IPSCs and EPSCs were set at 10 pA.
Tracing
To investigate downstream targets of MPOAEsr1+ cells, 180 nl of AAV2-EF1α-DIO-ChR2-EYFP (6.8 × 10¹² vg/ml) was stereotactically injected unilaterally into the MPOA of virgin Esr1-2A-Cre females (2–5 months). Six weeks after injection, animals were killed for histological analysis. To label MPOA neurons that project to DMH, VMHvl or VTA, the retrograde tracer cholera toxin subunit B conjugated to Alexa Fluor 555 (CTB-555, 1 mg/ml, ThermoFisher) was injected unilaterally into DMH (AP: −1.58 mm, ML: 0.35 mm, DV: −5.25 mm; 200 nl in each site), VMHvl (AP: −1.7 mm, ML: 0.74 mm,, DV: −5.6 mm; 200 nl in each site) or VTA (AP: −3.28 mm, ML: 0.5 mm,, DV: −4.4 mm; 200 nl in each site). Ten days after surgery, animals were sacrificed for histological analysis, which included Esr1 and DAPI staining. To label the MPOA Esr1+ cells that project to the VTA, 140 nl of the HSV hEF1α-LSL-mCherry-ires-flpoHT was injected into the VTA and 200 nl of AAV5 hSyn-Con/Fon-EYFP was injected into the MPOA of Esr1-2A-Cre virgin female mice. Three weeks after viral incubation, animals were sacrificed for histological analysis, which included EYFP and DAPI staining.
Immunohistochemistry and image analysis
For detection of c-Fos, viral expression and optrode location, frozen sections were prepared. Animals were deeply anesthetized with a mixture of ketamine (100 mg/kg) and xylazine (10 mg/kg) and transcardially perfused with 20 ml of PBS, followed by 20 ml of 4% paraformaldehyde (PFA, Sigma) in PBS. After perfusion, brains were harvested, soaked in 20 % of sucrose in PBS for 24 hours at 4°C and then embedded with O.C.T compound (Fisher Healthcare). 30 µm thick coronal brain sections were cut using a cryostat (Leica). Brain sections were washed with PBS (1×10 minutes) and PBST (0.1 % Triton X-100 in PBS, 1×10 minutes), blocked in 10 % normal donkey serum (NDS) in PBST for 30 minutes at room temperature (RT), and then incubated with primary antibodies in 1% NDS in PBST overnight at 4°C. Sections were then washed with PBST (3×5 minutes), incubated with secondary antibodies in 1 % NDS in PBST for 2 h at room temperature, washed with PBST (2×10 minutes), counterstained with DAPI (Sigma), and finally washed again with PBS (2×10 minutes). Slides were coverslipped using mounting medium (VECTASHIELD, H1000).
For detecting Esr1, EYFP or TH, fresh floating sections were prepared. Animals were deeply anesthetized with a mixture of ketamine (100 mg/kg) and xylazine (10 mg/kg) and transcardially perfused with 20 ml of PBS, followed by 40 ml of 4% PFA. Brains were post-fixed for 1–2 h in 4% PFA and transferred to PBS with 0.05 % sodium azide (Sigma) at 4°C until sectioning. 40–60 µm thick coronal sections were obtained using a vibratome (Leica, VT1200). Sections were stored in PBS with 0.05 % sodium azide at 4°C until use. Sections were washed with PBS (3×5 minutes) and then blocked in 10 % NDS in PBST (0.3 % Triton) for 2 h at room temperature, followed by incubation with primary antibodies in 10 % NDS in PBST (0.3 % Triton) for 72 h at 4°C. Sections were washed with PBST (0.3 % triton, 3×30 minutes), incubated with secondary antibodies in 10 % NDS in PBST (0.3 % Triton) and NeuroTrace 435/455 Blue Fluorescent Nissl Stain (Life Technologies, 1:200) for 2 h at room temperature, washed with PBST (2×15 minutes) and PBS (2×15 minutes), mounted on slides and coverslipped with mounting medium.
The primary antibodies used were: rabbit anti-Esr1 (1:500, Santa Cruz, sc-542, Lot #F1715. Unspecific staining was occasionally observed using other lots.)(Lee et al., 2014), goat anti-c-Fos (1:200, Santa Cruz, sc52-g)(Lin et al., 2011), sheep anti-TH (1:500, Pel Freeze), rabbit anit-GFP (1:1000,Life Technologies). The secondary antibodies used were: donkey anti-rabbit Dylight 488 (1:300, Jackson Immunoresearch), donkey anti-rabbit Alexa Fluor 546 (1:500, Life Technologies) and donkey anti-goat Dylight 647 antibodies (1:300, Jackson Immunoresearch), donkey anti-sheep Dylight 649 (1:500, Jackson Immunoresearch), Nissl 435/455 (1:200, Life Technologies) and DAPI (1:20,000, Life Technologies).
The 2.5× or 5× fluorescent images were acquired to determine the overall viral expression pattern and cannula, optic fiber, and optrode placements. For counting hM4Di-mCherry, Fos and Esr1 cells, 20× fluorescent confocal images were acquired. For examining the projection patterns of MPOA Esr1+ to VTA projectors, whole brain images were taken at 10× using a virtual slide fluorescent microscope (Olympus, VS120). For each brain, all the images were taken with the exact same settings.
To analyze the density of the projection, a small boxed area was selected in each region of interest and the average pixel intensity was calculated as Fraw. The sizes of the selected boxes are: 220×220µm (LSv), 120×120µm (PVN), 420×80µm (Pv), 120×120µm (ARC), 100×100µm (PvP), 250×250µm (RCh), 170×170µm (LHA), 250×250µm (DMH), 150×150µm (VMHvl), 170×170µm (Tu), 170×170µm (PMv), 190×400µm (SUM), 330×200µm (VTA), 220×220µm (aPAG) and 220×220µm (pPAG). On the same image, a boxed area of the same size but in a brain region containing no fiber terminals was selected for calculating the background intensity (Fbackground). Fsignal was calculated as Fraw minus Fbackground. For each animal, Fsignal was normalized by the maximum Fsignal across all the analyzed regions. The normalized Fsignal was then used for calculating the average terminal field intensity across animals.
QUANTIFICATION AND STATISTICAL ANALYSIS
Statistics
Comparisons between two groups were performed by unpaired or paired t-test. Comparisons among 3 or more groups of different animals were performed first using one way ANOVA. Comparisons among 3 or more groups of the same set of animals were performed first using one way ANOVA with repeated measures. Two way ANOVA was used to compare multiple groups under multiple testing conditions. All significant statistical results were indicated on the figures following the conventions: *p < 0.05, **p < 0.01, ***p < 0.001. Error bars represent ± SEM.
Figure 1D: Paired t-test. Latency to retrieve first pup: p = 0.041 (virgin) and 0.019 (lactating); Latency to retrieve all pups: 0.003 (virgin) and 5.22 × 10⁻⁴ (lactating). N = 7 virgin animals and 10 lactating animals.
Figure 1E: Paired t-test. p = 0.015 (virgin) and 0.005 (lactating). N = 7 for virgin animals and 10 for lactating animals.
Figure 1F: Paired t-test. Virgin: p = 0.45 (investigation), 0.376 (grooming) and 0.821 (crouching over). Lactating: 0.087 (investigation), 0.338 (grooming) and 0.295 (crouching over). N = 7 virgin animals and 10 lactating animals.
Figure 1G: Paired t-test. Latency to retrieve the first pup: p = 0.743 (virgin) and 0.568 (lactating); Latency to retrieve all pups: 0.346 (virgin) and 0.479 (lactating). N = 5 virgin animals and 6 lactating animals.
Figure 1H: Paired t-test. p = NaN (virgin) and NaN (lactating). N = 5 virgin animals and 6 lactating animals.
Figure 1I: Paired t-test. Virgin: p = 0.220 (investigation), 0.357 (groom) and 0.152 (crouching); Lactating: p = 0.158 (investigation), 0.290 (grooming) and 0.423 (crouching). N = 5 virgin animals and 6 lactating animals.
Figure 1M: Paired t-test. p = 0.008; N = 9 animals.
Figure 1N: Paired t-test. p = 0.009; N = 9 animals.
Figure 1O: Paired t-test. p = 0.105; N = 9 animals.
Figure 1P: Paired t-test. p = 0.118; N = 9 animals.
Figure 1Q: Paired t-test. p = 3.3 × 10⁻⁶ ; N = 9 animals.
Figure 1R: Paired t-test. p = 0.374; N = 5 animals.
Figure 1S: Paired t-test. p = 0.375; N = 5 animals.
Figure 1T: Paired t-test. p = 0.100; N = 5 animals.
Figure 2E: (1) Two way ANOVA. H0: the probability of retrieval does not differ between the test and control groups (factor A). F(1, 46) = 6.95, p = 0.01; H0: the probability of retrieval does not differ between before and during light stimulation (factor B). F(1, 46) = 3.53, p = 0.07; H0: there is no interaction between factor A and B. F(1, 46) = 3.53, p = 0.07. (2) Student t-test. H0: no change in the probability of retrieval before and after the light onset. Paired t-test. Control group: p = NaN; N = 7 animals. Test group: p = 0.006; N = 18 animals.
Figure 2F: (1) Two way ANOVA. H0: the probability of the behavior does not differ between the test and control groups (factor A). Grooming: F(1, 46) = 2.16, p = 0.15; Sniffing: F(1, 46) = 0.03, p = 0.86; Crouching over: F(1, 46) = 3.81, p = 0.06. H0: the probability of the behavior does not differ between before and during light stimulation (factor B). Grooming: F(1, 46) = 0.06, p = 0.81; Sniffing: F(1, 46) = 0.01, p = 0.94; Crouching: F(1, 46) = 0.83, p = 0.37. There is no interaction between factor A and B. Grooming: F(1, 46) = 0.76, p = 0.39. Sniffing: F(1, 46) = 4.87, p = 0.03. Crouching: F(1, 46) = 0.25, p = 0.62. (2) Student t-test for individual groups. H0: no change in the time spent during the behavior before and after the light onset. Sniffing: p = 0.127 (control) and 0.009 (test). Grooming: p = 0.116 (control) and 0.538 (test). Crouching: p = 0.356 (control) and 0.180 (test).
Figure 2I: Paired t-test. p = 0.704 (control) and 4.09 × 10⁻⁸ (test). N = 5 animals for control group and 12 animals for test group.
Figure 2J: Paired t-test. p = 0.704 (control) and 8.25 × 10⁻⁸ (test). N = 5 animals for control group and 12 animals for test group.
Figure 2K: Paired t-test. p = 0.667 (control) and 0.038 (test). N = 2 for control group, and N = 5 for test group. Only animals with at least 2 walk-out trials during sham stimulation and 2 walk-out trials during real stimulation are included.
Figure 2N: Paired t-test. p = 0.004; N = 7 animals.
Figure 2O: Paired t-test. p = 0.045; N = 7 animals.
Figure 2P: Paired t-test. p = 0.243; N = 7 animals.
Figure 3C: Paired t-test. H0: the peak frequency does not differ between groups. Naïve group: t(6)= 3.865, p = 0.0083; Lactating group: t(6) = 7.3983, p = 0.0003.
Figure 3G: (1) One way ANOVA. H0: the signal change does not differ among groups. F(6, 119) = 31.21, p = 2.65 × 10⁻²² (2) Student t-test for individual groups. H0: no change in signal during the behavior. P values for object sniffing = 0.976; nest building = 0.002; crouch over pups = 0.075; pup grooming = 0.025; pup sniffing = 0.248; pup approach = 0.019, and pup retrieval = 9.40 × 10⁻⁸. n = 9–38 behavioral events.
Figure 3I: (1) One way ANOVA. H0: the signal change does not differ among groups. F(6, 48) = 22.90, p = 1.50 × 10⁻¹². (1) Student t-test for individual groups. H0: no change in signal during the behavior. P values for object sniffing = 0.602; nest building = 0.054; crouch over pups = 0.004; pup grooming = 0.294; pup sniffing = 0.257; pup approach = 0.002, and pup retrieval = 1.74 × 10⁻⁵. n = 8–12 behavioral events.
Figure 3J: One way ANOVA. H0: no difference in response of during the behavior. F(6, 29) = 13.44, p = 3.05 × 10⁻⁷. Student t-test. H0: no change in signal during the behavior. P values for object sniffing = 0.681; nest building = 0.072; crouch over pups = 0.029; pup grooming = 0.324; pup sniffing = 0.027; pup approach = 0.019, and pup retrieval = 0.008. n = 4–7 animals. Lactating group: One way ANOVA. F(6, 36) = 13.96, p = 3.90 × 10⁻⁸. Student t-test. P values for object sniffing = 0.349; nest building = 0.039; crouch over pups = 0.032; pup grooming = 0.592; pup sniffing = 0.002; pup approach = 0.003, and pup retrieval = 0.0006. n = 3–7 animals.
Figure 3K: Paired t-test. P values between naïve and lactating states for pup sniffing: 0.325; pup grooming: 0.805; pup approach: 0.015; pup retrieval: 0.045; n = 3–5 animals.
Figure 3L: Paired t-test. p = 0.6264. n =5 animals.
Figure 4C: One way ANOVA. p = 0.0449, F(2,296) = 3.14; Unpaired t test, virgin vs lactating: p = 0.016; t (216) = 2.42; lactating vs. post-lactation: p = 0.028; t(171) = 2.213; virgin vs. post-lactation p = 0.79, t (205) = −0.26
Figure 4D: Pearson moment-product cross-correlation. All cells: R = −0.33, p = 3.89 × 10⁻⁹, n = 299 cells; virgin only: R = −0.36, p = 3.8 × 10⁻⁵, n =126 cells; lactating only: R = −0.34, p = 0.0009; n = 92 cells; post-lactation: R = −0.31, p = 0.005, n = 81 cells.
Figure 4E: One way ANOVA. Virgin: p = 0.753, F(2, 115) = 1.40; Lactating: p = 0.0027, F(2, 91) = 6.1; post-lactation: p = 0.805 F(2,80) = 0.22.
Figure 4F: Chi-square test: Chi-square = 17.54, df = 4, p =0.0015. Fisher’s exact 2 × 3 test for distribution of excited cells across reproductive states: p = 0.0017; for distribution of inhibited cells across reproductive states: p = 0.475.
Figure 4I: One way ANOVA: F(5, 162) = 4.19, p = 0.0013.
Figure 4J: One way ANOVA for each time bin. Red dots: p< 0.05; black dots: p< 0.1. Insets: Fisher’s exact 2 × 3 test. Approach: p = 0.026; Retrieval: p = 0.107; Sniff pup: p = 0.001.
Figure 5F: Fisher’s exact test. p values for retrieval: 0.009; approach: 0.016; sniff: 0.33; groom: 1.00; crouching: 1.00 ; nest building: 1.00.
Figure 6D: Fisher’s exact test. Sniff male: p = 0.32; Sniff female: p = 0.20.
Figure 6E–6G: Pearson’s cross-correlation. Sniff pup vs. Sniff male: r = −0.0028, p = 0.97, n =221; Sniff male vs. Sniff female: r = 0.39, p = 1.55 × 10⁻⁹, n = 221; Sniff pup vs. Sniff female: r 0.27, p = 5.03 × 10⁻⁵, n =221.
Figure 7F: One way ANOVA with repeated measures. p = 0.009, F(5, 3) = 4.68. n = 4 animals. Student t-test. Nest building: t(2) = 1.90, p = 0.197; Crouch: t(2) = −0.562, p =0.630; Groom: t(3) = 1.74, p = 0.181; Sniff: t(3) = 1.47, p = 0.147; Approach: t(3) = 1.88, p = 0.156; Retrieval: t(3) = 4.19, p = 0.025.
Figure 7I: Unpaired t test. t(8) = 5.01, p =0.001.
Figure 7J: One Way ANOVA with repeated measures. F(5, 3) = 0.74. p = 0.604.
Figure 8C: DA neuron, IPSC vs EPSC: Chi-square = 0.475, p = 0.4906; non-DA neuron: IPSC vs EPSC: Chi-square = 5.000, p = 0.0253; IPSC in DA vs non-DA neurons: Chi-square = 8.123, p = 0.0044.
Figure 8D: DA neuron, IPSC vs EPSC: t(10) = 1.107, p = 0.2943; non-DA neuron: IPSC vs EPSC: t(10) = 1.082, p = 0.3045; IPSC in DA vs non-DA neurons: t(13) = 1.708, p = 0.1096.
Figure 8G: Paired t-test. p = 3.46 × 10⁻⁷; N = 8 animals.
Figure 8H: Paired t-test. p = 3.46 × 10⁻⁷; N = 8 animals.
Figure 8I: Paired t-test. p = 0.058; N = 2 animals.
Figure 8K: (1) Two way ANOVA. There is no main effect for drug, F(1,26)=0.05, p= 0.8321. There is a main effect for light stimulation, F(1,26)=54.69, p=0. There is no interaction between the drug and light, F(1,26)=2.47, p=0.1284. (2) Paired t-test. p = 0.166 (sham trials) and 0.363 (light trials). N = 6 animals for both sham and light comparison.
Figure 8L: (1) Two way ANOVA. The main effect for drug is F(1,15)=NaN, p=NaN. The main effect for light stimulation is F(1,15)=NaN, p=NaN. The interaction between the drug and light is F(1,15)=NaN, p=NaN. (2) Paired t-test. p = NaN (sham trials) and NaN (light trials). N = 2 animals for sham trial comparison and 6 for light trial comparison.
Figure 8M: (1) Two way ANOVA. There is no main effect for drug, F(1,15)=3.05, p=0.1012. There is no main effect for light stimulation, F(1,15)=0.97, p=0.3405. There is no interaction between the drug and light, F(1,15)=0.04, p=0.851. (2) Paired t-test. p = 0.568 (sham trials) and 0.015 (light trials). N = 2 animals for sham trial comparison and 6 for light trial comparison.
Figure 8N: (1) Two way ANOVA. There is main effect for drug, F(1,24)=115.86, p=1.15 × 10⁻¹⁰. There is a main effect for light stimulation, F(1,24)=185.15, p=8.88 × 10⁻¹³. There is an interaction between the drug and light, F(1,24)=103.11, p=3.64 × 10⁻¹⁰. (2) Paired t-test. p = 0.112 (sham trials) and 1.89 × 10⁻⁵ (light trials). N = 6 animals for both sham and light comparison.
Figure S2B: One way ANOVA. H0: the probability to retrieve does not differ among groups. F(4, 60) = 28.71, p = 2.41 × 10⁻¹³. P values from paired t-test. 0Hz vs. 1Hz: 1.71 × 10⁻³; 0Hz vs. 5Hz: 6.45 × 10⁻⁷; 0Hz vs. 10Hz: 1.64 × 10⁻⁹; 0Hz vs. 20Hz: 5.88 × 10⁻¹¹; 1Hz vs. 5Hz: 8.83 × 10⁻⁴; 1Hz vs. 10Hz: 2.03 × 10⁻⁴ ; 1Hz vs. 20Hz: 8.83 × 10⁻⁴ ; 5Hz vs. 10Hz: 0.097; 5Hz vs. 20Hz: 0.45; 10Hz vs. 20Hz: 0.26.
Figure S2C: One way ANOVA. H0: the latency to retrieve does not differ among groups. F(4, 49) = 8.85, p = 1.86 × 10⁻⁵. P values from paired t-test. 0Hz vs. 1Hz: 4.39 × 10⁻³; 0Hz vs. 5Hz: 1.48 × 10⁻⁶ ; 0Hz vs. 10Hz: 8.25 × 10⁻⁶; 0Hz vs. 20Hz: 1.48 × 10⁻⁶ ; 1Hz vs. 5Hz: 0.29; 1Hz vs. 10Hz: 0.02; 1Hz vs. 20Hz: 0.03; 5Hz vs. 10Hz: 0.0034; 5Hz vs. 20Hz: 0.01; 10Hz vs. 20Hz: 0.95. N = 13 sites from 7 animals.
Figure S2F: Paired t-test. p value from left to right plots: 1.23 × 10⁻¹⁰, 7.88 × 10⁻⁶, 0.016 and 0.19. n = 14 sites from 8 animals for left 3 plots and n = 2 sites from 1 animal in the rightmost plot.
Figure S2I: Paired t-test. % trials walked out: p = 0.001. N = 3 animals.
Figure S2J: Paired t-test. % trials retrieved: p = 0.001. N = 3 animals.
Figure S2M: Paired t-test. p = 0.034; N = 3 animals.
Figure S2N: Paired t-test. p = 0.073; N = 3 animals.
Figure S2O: Paired t-test. p = 0.469; N = 2 animals.
Figure S3E: Student t-test. Approach: p =0.249, t(4) = 1.35; Sniff: p = 0.052, t(4) =−2.75; Retrieval: p = 0.179, t(2) =2.03.
Figure S4D: One way ANOVA with repeated measures. First trial: F(2,6) = 6.32. p = 0.0134; Second trial: F(2,6) = 15.15, p = 0.0005; Third trial: F(2,6) = 10.61, p = 0.0022. Paired t-test. First trail: pup vs. male: t(6) = −0.885, p = 0.410; pup vs. female: t(6) = 2.71, p = 0.035; male vs. female: t(6) = −2.98, p = 0.025. Second trial: pup vs. male: t(6) = 3.57, p = 0.011; pup vs. female: t(6) = 4.60, p = 0.0037; male vs. female: t(6) = 2.81, p = 0.031.Third trial: pup vs. male: t(6) = 2.56, p =0.043 ; pup vs. female: t(6) = 4.27, p = 0.005 ; male vs. female: t(6) = 2.15, p = 0.075. Figure S4E: One way ANOVA with repeated measures. F (2, 6) = 5.18. p =0.024. Paired t-test: pup vs. male: t(6) = 1.958, p = 0.098; pup vs. female: t(6) = 3.18, p = 0.019; male vs. female: t(6) = −0.337, p =0.747.
Figure S4I: One way ANOVA with repeated measures. First trial: F(2,6) = 5.42. p = 0.021; Second trial: F(2,6) = 5.97, p = 0.016; Third trial: F(2,6) = 10.6, p = 0.0022. Paired t-test. First trail: pup vs. male: t(6) = −1.29, p = 0.245; pup vs. female: t(6) = 1.94, p = 0.097; male vs. female: t(6) = −2.97, p = 0.025. Second trial: pup vs. male: t(6) = 2.15, p = 0.076; pup vs. female: t(6) = 3.35, p = 0.016; male vs. female: t(6) = −1.25, p = 0.257. Third trial: pup vs. male: t(6) = 4.17, p = 0.0156; pup vs. female: t(6) = 4.17, p = 0.0059; male vs. female: t(6) = −1.57, p = 0.169.
Figure S4J: One way ANOVA with repeated measures. F (2, 6) = 13.74. p =.0.0008 Paired t-test: pup vs. male: t(6) = 3.35, p = 0.155; pup vs. female: t(6) = 4.52, p = 0.004; male vs. female: t(6) = −1.381, p = 0.239.
Figure S4L: One way ANOVA with repeated measures. Naïve: F(2, 20) = 6.26, p = 0.0138. Lactating: F(2,20) = 28.21. p = 2.92 × 10⁻⁵. Student t-test. Virgin: pup vs. male: p = 0.037, t(6) = 2.67; pup vs. female: 0.016, t(6) = 3.33; male vs. female: p =0.566, t(6) = 0.61. Lactating: pup vs. male: p = 0.0039, t(6) = 4.54; pup vs. female: p = 0.0009, t(6) = 6.03; male vs. female: p = 0.0023, t(6) = 5.09.
Figure S4M: Paired t-test. Sniff male: t(4) = 0.264, p = 0.805; Sniff female: t(4) = 0.4823, p = 0.655.
Figure S5D: Paired t-test. Virgin: t(4) = 2.41; p = 0.073. Lactating: t(2) = −1.14; p =0.373.
Figure S5G: One way ANOVA. Virgin: F(3,15) = 0.64; p = 0.60; Lactating: F(3,8) = 1.45; p = 0.30.
Figure S6B1–B4: One way ANOVA. Virgin, Esr1+: F(3,51) = 30.44, p = 2.02 × 10⁻¹¹ ; Lactating, Esr1+: F(3,31) = 22.4, p = 6.62 × 10⁻⁸ ; Virgin, Esr1−: t(3,43) = 0.890, p =0.403; Lactating, Esr1−: F(3,37) = 1.03; p = 0.391.
Figure S6C1: One way ANOVA with repeated measures. F(3,21) = 9.89, p = 0.0003. Student t-test: object: t(4) = 0.46, p =0.67; sniff pup: t(6) = 2.76, p = 0.033; approach pup: t(6) = 3.251, p = 0.018; retrieve pup: t(5) = 4.24, p = 0.0082.
Figure S6C2: One way ANOVA with repeated measures. F(3,21) = 12.74, p = 4.87 × 10⁻⁵. Student t-test: object: t(4) = 1.28, p =0.27; sniff pup: t(6) = 6.21, p = 0.0008; approach pup: t(6) = 4.82, p = 0.0029; retrieve pup: t(6) = 5.79, p = 0.0012.
Figure S6C3: One way ANOVA with repeated measures. F(3,15) = 0.69, p = 0.57. Student t-test: object: t(4) = 2.73, p = 0.053; sniff pup: t(4) = 5.02, p = 0.0074; approach pup: t(4) = 1.03, p = 0.360; retrieve pup: t(4) = 5.33, p = 0.013.
Figure S6C4: One way ANOVA with repeated measures. F(3,8) = 2.03, p = 0.19. Student t-test: object: t(2) = 1.28, p = 0.33; sniff pup: t(2) = −0.10, p = 0.93; approach pup: t(2) = 1.94, p = 0.19; retrieve pup: t(2) = −0.88, p = 0.47.
Figure S7A: One way ANOVA: F(5, 46) = 2.36, p = 0.054.
Figure S7B–7F. Pearson’s cross correlation. (b) R =0.56, p = 1.15 × 10⁻¹⁵, n =176; (c) R = 0.69, p = 4.57 × 10⁻²⁴, n =162; (d) R = 034, p = 0.003, n = 107; (e) R = −0.41, p = 1.76 × 10⁻⁴, n =81; (f) R = −0.46, p = 1.08 × 10⁻⁸, n = 138.
Figure S9E: Unpaired t-test. Esr1+/Nissl vs. Esr1+CTB+/CTB+ from DMH: 0.920; Esr1+/Nissl vs. Esr1+CTB+/CTB+ from VTA: 0.016; Esr1+/Nissl vs. Esr1+CTB+/CTB+ from VMH: 0.011. N = 3 animals for each group.
Figure S10C1: One way ANOVA with repeated measures. F(4,15) = 3.57, p = 0.011.
Figure S10C2: One way ANOVA with repeated measures. F(4,15) = 2.06, p = 0.098.
Figure S11E: Student t-test. Groom: t(7) = 2.34, p = 0.052; Sniff: t(12) = 4.14, p = 0.0014; Approach: t(22) = 1.71, p = 0.10; Retrieval: t(5) = 2.79, p = 0.038.
Figure S11G: Student t-test. Crouch: t(3) = 0.077, p = 0.94; Groom: t(3) = 1.13, p = 0.34; Sniff: t(9) = 5.47, p = 3.9 × 10⁻⁴; Approach: t(13) = 2.04, p = 0.062; Retrieval: t(8) = 5.92, p = 5.9 × 10⁻⁴.
Figure S11I: Student t-test. Nest: t(7) = −1.353, p = 022; Crouch: t(6) = −2.071, p = 0084; Groom: t(28) = 1.32, p = 0.197; Sniff: t(4) = 1.77, p = 0.152; Approach: t(11) = 2.87, p = 0.015; Retrieval: t(9) = 3.39, p = 0.008.
Figure S12C: Unpaired t-test for individual groups. Esr1+Vglut2+/Esr1+ vs. Esr1+Vgat+/Esr1+: p = 7.841× 10⁻⁵ ; Esr1+Vglut2+/Vglut2+ vs. Esr1+Vgat+/Vgat+: p = 0.008. N
DATA AND SOFTWARE AVAILABILITY
Raw data and Matlab codes for analysis are available upon request.
Supplementary Material
The lactating female mouse expressing hM4Di-mCherry in the MPOA Esr1+ cells was tested for maternal behaviors in the home cage after either saline or CNO (1mg/kg) injection.
The lactating female mouse expressing hM4Di-mCherry in the MPOA Esr1+ cells was tested for pup approach and retrieval in a large arena after either saline or CNO (1mg/kg) injection.
A virgin female mouse that expressed ChR2-EYFP in the MPOA Esr1+ cells showed immediate pup approach and retrieval when the blue light (20 ms, 20 Hz, 1.5 mW) was delivered to the MPOA unilaterally. The female approached a pup-sized object upon light stimulation but did not retrieve after encountering it repeatedly.
A virgin female mouse that expressed ChR2-EYFP in the MPOA Esr1+ cells showed immediate pup approach and retrieval during unilateral light stimulation (20 ms, 20 Hz, 1.5 mW) of the MPOA after injecting saline (0.3 µl) but not bupivacaine (0.3 µl, 4%) into the MPOA.
KEY RESOURCES TABLE
| REAGENT or RESOURCE | SOURCE | IDENTIFIER |
|---|---|---|
| Antibodies | ||
| Rabbit anti-Esr1 | Santa Cruz | Cat# sc542 |
| Goat anti-c-Fos | Santa Cruz | Cat# sc52-g; RRID:AB_2629503 |
| Sheep anti-TH | Pel Freeze | Cat# P40101-150 |
| Rabbit anti-GFP | Life Technologies | Cat# A11122; RRID: AB_221569 |
| Donkey anti-rabbit Dylight 488 | Jackson Immunoresearch | Cat# 211-482-171, RRID:AB_2492289 |
| Donkey anti-rabbit Alexi Fluor 546 | Life Technologies | Cat# A10040, RRID: AB_2534016 |
| Donkey anti-goat Dylight 647 | Jackson Immunoresearch | Cat# 705-605-147 |
| Donkey anti-sheep Dylight 649 | Jackson Immunoresearch | Cat# 211-492-171 |
| Bacterial and Virus Strains | ||
| AAV1- EF1α -DIO-hM4D(Gi)-mCherry | UNC Vector Core | Cat# AAV1- EF1α -DIO-hM4D(Gi)-mCherry |
| AAV1-hSyn-DIO-mCherry | UNC Vector Core | Cat# AAV1-hSyn-DIO-mCherry |
| AAV2-EF1α-DIO-ChR2-EYFP | UNC Vector Core | Cat# AAV1-hSyn-DIO-mCherry |
| AAV5 hSyn-Con/Fon-eYFP | UNC Vector Core | Cat# AAV1-hSyn-DIO-mCherry |
| AAV1-CAG-Flex-GCaMP6s | UPenn Vector Core | Cat# AV-1-PV2824 |
| AAV1-CAG-Flex-GCaMP6f | UPenn Vector Core | Cat# AV-1-PV2822 |
| AAV2 CAG-Flex-GFP | UPenn Vector Core | Cat# AV-2-ALL854 |
| HSV hEF1α-LSL-mCherry-ires-flpoHT | MIT Vector Core | Cat# RN422 |
| HSV hEF1α-LSL-GCaMP6f | MIT Vector Core | Cat# RN506 |
| AAV2-EF1α-loxP-GCaMP6f-loxP-WPRE | NYU Abu Dabi Viral Center | N/A |
| Chemicals, Peptides, and Recombinant Proteins | ||
| Nissl 435/455 | Life Technologies | Cat# N21479; RRID: AB_2629482 |
| DAPI | Life Technologies | Cat# D1306 |
| Bupivacaine | Sigma | Cat# 1078507 |
| CNO | Sigma | Cat# C0832 |
| Red retrobeads | Lumafluor | Item # R170 |
| Mounting medium | VECTASHIELD | Cat# H1000 |
| Critical Commercial Assays | ||
| Nanoinjector | World Precision Instruments | Cat# Nanoliter 2000 |
| 0.5 µl Hamilton syringe | Sigma | Cat# 7000.5 |
| Experimental Models: Organisms/Strains | ||
| Esr1-2A-Cre female mice | D.J. Anderson and Jackson Laboratory | Stock No. 017911 |
| Vgat-ires-Cre knock-in mice | B. Lowell and Jackson Laboratory | Stock No. 016962 |
| Vglut2-ires-Cre knock-in mice | B. Lowell and Jackson Laboratory | Stock No. 016963 |
| DAT-ires-Cre mice | Jackson laboratory | Stock No. 006660 |
| Ai6 mice | Jackson laboratory | Stock No. 007906 |
| C57BL/6N mice | Charles River | C57BL/6N |
| Software and Algorithms | ||
| Matlab R2013b | MathWorks | https://www.mathworks.com/products/matlab.html |
| StreamPix 5 | NorPix | https://www.norpix.com/products/streampix/streampix.php |
| Offline Sorter | Plexon | https://plexon.com/products/offline-sorter/ |
| Other | ||
| 230 µm multimode optic fibers | Thorlabs | Cat# TS1450308 |
| Optic fiber assembly for fiber photometry | Thorlabs | Cat# BFH48-400, CF440-10 |
| LED light | Thorlabs | Cat# M470F1 |
| LED driver | Thorlabs | Cat# LEDD1B |
| Bandpass filter | Semrock | Cat# FF02-472/30-25, FF01-535/505 |
| Adjustable zooming lens | Thorlabs, Edmund Optics | Cat# SM1NR01, #62-561 |
| Femtowatt silicon photoreceiver | Newport | Cat# 2151 |
| Real-time processor RP2 | TDT | RP2 |
| 13 µm tungsten microwires | California Fine Wire | Cat# 100211 |
| 26G stainless steel tube | Ziggy’s Tubes and Wires | N/A |
| 100 µm multimode optic fiber | Thorlab | Cat# AFS105/125Y |
| omnetics nano-connector | Omnetics | Cat# A79014-001 |
| Feedback-controlled commutator | TDT | Cat# ACO32 |
| 16-channel preamplifier | TDT | Cat# RA16PA |
| Shutter | Uniblitz | Cat# LS3T2 |
Highlights.
MPOAEsr1+ cells are necessary and sufficient for driving pup approach and retrieval.
MPOAEsr1+ cells are naturally and preferentially activated during pup retrieval.
MPOA cells decrease baseline firing and increase response to pups during lactation.
MPOAEsr1+ provides strong inhibitory inputs to VTA non-DA cells to drive retrieval.
Acknowledgments
We thank K. Hashikawa and Y. Hashikawa for breeding Vgat:CRE × Ai6 and Vglut2:CRE × Ai6 mice, and advice on immunohistochemistry and image analysis. We thank A. Duffy for video annotation and A. H. Au for maintaining mouse colony. We thank R. Froemke, R. Sullivan, A. Falkner, A. Hines and P. Hare for editing the paper and scientific discussion. This research was supported by a JSPS oversea fellowship (T.Y.), a Uehara postdoctoral fellowship (T.Y.), NIH R00NS087098 and DP2NS105553 (N.X.T.), Leon Levy Foundation (N.X.T.), Dana Foundation (N.X.T.), Alfred P. Sloan Foundation (N.X.T. and D.L.), Whitehall Foundations (N.X.T. and D.L.), NIH 1R01MH101377 and 1R21MH105774-01A1 (D.L.), the Mathers Foundation (D.L.), the Esther A. & and Joseph Klingenstein Fund (D.L.), an Irma T. Hirschl Career Scientist Award (D.L.) and a McKnight Scholar Award (D.L.).
Footnotes
Publisher's Disclaimer: This is a PDF file of an unedited manuscript that has been accepted for publication. As a service to our customers we are providing this early version of the manuscript. The manuscript will undergo copyediting, typesetting, and review of the resulting proof before it is published in its final citable form. Please note that during the production process errors may be discovered which could affect the content, and all legal disclaimers that apply to the journal pertain.
Author contributions
D.L. conceptualized the project, designed and supervised experiments, analyzed data and wrote the paper. Y.Y.F. co-designed and performed most experiments, analyzed data and co-wrote the paper. T.Y. generated the cre-out GCaMP6f construct and edited the paper. S.C.S. performed slice recording and analyzed data. N.X.T. supervised the slice recording experiment, analyzed data and edited the paper.
Declaration of Interests
The authors declare no competing interests.
References
- Armbruster BN, Li X, Pausch MH, Herlitze S, Roth BL. Evolving the lock to fit the key to create a family of G protein-coupled receptors potently activated by an inert ligand. P Natl Acad Sci USA. 2007;104:5163–5168. doi: 10.1073/pnas.0700293104. [DOI] [PMC free article] [PubMed] [Google Scholar]
- Arrati PG, Carmona C, Dominguez G, Beyer C, Rosenblatt JS. GABA receptor agonists in the medial preoptic area and maternal behavior in lactating rats. Physiology & behavior. 2006;87:51–65. doi: 10.1016/j.physbeh.2005.08.048. [DOI] [PubMed] [Google Scholar]
- Boyden ES, Zhang F, Bamberg E, Nagel G, Deisseroth K. Millisecond-timescale, genetically targeted optical control of neural activity. Nature neuroscience. 2005;8:1263–1268. doi: 10.1038/nn1525. [DOI] [PubMed] [Google Scholar]
- Bridges RS. A quantitative analysis of the roles of dosage, sequence, and duration of estradiol and progesterone exposure in the regulation of maternal behavior in the rat. Endocrinology. 1984;114:930–940. doi: 10.1210/endo-114-3-930. [DOI] [PubMed] [Google Scholar]
- Bridges RS, DiBiase R, Loundes DD, Doherty PC. Prolactin stimulation of maternal behavior in female rats. Science. 1985;227:782–784. doi: 10.1126/science.3969568. [DOI] [PubMed] [Google Scholar]
- Calamandrei G, Keverne EB. Differential expression of Fos protein in the brain of female mice dependent on pup sensory cues and maternal experience. Behav Neurosci. 1994;108:113–120. doi: 10.1037//0735-7044.108.1.113. [DOI] [PubMed] [Google Scholar]
- Cardin JA, Carlen M, Meletis K, Knoblich U, Zhang F, Deisseroth K, Tsai LH, Moore CI. Targeted optogenetic stimulation and recording of neurons in vivo using cell-type-specific expression of Channelrhodopsin-2. Nat Protoc. 2010;5:247–254. doi: 10.1038/nprot.2009.228. [DOI] [PMC free article] [PubMed] [Google Scholar]
- Chen TW, Wardill TJ, Sun Y, Pulver SR, Renninger SL, Baohan A, Schreiter ER, Kerr RA, Orger MB, Jayaraman V, et al. Ultrasensitive fluorescent proteins for imaging neuronal activity. Nature. 2013;499:295–300. doi: 10.1038/nature12354. [DOI] [PMC free article] [PubMed] [Google Scholar]
- Chieng B, Azriel Y, Mohammadi S, Christie MJ. Distinct cellular properties of identified dopaminergic and GABAergic neurons in the mouse ventral tegmental area. J Physiol. 2011;589:3775–3787. doi: 10.1113/jphysiol.2011.210807. [DOI] [PMC free article] [PubMed] [Google Scholar]
- Chung S, Weber F, Zhong P, Tan CL, Nguyen TN, Beier KT, Hormann N, Chang WC, Zhang Z, Do JP, et al. Identification of preoptic sleep neurons using retrograde labelling and gene profiling. Nature. 2017;545:477–481. doi: 10.1038/nature22350. [DOI] [PMC free article] [PubMed] [Google Scholar]
- Ciriello J, McMurray JC, Babic T, de Oliveira CV. Collateral axonal projections from hypothalamic hypocretin neurons to cardiovascular sites in nucleus ambiguus and nucleus tractus solitarius. Brain Res. 2003;991:133–141. doi: 10.1016/j.brainres.2003.08.016. [DOI] [PubMed] [Google Scholar]
- Cui G, Jun SB, Jin X, Pham MD, Vogel SS, Lovinger DM, Costa RM. Concurrent activation of striatal direct and indirect pathways during action initiation. Nature. 2013;494:238–242. doi: 10.1038/nature11846. [DOI] [PMC free article] [PubMed] [Google Scholar]
- Doerr HK, Siegel HI, Rosenblatt JS. Effects of progesterone withdrawal and estrogen on maternal behavior in nulliparous rats. Behav Neural Biol. 1981;32:35–44. doi: 10.1016/s0163-1047(81)90242-9. [DOI] [PubMed] [Google Scholar]
- Fahrbach SE, Pfaff DW. Effect of preoptic region implants of dilute estradiol on the maternal behavior of ovariectomized, nulliparous rats. Hormones and behavior. 1986;20:354–363. doi: 10.1016/0018-506x(86)90043-7. [DOI] [PubMed] [Google Scholar]
- Falkner AL, Dollar P, Perona P, Anderson DJ, Lin D. Decoding ventromedial hypothalamic neural activity during male mouse aggression. J Neurosci. 2014;34:5971–5984. doi: 10.1523/JNEUROSCI.5109-13.2014. [DOI] [PMC free article] [PubMed] [Google Scholar]
- Falkner AL, Grosenick L, Davidson TJ, Deisseroth K, Lin D. Hypothalamic control of male aggression-seeking behavior. Nature neuroscience. 2016;19:596–604. doi: 10.1038/nn.4264. [DOI] [PMC free article] [PubMed] [Google Scholar]
- Gandelman R, Zarrow MX, Denenberg VH. Maternal behavior: differences between mother and virgin mice as a function of the testing procedure. Dev Psychobiol. 1970;3:207–214. doi: 10.1002/dev.420030308. [DOI] [PubMed] [Google Scholar]
- Gunaydin LA, Deisseroth K. Dopaminergic Dynamics Contributing to Social Behavior. Cold Spring Harbor symposia on quantitative biology. 2014;79:221–227. doi: 10.1101/sqb.2014.79.024711. [DOI] [PubMed] [Google Scholar]
- Gunaydin LA, Grosenick L, Finkelstein JC, Kauvar IV, Fenno LE, Adhikari A, Lammel S, Mirzabekov JJ, Airan RD, Zalocusky KA, et al. Natural neural projection dynamics underlying social behavior. Cell. 2014;157:1535–1551. doi: 10.1016/j.cell.2014.05.017. [DOI] [PMC free article] [PubMed] [Google Scholar]
- Hansen S, Harthon C, Wallin E, Lofberg L, Svensson K. Mesotelencephalic dopamine system and reproductive behavior in the female rat: effects of ventral tegmental 6-hydroxydopamine lesions on maternal and sexual responsiveness. Behav Neurosci. 1991;105:588–598. doi: 10.1037//0735-7044.105.4.588. [DOI] [PubMed] [Google Scholar]
- Hashikawa K, Hashikawa Y, Tremblay R, Zhang J, Feng JE, Sabol A, Piper WT, Lee H, Rudy B, Lin D. Esr1+ cells in the ventromedial hypothalamus control female aggression. Nat Neurosci. 2017 doi: 10.1038/nn.4644. [DOI] [PMC free article] [PubMed] [Google Scholar]
- Keyser-Marcus L, Stafisso-Sandoz G, Gerecke K, Jasnow A, Nightingale L, Lambert KG, Gatewood J, Kinsley CH. Alterations of medial preoptic area neurons following pregnancy and pregnancy-like steroidal treatment in the rat. Brain Res Bull. 2001;55:737–745. doi: 10.1016/s0361-9230(01)00554-8. [DOI] [PubMed] [Google Scholar]
- Lammel S, Ion DI, Roeper J, Malenka RC. Projection-specific modulation of dopamine neuron synapses by aversive and rewarding stimuli. Neuron. 2011;70:855–862. doi: 10.1016/j.neuron.2011.03.025. [DOI] [PMC free article] [PubMed] [Google Scholar]
- Lee A, Clancy S, Fleming AS. Mother rats bar-press for pups: effects of lesions of the mpoa and limbic sites on maternal behavior and operant responding for pup-reinforcement. Behav Brain Res. 1999;100:15–31. doi: 10.1016/s0166-4328(98)00109-0. [DOI] [PubMed] [Google Scholar]
- Lee H, Kim DW, Remedios R, Anthony TE, Chang A, Madisen L, Zeng H, Anderson DJ. Scalable control of mounting and attack by Esr1+ neurons in the ventromedial hypothalamus. Nature. 2014;509:627–632. doi: 10.1038/nature13169. [DOI] [PMC free article] [PubMed] [Google Scholar]
- Lin D, Boyle MP, Dollar P, Lee H, Lein ES, Perona P, Anderson DJ. Functional identification of an aggression locus in the mouse hypothalamus. Nature. 2011;470:221–226. doi: 10.1038/nature09736. [DOI] [PMC free article] [PubMed] [Google Scholar]
- Lonstein JS, Greco B, De Vries GJ, Stern JM, Blaustein JD. Maternal behavior stimulates c-fos activity within estrogen receptor alpha-containing neurons in lactating rats. Neuroendocrinology. 2000;72:91–101. doi: 10.1159/000054576. [DOI] [PubMed] [Google Scholar]
- Marlin BJ, Mitre M, D'Amour JA, Chao MV, Froemke RC. Oxytocin enables maternal behaviour by balancing cortical inhibition. Nature. 2015;520:499–504. doi: 10.1038/nature14402. [DOI] [PMC free article] [PubMed] [Google Scholar]
- McHenry JA, Otis JM, Rossi MA, Robinson JE, Kosyk O, Miller NW, McElligott ZA, Budygin EA, Rubinow DR, Stuber GD. Hormonal gain control of a medial preoptic area social reward circuit. Nature neuroscience. 2017;20:449–458. doi: 10.1038/nn.4487. [DOI] [PMC free article] [PubMed] [Google Scholar]
- Meddle SL, Bishop VR, Gkoumassi E, van Leeuwen FW, Douglas AJ. Dynamic changes in oxytocin receptor expression and activation at parturition in the rat brain. Endocrinology. 2007;148:5095–5104. doi: 10.1210/en.2007-0615. [DOI] [PubMed] [Google Scholar]
- Mitra SW, Hoskin E, Yudkovitz J, Pear L, Wilkinson HA, Hayashi S, Pfaff DW, Ogawa S, Rohrer SP, Schaeffer JM, et al. Immunolocalization of estrogen receptor beta in the mouse brain: comparison with estrogen receptor alpha. Endocrinology. 2003;144:2055–2067. doi: 10.1210/en.2002-221069. [DOI] [PubMed] [Google Scholar]
- Mogenson GJ, Jones DL, Yim CY. From motivation to action: functional interface between the limbic system and the motor system. Prog Neurobiol. 1980;14:69–97. doi: 10.1016/0301-0082(80)90018-0. [DOI] [PubMed] [Google Scholar]
- Nieh EH, Vander Weele CM, Matthews GA, Presbrey KN, Wichmann R, Leppla CA, Izadmehr EM, Tye KM. Inhibitory Input from the Lateral Hypothalamus to the Ventral Tegmental Area Disinhibits Dopamine Neurons and Promotes Behavioral Activation. Neuron. 2016;90:1286–1298. doi: 10.1016/j.neuron.2016.04.035. [DOI] [PMC free article] [PubMed] [Google Scholar]
- Numan M. Medial preoptic area and maternal behavior in the female rat. Journal of comparative and physiological psychology. 1974;87:746–759. doi: 10.1037/h0036974. [DOI] [PubMed] [Google Scholar]
- Numan M, Callahan EC. The connections of the medial preoptic region and maternal behavior in the rat. Physiology & behavior. 1980;25:653–665. doi: 10.1016/0031-9384(80)90367-4. [DOI] [PubMed] [Google Scholar]
- Numan M, Corodimas KP, Numan MJ, Factor EM, Piers WD. Axon- sparing lesions of the preoptic region and substantia innominata disrupt maternal behavior in rats. Behavioral neuroscience. 1988;102:381–396. doi: 10.1037//0735-7044.102.3.381. [DOI] [PubMed] [Google Scholar]
- Numan M, Insel TR. The neurobiology of parental behavior. New York: Springer; 2003. [Google Scholar]
- Numan M, Smith HG. Maternal behavior in rats: evidence for the involvement of preoptic projections to the ventral tegmental area. Behavioral neuroscience. 1984;98:712–727. doi: 10.1037//0735-7044.98.4.712. [DOI] [PubMed] [Google Scholar]
- Ogawa S, Eng V, Taylor J, Lubahn DB, Korach KS, Pfaff DW. Roles of estrogen receptor-alpha gene expression in reproduction-related behaviors in female mice. Endocrinology. 1998;139:5070–5081. doi: 10.1210/endo.139.12.6357. [DOI] [PubMed] [Google Scholar]
- Owen SF, Tuncdemir SN, Bader PL, Tirko NN, Fishell G, Tsien RW. Oxytocin enhances hippocampal spike transmission by modulating fast-spiking interneurons. Nature. 2013;500:458–462. doi: 10.1038/nature12330. [DOI] [PMC free article] [PubMed] [Google Scholar]
- Park SG, Jeong YC, Kim DG, Lee MH, Shin A, Park G, Ryoo J, Hong J, Bae S, Kim CH, et al. Medial preoptic circuit induces hunting-like actions to target objects and prey. Nature neuroscience. 2018 doi: 10.1038/s41593-018-0072-x. [DOI] [PubMed] [Google Scholar]
- Pedersen CA, Ascher JA, Monroe YL, Prange AJ., Jr Oxytocin induces maternal behavior in virgin female rats. Science. 1982;216:648–650. doi: 10.1126/science.7071605. [DOI] [PubMed] [Google Scholar]
- Pereira M, Morrell JI. The changing role of the medial preoptic area in the regulation of maternal behavior across the postpartum period: facilitation followed by inhibition. Behav Brain Res. 2009;205:238–248. doi: 10.1016/j.bbr.2009.06.026. [DOI] [PMC free article] [PubMed] [Google Scholar]
- Ribeiro AC, Musatov S, Shteyler A, Simanduyev S, Arrieta-Cruz I, Ogawa S, Pfaff DW. siRNA silencing of estrogen receptor-alpha expression specifically in medial preoptic area neurons abolishes maternal care in female mice. Proceedings of the National Academy of Sciences of the United States of America. 2012;109:16324–16329. doi: 10.1073/pnas.1214094109. [DOI] [PMC free article] [PubMed] [Google Scholar]
- Rosenblatt JS, Siegel HI. Hysterectomy-induced maternal behavior during pregnancy in the rat. J Comp Physiol Psychol. 1975;89:685–700. doi: 10.1037/h0077052. [DOI] [PubMed] [Google Scholar]
- Salzberg HC, Lonstein JS, Stern JM. GABA(A) receptor regulation of kyphotic nursing and female sexual behavior in the caudal ventrolateral periaqueductal gray of postpartum rats. Neuroscience. 2002;114:675–687. doi: 10.1016/s0306-4522(02)00358-5. [DOI] [PubMed] [Google Scholar]
- Scott N, Prigge M, Yizhar O, Kimchi T. A sexually dimorphic hypothalamic circuit controls maternal care and oxytocin secretion. Nature. 2015;525:519–522. doi: 10.1038/nature15378. [DOI] [PubMed] [Google Scholar]
- Shughrue PJ, Lane MV, Merchenthaler I. Comparative distribution of estrogen receptor-alpha and -beta mRNA in the rat central nervous system. J Comp Neurol. 1997;388:507–525. doi: 10.1002/(sici)1096-9861(19971201)388:4<507::aid-cne1>3.0.co;2-6. [DOI] [PubMed] [Google Scholar]
- Siegel HI, Rosenblatt JS. Hormonal basis of hysterectomy-induced maternal behavior during pregnancy in the rat. Horm Behav. 1975;6:211–222. doi: 10.1016/0018-506x(75)90008-2. [DOI] [PubMed] [Google Scholar]
- Silva MR, Bernardi MM, Felicio LF. Effects of dopamine receptor antagonists on ongoing maternal behavior in rats. Pharmacology, biochemistry, and behavior. 2001;68:461–468. doi: 10.1016/s0091-3057(01)00471-3. [DOI] [PubMed] [Google Scholar]
- Simerly RB, Gorski RA, Swanson LW. Neurotransmitter specificity of cells and fibers in the medial preoptic nucleus: an immunohistochemical study in the rat. J Comp Neurol. 1986;246:343–363. doi: 10.1002/cne.902460305. [DOI] [PubMed] [Google Scholar]
- Simerly RB, Swanson LW. Projections of the medial preoptic nucleus: a Phaseolus vulgaris leucoagglutinin anterograde tract-tracing study in the rat. J Comp Neurol. 1988;270:209–242. doi: 10.1002/cne.902700205. [DOI] [PubMed] [Google Scholar]
- Smith CD, Holschbach MA, Olsewicz J, Lonstein JS. Effects of noradrenergic alpha-2 receptor antagonism or noradrenergic lesions in the ventral bed nucleus of the stria terminalis and medial preoptic area on maternal care in female rats. Psychopharmacology (Berl) 2012;224:263–276. doi: 10.1007/s00213-012-2749-2. [DOI] [PMC free article] [PubMed] [Google Scholar]
- Stack EC, Balakrishnan R, Numan MJ, Numan M. A functional neuroanatomical investigation of the role of the medial preoptic area in neural circuits regulating maternal behavior. Behav Brain Res. 2002;131:17–36. doi: 10.1016/s0166-4328(01)00370-9. [DOI] [PubMed] [Google Scholar]
- Stolzenberg DS, Rissman EF. Oestrogen-independent, experience-induced maternal behaviour in female mice. Journal of neuroendocrinology. 2011;23:345–354. doi: 10.1111/j.1365-2826.2011.02112.x. [DOI] [PMC free article] [PubMed] [Google Scholar]
- Szymusiak R, Satinoff E. Acute thermoregulatory effects of unilateral electrolytic lesions of the medial and lateral preoptic area in rats. Physiol Behav. 1982;28:161–170. doi: 10.1016/0031-9384(82)90118-4. [DOI] [PubMed] [Google Scholar]
- Tan KR, Yvon C, Turiault M, Mirzabekov JJ, Doehner J, Labouebe G, Deisseroth K, Tye KM, Luscher C. GABA neurons of the VTA drive conditioned place aversion. Neuron. 2012;73:1173–1183. doi: 10.1016/j.neuron.2012.02.015. [DOI] [PMC free article] [PubMed] [Google Scholar]
- Terkel J, Bridges RS, Sawyer CH. Effects of transecting lateral neural connections of the medial preoptic area on maternal behavior in the rat: nest building, pup retrieval and prolactin secretion. Brain research. 1979;169:369–380. doi: 10.1016/0006-8993(79)91037-0. [DOI] [PubMed] [Google Scholar]
- Tsuneoka Y, Maruyama T, Yoshida S, Nishimori K, Kato T, Numan M, Kuroda KO. Functional, anatomical, and neurochemical differentiation of medial preoptic area subregions in relation to maternal behavior in the mouse. The Journal of comparative neurology. 2013;521:1633–1663. doi: 10.1002/cne.23251. [DOI] [PubMed] [Google Scholar]
- Tsuneoka Y, Yoshida S, Takase K, Oda S, Kuroda M, Funato H. Neurotransmitters and neuropeptides in gonadal steroid receptor-expressing cells in medial preoptic area subregions of the male mouse. Scientific reports. 2017;7:9809. doi: 10.1038/s41598-017-10213-4. [DOI] [PMC free article] [PubMed] [Google Scholar]
- Vertes RP, McKenna JT. Collateral projections from the supramammillary nucleus to the medial septum and hippocampus. Synapse. 2000;38:281–293. doi: 10.1002/1098-2396(20001201)38:3<281::AID-SYN7>3.0.CO;2-6. [DOI] [PubMed] [Google Scholar]
- Wang L, Chen IZ, Lin D. Collateral pathways from the ventromedial hypothalamus mediate defensive behaviors. Neuron. 2015;85:1344–1358. doi: 10.1016/j.neuron.2014.12.025. [DOI] [PMC free article] [PubMed] [Google Scholar]
- Wei YC, Wang SR, Jiao ZL, Zhang W, Lin JK, Li XY, Li SS, Zhang X, Xu XH. Medial preoptic area in mice is capable of mediating sexually dimorphic behaviors regardless of gender. Nat Commun. 2018;9 doi: 10.1038/s41467-017-02648-0. [DOI] [PMC free article] [PubMed] [Google Scholar]
- Woolley CS. Estrogen-mediated structural and functional synaptic plasticity in the female rat hippocampus. Horm Behav. 1998;34:140–148. doi: 10.1006/hbeh.1998.1466. [DOI] [PubMed] [Google Scholar]
- Wu Z, Autry AE, Bergan JF, Watabe-Uchida M, Dulac CG. Galanin neurons in the medial preoptic area govern parental behaviour. Nature. 2014;509:325–330. doi: 10.1038/nature13307. [DOI] [PMC free article] [PubMed] [Google Scholar]
- Yang CF, Chiang MC, Gray DC, Prabhakaran M, Alvarado M, Juntti SA, Unger EK, Wells JA, Shah NM. Sexually dimorphic neurons in the ventromedial hypothalamus govern mating in both sexes and aggression in males. Cell. 2013;153:896–909. doi: 10.1016/j.cell.2013.04.017. [DOI] [PMC free article] [PubMed] [Google Scholar]
Associated Data
This section collects any data citations, data availability statements, or supplementary materials included in this article.
Supplementary Materials
The lactating female mouse expressing hM4Di-mCherry in the MPOA Esr1+ cells was tested for maternal behaviors in the home cage after either saline or CNO (1mg/kg) injection.
The lactating female mouse expressing hM4Di-mCherry in the MPOA Esr1+ cells was tested for pup approach and retrieval in a large arena after either saline or CNO (1mg/kg) injection.
A virgin female mouse that expressed ChR2-EYFP in the MPOA Esr1+ cells showed immediate pup approach and retrieval when the blue light (20 ms, 20 Hz, 1.5 mW) was delivered to the MPOA unilaterally. The female approached a pup-sized object upon light stimulation but did not retrieve after encountering it repeatedly.
A virgin female mouse that expressed ChR2-EYFP in the MPOA Esr1+ cells showed immediate pup approach and retrieval during unilateral light stimulation (20 ms, 20 Hz, 1.5 mW) of the MPOA after injecting saline (0.3 µl) but not bupivacaine (0.3 µl, 4%) into the MPOA.