

Abstract
Medulloblastoma (MB) is the most common malignant primary pediatric brain cancer. Among the most aggressive subtypes, Group 3 and Group 4 originate from stem/progenitor cells, frequently metastasize, and often display the worst prognosis, yet we know the least about the molecular mechanisms driving their progression. Here, we show that the transcription factor orthodenticle homeobox 2 (OTX2) promotes self‐renewal while inhibiting differentiation in vitro and increases tumor initiation from MB stem/progenitor cells in vivo. To determine how OTX2 contributes to these processes, we employed complementary bioinformatic approaches to characterize the OTX2 regulatory network and identified novel relationships between OTX2 and genes associated with neuronal differentiation and axon guidance signaling in Group 3 and Group 4 MB stem/progenitor cells. In particular, OTX2 levels were negatively correlated with semaphorin (SEMA) signaling, as expression of 9 SEMA pathway genes is upregulated following OTX2 knockdown with some being potential direct OTX2 targets. Importantly, this negative correlation was also observed in patient samples, with lower expression of SEMA4D associated with poor outcome specifically in Group 4 tumors. Functional proof‐of‐principle studies demonstrated that increased levels of select SEMA pathway genes are associated with decreased self‐renewal and growth in vitro and in vivo and that RHO signaling, known to mediate the effects of SEMA genes, is contributing to the OTX2 KD phenotype. Our study provides mechanistic insight into the networks controlled by OTX2 in MB stem/progenitor cells and reveals novel roles for axon guidance genes and their downstream effectors as putative tumor suppressors in MB.
Keywords: axon guidance genes, medulloblastoma, orthodenticle homeobox 2, RHO, semaphorin, stem cells
Abbreviations
- MB
medulloblastoma
- SEMA
semaphorin
1. Introduction
Medulloblastoma (MB) is currently divided into at least five molecular subgroups that exhibit different genomic aberrations, gene expression profiles, and clinical outcomes as well as extensive intertumoral heterogeneity: WNT, Sonic Hedgehog (SHH)/TP53‐wild‐type, SHH/TP53 mutant, Group 3, and Group 4 (Cavalli et al., 2017; Louis et al., 2016; Northcott et al., 2011). Indeed, recent studies have identified up to 12 MB subtypes within the subgroups that display unique genetic, epigenetic and molecular signatures (Cavalli et al., 2017; Northcott et al., 2017; Schwalbe et al., 2017). High‐risk to very‐high‐risk patients include those exhibiting the more aggressive Group 3 and Group 4 MB subgroups (Ramaswamy et al., 2016). These children have the worst prognosis, with up to 50% displaying metastatic dissemination through the cerebrospinal fluid at diagnosis (Ramaswamy et al., 2016). Metastases are attributed to persistent cancer stem cells and highly motile cells that evade chemotherapy and radiation treatment. However, surprisingly little is known about the genes and signaling pathways that regulate these treatment‐resistant cell populations. Thus, there is a critical need to identify the pathways contributing to Group 3 and Group 4 MB pathogenesis not only to understand how these tumors progress but also to develop targeted therapies with less harmful side‐effects on the developing brains of children. As these tumors originate from stem/progenitor cells that exist transiently during early cerebellar development (Kawauchi et al., 2012, 2017; Lin et al., 2016; Pei et al., 2012), targeting MB cells with stem/progenitor molecular signatures that persist beyond this stage represents a therapeutic strategy that may have less toxic effects on the nervous systems of young patients.
The homeodomain transcription factor orthodenticle homeobox 2 (OTX2) plays critical roles in forebrain, midbrain, and rostral hindbrain patterning as well as lineage specification (Acampora et al., 1995; Ang et al., 1996; Matsuo et al., 1995). Through its homeodomain, the OTX2 protein binds to the DNA target sequence 5′‐TAATCC‐3′ with high affinity (Beby and Lamonerie, 2013). OTX2 activates or suppresses its targets both directly and indirectly through additional intermediate signaling molecules or other transcription factors (Bai et al., 2012; Bunt et al., 2012). For example, OTX2 enhances proliferation of ventral midbrain progenitor cells (Omodei et al., 2008), while it inhibits proliferation in the thalamus (Puelles et al., 2006), demonstrating that OTX2 function is dependent on both neuroanatomical region and cell type. While expression is tightly controlled during normal neurodevelopment, OTX2 levels are abnormally sustained in Group 3 and Group 4 MB, with over 80% exhibiting either recurrent gain or overexpression (OE) of this homeobox gene (Adamson et al., 2010).
To date, most studies have evaluated the role of OTX2 specifically on MB cell proliferation and survival (Bunt et al., 2010, 2012). Experiments involving OTX2 OE or knockdown in established MB cell lines grown as adherent cultures in serum have identified cell cycle genes as direct targets of OTX2 (Bunt et al., 2010, 2012). However, Bunt et al. (2013) suggested that OTX2 may not actually regulate gene expression levels directly and demonstrated that OTX2 functions to sustain H3K27 trimethylation and maintain promoter bivalency. While these studies provided significant insight on how OTX2 contributes to MB growth, a more comprehensive understanding of OTX2‐mediated regulation in stem cell conditions will be critical, as cancer stem cells are major contributors to tumor initiation, recurrence, and poor prognosis in Group 3 and Group 4 MB patients.
We have recently discovered a novel role for OTX2 in controlling stem cell function or self‐renewal in established Group 3 and Group 4 MB cell lines (Kaur et al., 2015). However, the mechanisms by which OTX2 regulates this process were not defined. Here, we characterized an OTX2‐driven stem cell program in Group 3 and Group 4 MB stem/progenitor cells and identified a negative correlation between OTX2 and expression of a large cohort of axon guidance genes. Specifically, OTX2 was negatively correlated with nine semaphorin ligands and receptors. Functional studies demonstrated that increased levels of genes involved in semaphorin signaling and the downstream RHO pathway are associated with a more differentiated phenotype. Our data reveal novel associations between OTX2 and axon guidance genes and underscore a potential tumor‐suppressive role for these neurodevelopmental cues in Group 3 and Group 4 tumors.
2. Materials and methods
2.1. Cell culture
D283 and D341 cells were purchased from the American Type Culture Collection (ATCC, Rockville, MD, USA). D283 (Friedman et al., 1985) exhibits features of both Group 3 (Thompson et al., 2017) and Group 4 MB (Snuderl et al., 2013), and D341 is a Group 3 MB cell line (Friedman et al., 1988). D425 (He et al., 1991) Group 3 cells were obtained from Magimairajan Vanan (University of Manitoba, Winnipeg, MB, Canada). D283 cells were cultured as previously described (Kaur et al., 2015). D341 and D425 cells were maintained in StemPro® Neural Stem Cell Serum Free Medium (Life Technologies, Burlington, ON, Canada) on ultra‐low‐attachment plates. MB3W1 (Dietl et al., 2016) and HD‐MB03 (Milde et al., 2012) Group 3 cells were cultured as previously described. Confluent cultures were dissociated in Accutase (Life Technologies) and passed 1 : 10 for maintenance (Kaur et al., 2015). All cell lines were recently authenticated by STR profiling (ATCC) and maintained for a maximum of 20–25 passages before a new vial was thawed. For tumorsphere assays, D283 and MB3W1 cells were dissociated and plated at 1–20 cells·μL−1 onto 24‐well ultra‐low‐attachment plates in Neural Stem Cell Media (Kaur et al., 2015) and Stem Cell Media consisting of Dulbecco's modified Eagle's medium/F12 supplemented with 1% N2 (Gibco, Burlington, ON, Canada), 1% B27 (Gibco), 20 ng·mL−1 epidermal growth factor (R&D Systems, Minneapolis, MN, USA), 20 ng·mL−1 basic fibroblast growth factor (bFGF; R&D Systems), and 4% penicillin/streptomycin 10 000 U·mL−1 (Life Technologies), respectively. D341, D425, and HD‐MB03 cells were cultured in StemPro media. For SEMA protein treatment, human L1CAM (R&D Systems), SEMA4D (R&D Systems), and NRP1 (ACRO Biosystems, Newark, DE, USA) Fc chimera proteins were added to D283 tumorsphere cultures (50–1000 ng·mL−1) at day 0 for both primary and secondary passage.
2.2. Small interfering RNA
OTX2, SEMA4D, L1CAM, and NRP1 levels were knocked down in MB cells using 30 nm Silencer select siRNA (Life Technologies), while a nonsilencing (scramble) siRNA was used as a negative control. OTX2 was knocked down using three independent siRNA sequences (s9931, s9932, and s9933), while the SEMA genes were knocked down using two independent siRNA sequences for SEMA4D (s51388 and s20598), L1CAM (s8036, s8038), and NRP1 (s16843, s16844). Knockdown was evaluated by immunoblot.
2.3. Gene expression profiling and analyses
Extracted RNA from D283 scramble control (OTX2high) and OTX2 KD (OTX2low) tumorspheres using siRNA 9931 (N = 3 biological replicates) was subjected to GeneChip 3′ oligonucleotide microarray hybridization and processing performed by Stem Core Laboratories at the Ottawa Hospital Research Institute (OHRI). Analysis was performed by the Ottawa Bioinformatics Core Facility. HuGene 2.0 st microarray RMA expression values were generated by the Affymetrix Expression Console. Gene symbol annotations were based on Affymetrix provided HuGene‐2_0‐st‐v1.na35.hg19 transcript cluster annotations, assigning each transcript cluster identifier to the first provided gene symbol in the annotation. Fold change and significance for transcript cluster identifiers between conditions were determined using the R limma package. Differentially expressed pathways were analyzed using ingenuity pathway analysis (IPA; Redwood City, CA, USA). Transcripts differentially expressed at least twofold (up‐ or downregulated) and with a value of P < 0.05 were considered significant. Downstream effects analysis was conducted using the Z‐score algorithm to predict the expected causal effects between differentially expressed genes and cell function. A Z‐score ≥ 2 indicates that the function is significantly increased, whereas a Z‐score ≤ −2 indicates that the function is significantly decreased. Gene set enrichment analysis (GSEA) (Subramanian et al., 2005) was performed on expression data comparing OTX2high and OTX2low tumorspheres (Affymetrix HuGene 2.0st). GSEA results were explored using the Reactome (Croft et al., 2014) and KEGG (Kanehisa et al., 2016) databases to identify pathways significantly enriched in the expression sets.
2.4. Chromatin immunoprecipitation sequencing
Chromatin immunoprecipitation was performed on D283 tumorspheres as previously described (Kaur et al., 2015). ChIP‐seq data were generated on a NextSeq 2500 and mapped to the GRCh38 human genome model using bowtie2 v2.2.4. Peaks were called using macs2 v2.1.0.20140616. Peaks called were masked for ENCODE blacklist peak locations.
2.5. Immunofluorescent staining
Tumorspheres were fixed in 10% formalin for 2–3 h. Samples were washed 2× with PBS and incubated in fresh, ice‐cold 15% sucrose followed by 30% sucrose each for 2–3 h at 4 °C. Samples were embedded in OCT, frozen, cut into 10‐μm‐thick sections, washed in Tris‐buffered saline (TBS 1×) for 10 min, and incubated with 1% BSA and 5% serum in TBS for 45 min at room temperature (RT). Sections were stained with mouse antineuron‐specific βIII‐tubulin monoclonal antibody (1 : 100) (R&D Systems) and incubated at RT for 2 h. Slides were then washed with TBS 3 × 5 min, followed by secondary antibody incubation (Alexa flour 488 goat anti‐mouse IgG) (1 : 200) (ThermoFisher) for 1 h at RT. Slides were then washed and counterstained with prolong gold antifade mountant with DAPI (Molecular Probes, Life Technologies, Eugene, OR, USA).
2.6. Immunoblotting
Protein was isolated using either the All‐In‐One Purification Kit (Norgen Biotek, Thorold, ON, Canada) or using IP lysis buffer (975 μl lysis buffer, 10 μl 50× protease inhibitor, and 5 μl orthovanadate). Twenty micrograms of protein was loaded onto 10% Tris/glycine gels. Nitrocellulose membranes were blocked in 2.5% nonfat milk in TBS with Tween‐20 (TBST) and then incubated at 4°C overnight with antibodies diluted in SuperSignal antibody buffer at concentrations described in Table S1. Membranes were treated with enhancer buffer for 10 min prior to blocking with 2.5% nonfat milk. Membranes were washed 3× with TBST before application of secondary antibodies (Table S1) and then developed using SuperSignal West Pico (Fisher Scientific, Nepean, ON, Canada).
2.7. Real‐time qPCR
Total RNA was extracted from tumorspheres, and first‐strand cDNA was synthesized as previously described (Kaur et al., 2015). GoTaq qPCR Master Mix (Fisher Scientific) was used for sample preparation, and analysis was performed on a Mx3000P (Stratagene, Santa Clara, CA, USA) system. Glyceraldehyde 3‐phosphate dehydrogenase (GAPDH) was used to normalize all values. Primer sequences are listed in Table S2. The following qPCR conditions were used: 50 °C for 2 min, 95 °C for 2 min, and 40 cycles of 95 °C for 15 s and 60 °C for 30 s.
2.8. Lentiviral transduction
Stable knockdown of OTX2 was performed as previously described (Kaur et al., 2015). Stable SEMA4D OE was performed using ORF cDNA lentiviral particles (GeneCopoeia, Rockville, MD, USA) consisting of an Lv105 transfer vector with a puromycin resistance gene. Lentiviral negative control particles were used as controls. Cells were seeded in six‐well plates at 2 × 10⁵ in stem cell conditions 24 h prior to transduction.
2.9. RHO pull‐down
RHO activity was measured using the Active RHO Pull‐Down and Detection kit according to manufacturer's instructions (ThermoFisher). For each treatment, 12–18 wells of tumorspheres were washed with ice‐cold TBS and resuspended in 0.5 ml lysis buffer (25 mm Tris/HCl, pH 7.2, 150 mm NaCl, 5 mm MgCl2, 1% NP‐40 and 5% glycerol, and 10 μl 50× protease inhibitor). Samples were evaluated for RHO activity by immunoblot.
2.10. Group 3 and Group 4 MB Patient sample analysis
Fully annotated Affymetrix Gene 1.1 ST Array datasets (Northcott et al., 2012; Remke et al., 2011) were used to compare transcript levels of axon guidance genes in 234 Group 3 and Group 4 patient samples. The following axon guidance genes were not part of this published microarray dataset: GNG3, EFNA4, ARPC1B, TUBB4A, MIR27B, and ITGA4. A Pearson correlation coefficient was calculated for OTX2 and each of the axon guidance genes. The FDR correction was used to adjust for multiple comparisons (FDR < 0.1). Survival was compared in patients with SEMA gene expression (> 80th percentile) to patients with low SEMA gene expression (< 20th percentile), and the associated P‐value was calculated.
Survival was also assessed across 377 primary Group 3 and Group 4 MB samples, profiled on the Affymetrix Gene 1.1 ST array as previously described, normalized using the RMA method, but subgrouped using similarity network fusion (GSE85217) (Cavalli et al., 2017). Overall survival was analyzed by the Kaplan–Meier method, and P‐values were reported using the log‐rank test. The Cox's proportional hazards model for survival‐time (time‐to‐event) outcomes was calculated using log2‐transformed gene expression as the predictor. All statistical analyses were performed in the r statistical environment (v3.3.3), using r packages survival (v2.40‐1), and ggplot2 (v2.2.1).
2.11. Intracerebellar transplantation
The University of Manitoba Animal Care Committee approved all procedures. Dissociated tumorspheres from D283 scramble and OTX2 KD or D283 control and D283 SEMA4D OE tumorspheres were injected into the cerebellum of 5‐ to 7‐week‐old NOD‐SCID mice. Animals were anesthetized and injected with 2 × 10⁵, 1 × 10⁵, or 5 × 104 MB cells. When animals reached endpoint after 40–45 days, brains were perfused and samples extracted and prepared for histopathological analysis as previously described (Kaur et al., 2015).
For immunohistochemical staining, antigen retrieval was performed by boiling in citrate buffer (pH 6.0) for 20 min followed by a 30 min cool down. Samples were blocked for 1 h at RT with 10% sheep serum in PBS. Primary antibody (Ki67, Cell Signaling Technology, Danvers, MA, USA; 1 : 800 or SEMA4D, Sigma‐Aldrich, Oakville, ON, Canada; 1 : 75) in 1% sheep serum in PBS was applied overnight at 4 °C. Samples were then incubated for 2 h at RT in secondary biotin anti‐mouse or anti‐rabbit antibody (Jackson ImmunoResearch, West Grove, PA, USA; 1 : 500). Streptavidin antibody (Jackson ImmunoResearch, 1 : 400) was applied for 30 min at RT followed by 2 min (Ki67) or 30 s (SEMA4D) in DAB. Samples were counterstained, dehydrated, and mounted with Permount.
2.12. Statistical tests
Statistical analyses were performed using prism 5 software (GraphPad Software, La Jolla, CA, USA). One‐way ANOVAs and Tukey's tests for multiple comparisons were employed for OTX2 siRNA tumorsphere data. Tumor data were analyzed using an independent sample one‐tailed t‐test with Welch's correction. Recombinant Fc protein tumorsphere data and dual OTX2/SEMA gene KD data were analyzed using a one‐way ANOVA followed by a Dunnett's test for multiple comparisons. Normalized ROCK inhibitor data were analyzed using a two‐way ANOVA followed by Dunnett's test. All data are reported as a mean ± standard error of the mean (SEM). A P‐value less than 0.05 was considered significant.
3. Results
3.1. OTX2 knockdown decreases MB self‐renewal while increasing differentiation from tumorspheres in vitro
We previously showed that OTX2 knockdown (KD) decreases self‐renewal capacity in the D283 and D341 cell lines (Kaur et al., 2015). To further validate this effect on self‐renewal, we knocked down OTX2 in D283, D425, and D341 Group 3 tumorspheres as well as the recently established HD‐MB03 (Milde et al., 2012) and MB3W1 (Dietl et al., 2016) Group 3 primary cell lines (Fig. 1A, Fig. S1A,E). OTX2 KD in all 5 cell lines resulted in a significant decrease in tumorsphere formation and self‐renewal capacity (Fig. 1B–G, Fig. S1B–D, F–H). We previously demonstrated that OTX2 KD decreases cell growth and viability in tumorsphere culture (Kaur et al., 2015); however, we did not determine whether these effects were also accompanied by increased differentiation. To explore this, we evaluated the expression of neuronal differentiation markers following OTX2 KD by qPCR and immunofluorescence staining (IF). TUJI (βIII‐tubulin) and MAP2 transcript levels were strongly upregulated in D283 tumorspheres following OTX2 KD (Fig. 1H,I). Similarly, βIII‐tubulin was upregulated by IF in D283 and D425 tumorspheres following OTX2 KD (Fig. 1J,K). These results extend our previous findings in established cell lines and reveal that OTX2 KD also decreases self‐renewal capacity in recently derived Group 3 MB cells while concomitantly increasing neuronal differentiation. Thus, OTX2 is important for regulating the balance between self‐renewal and differentiation in MB cells.
Figure 1.
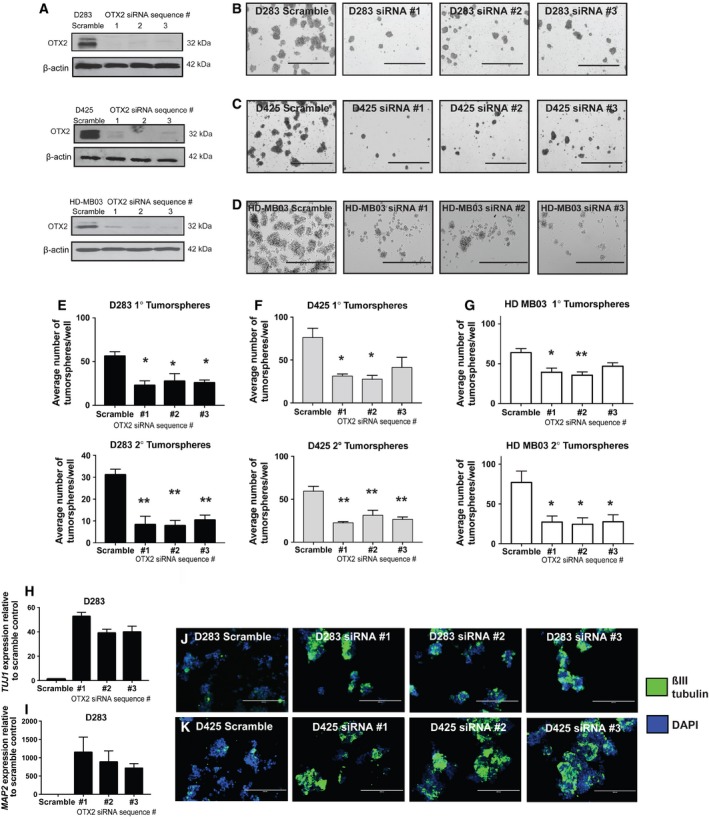
Knockdown of OTX2 in Group 3 and Group 4 MB tumorspheres decreases self‐renewal and increases differentiation. (A) Immunoblot validation of OTX2 knockdown in tumorspheres from the D283 and the D425 MB cell lines as well as the recently derived HD‐MB03 cell line using three independent siRNA sequences relative to scramble siRNA. β‐Actin serves as a loading control. (B–D) Representative images of tumorspheres at secondary passage following OTX2 knockdown in D283 (B), D425 (C), and HD‐MB03 (D) cells. Scale bar: 1000 μm. (E–G) Quantification of primary (upper) and secondary (lower) tumorsphere number in D283 (E) D425 (F) and HD‐MB03 (G) tumorspheres following OTX2 knockdown. Error bars: SEM. P < 0.05*, P < 0.01**. For all experiments, N = 3 or N = 4 biological replicates or independent transfections for each siRNA. (H, I) TUJ1 (βIII‐tubulin) (H) and MAP2 (I) expression following OTX2 knockdown using three siRNA sequences in D283 tumorspheres by qPCR. Error bars: SEM. N = 3 biological replicates. (J, K) Immunofluorescent staining of D283 (J) and D425 (K) tumorspheres for βIII‐tubulin following OTX2 knockdown using three siRNA sequences. Scale bar: 200 μm.
3.2. OTX2 knockdown decreases growth and tumor‐initiating capacity in vivo
We next evaluated the effects of OTX2 KD on tumor growth and tumor‐initiating capacity, a feature associated with cancer stem cell function (Clarke et al., 2006; de Sousa e Melo et al., 2017), in vivo. We previously generated stable D283 OTX2 KD cells using two shRNA sequences (Kaur et al., 2015). Stable OTX2 KD results in a significant decrease in tumorsphere number and cell growth, albeit to a lesser extent than the OTX2 KD siRNA (Kaur et al., 2015). Thus, we are able to expand the cells just enough to utilize for in vivo studies. Here, we generated new stable OTX2 KD cells using the same validated two shRNA sequences (Fig. 2A) and injected 2 × 10⁵ cells derived from tumorspheres for both D283 scramble (N = 8) and D283 OTX2 KD (sequence #2) cells (N = 7) into the cerebellum of NOD‐SCID mice. Tumors derived from OTX2 KD tumorspheres (0.7 ± 0.3 mm2) were significantly smaller than those derived from scramble controls (3.6 ± 1.4 mm2) (Fig. 2B,C). Importantly, limiting dilution analysis comparing tumor growth from 2 × 10⁵, 1 × 10⁵, and 5 × 10⁴ D283 scramble relative to D283 OTX2 KD tumorsphere cells revealed a decrease in tumor‐initiating capacity following OTX2 KD (Fig. 2D). Only small nests of tumor cells were observed, if any, following injection of 5 × 10⁴ D283 OTX2 KD cells (Fig. 2D). This was supported by a decrease in Ki67 staining for tumor cell proliferation in D283 OTX2 KD tumors (Fig. 2E). Taken together, these results demonstrate that OTX2 contributes to both tumor growth and tumor initiation from MB tumorspheres in vivo.
Figure 2.
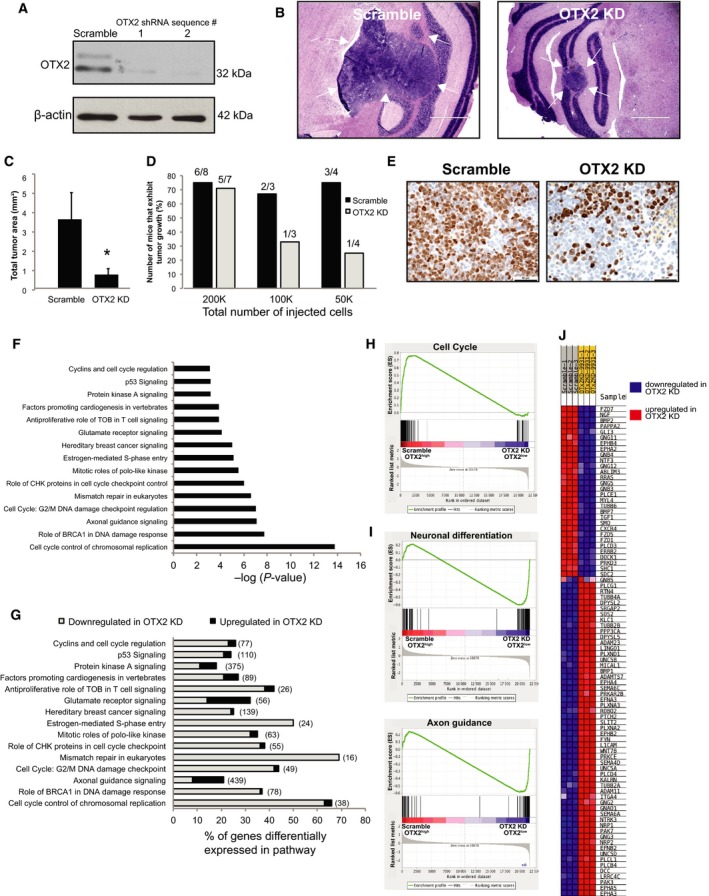
OTX2 knockdown decreases tumor growth and tumor‐initiating capacity in vivo and increases levels of neuronal differentiation and axon guidance genes. (A) Immunoblot validation of stable OTX2 knockdown in D283 cells using two shRNA sequences relative to scramble control. β‐Actin serves as a loading control. (B) Representative images of tumors derived from D283 scramble or D283 OTX2 knockdown cells following injection into the cerebellum of NOD SCID mice. Scale bar: 1000 μm. Arrows denote intracerebellar tumors from each. (C) Quantification of tumor area following intracerebellar injection of 2 × 10⁵ D283 scramble (N = 8) or OTX2 knockdown (N = 7) tumorsphere cells. Error bars: SEM. P < 0.05*. (D) Limiting dilution analysis of tumors derived from D283 scramble relative to D283 OTX2 knockdown tumorspheres following intracerebellar injection. OTX2 knockdown cells exhibit a decrease in tumor‐initiating capacity as indicated by the lower number of animals displaying evidence of tumor growth. Scale bar: 1000 μm. (E) Representative images of Ki67 staining in tumors derived from D283 scramble or D283 OTX2 knockdown cells following injection into NOD SCID mice. Scale bar: 50 μm. (F,G) IPA analysis showing major pathways (F) affected by OTX2 knockdown in D283 tumorspheres and the frequency of genes within these pathways (G) that are upregulated (black) and downregulated (gray). (H) Gene set enrichment analysis (GSEA) demonstrating enrichment of genes associated with cell cycle in the control scramble D283 tumorspheres. (I) GSEA demonstrating that neuronal differentiation and axon guidance genes are enriched in genes sets that are downregulated in the scramble and upregulated in the OTX2 KD D283 tumorspheres. (J) Representative heat map of genes that are significantly downregulated (blue) and upregulated (red) following OTX2 knockdown in D283 tumorspheres. Note that the majority of genes are upregulated following OTX2 knockdown.
3.3. OTX2 expression is negatively correlated with the majority of axon guidance genes in MB
We next sought to evaluate the molecular mechanisms by which OTX2 regulates MB stem/progenitor cells. We performed global gene expression analysis using Human Gene 2.0 microarrays to compare the molecular profiles of D283 OTX2‐expressing (OTX2high) scramble tumorspheres relative to OTX2 KD (OTX2low) tumorspheres generated by siRNA (Fig. 1A). Of the 3614 significantly and differentially (P < 0.05 and ±2fold) expressed transcripts in OTX2high relative to OTX2low tumorspheres, pathways associated with cell cycle and neuronal differentiation/axon guidance, including ephrin, netrin, slit, and semaphorin (SEMA) signaling, represented the top dysregulated networks (Fig. 2F,G; Tables S3 and S4). This was further supported by GSEA that demonstrated an enrichment of genes associated with cell cycle in the OTX2high tumorspheres (Fig. 2H), whereas enrichment of genes associated with neuronal differentiation and axon guidance (Fig. 2I) was observed in the OTX2low tumorspheres. IPA downstream effects analysis confirmed these findings with 85 of 252 differentially expressed neural development genes exhibiting measurement directions consistent with an increase in neuronal differentiation (Z‐score: 3.2) (Table S3). Of the 90 axon guidance gene transcripts that were significantly and differentially expressed, 57 (or 63%) were upregulated following OTX2 KD (Fig. 2J, Table S4).
To determine whether axon guidance genes are directly or indirectly regulated by OTX2, chromatin immunoprecipitation (ChIP) sequencing (ChIP‐Seq) was performed on OTX2high D283 tumorspheres. A clear, statistically significant association was observed between differential expression of axon guidance genes and the presence of one or more OTX2 binding peaks within −5 kb to +2 kb of the transcription start site (TSS) for each gene (Fisher's exact test; P < 2.2e‐16) (Table S5). Semaphorin (SEMA) signaling was the most overrepresented pathway. SEMA genes are classically known as inhibitory axon growth cone guidance cues, but have also been found to play prominent roles in tumor cell proliferation, survival, cell adhesion, angiogenesis, and migration in other cancers (Neufeld et al., 2016). The SEMA ligands are membrane‐bound or secreted proteins that mediate their effects mainly through plexin (PLXN) receptors with neuropilins (NRPs) often serving as coreceptors (Neufeld et al., 2016). The transmembrane protein L1CAM interacts with neuropilin 1 (NRP1) and is also a coreceptor (Neufeld et al., 2016). Of the nine SEMA ligands or receptors negatively correlated with OTX2 expression, five genes exhibited OTX2 overlaps/binding peaks and two genes (NRP1 and SEMA6C) display OTX2‐binding motifs (TAATCT and/or TAATCC) within the region of the TSS. As expression of all SEMA pathway genes was upregulated following OTX2 KD, our results suggest that OTX2 may serve as a direct or indirect repressor of SEMA signaling.
3.4. Axon guidance genes are negatively correlated with OTX2 expression in MB tumorspheres as well as Group 3 and Group 4 patient samples
We next validated the negative correlation between OTX2 and SEMA gene expression at the transcript and/or protein levels in MB cell lines as well as Group 3 and Group 4 patient samples. Select SEMA pathway genes, including the SEMA ligands (SEMA4D, SEMA6A) and receptors (NRP1, L1CAM, PLXNA2) (Fig. S2A–C) as well as several members of other axon guidance gene families (Fig. S3A,B), were evaluated in OTX2high scramble and OTX2low (OTX2 KD) MB tumorspheres by qPCR. In all cell lines, OTX2 expression was negatively correlated with all axon guidance gene transcript levels (Figs S2 and S3).
Importantly, significant correlations between OTX2 and axon guidance pathway genes were also observed in patient samples. Using fully annotated Affymetrix Gene 1.1 ST Array datasets (Northcott et al., 2012; Remke et al., 2011), we compared transcript levels of axon guidance genes in those Group 3 and 4 tumors that exhibit amplification or OE of OTX2 and those that do not using a Pearson correlation coefficient and a FDR < 0.1. Forty axon guidance genes showed a significant correlation with OTX2 expression (Table 1). Of these 40 genes, 27 (68%) were negatively correlated with OTX2 expression (Table 1). Interestingly, SEMA signaling was also the most overrepresented pathway in this dataset with five genes (SEMA6A, SEMA4D, NRP1, NRP2, and L1CAM) all exhibiting a negative correlation with OTX2 expression (Table 1). Cavalli et al. (2017) have recently shown that using a combination of genomewide DNA methylation and transcriptome profiling, Group 3 and Group 4 tumors could be further distinguished as separate entities. Using this larger dataset, we also evaluated survival based on expression of these 5 SEMA genes in Group 3 and Group 4 combined (n = 377), as well as Group 3 (n = 113) and Group 4 (n = 264) individually. Interestingly, univariable cox regression analysis of SEMA4D expression revealed a very significant inverse correlation with decreasing expression of SEMA4D in the combined Group 3 and Group 4 cohorts, and within Group 4 alone, but not in Group 3 alone (Table S6A). Similar results were obtained using top and bottom 20% SEMA4D expression within each subgroup, as lower levels of SEMA4D were associated with worse prognosis in Group 3 and Group 4 combined as well as Group 4 MB tumors alone (Fig. 3A). However, SEMA6A, NRP1, NRP2, and L1CAM were not significantly associated with outcome (Table S6B).
Table 1.
Correlation between OTX2 and expression of axon guidance genes in Group 3 and 4 MB patient samples. Genes exhibiting a statistically significant negative correlation are depicted in blue and those exhibiting a positive correlation are shown in red. FDR < 0.1
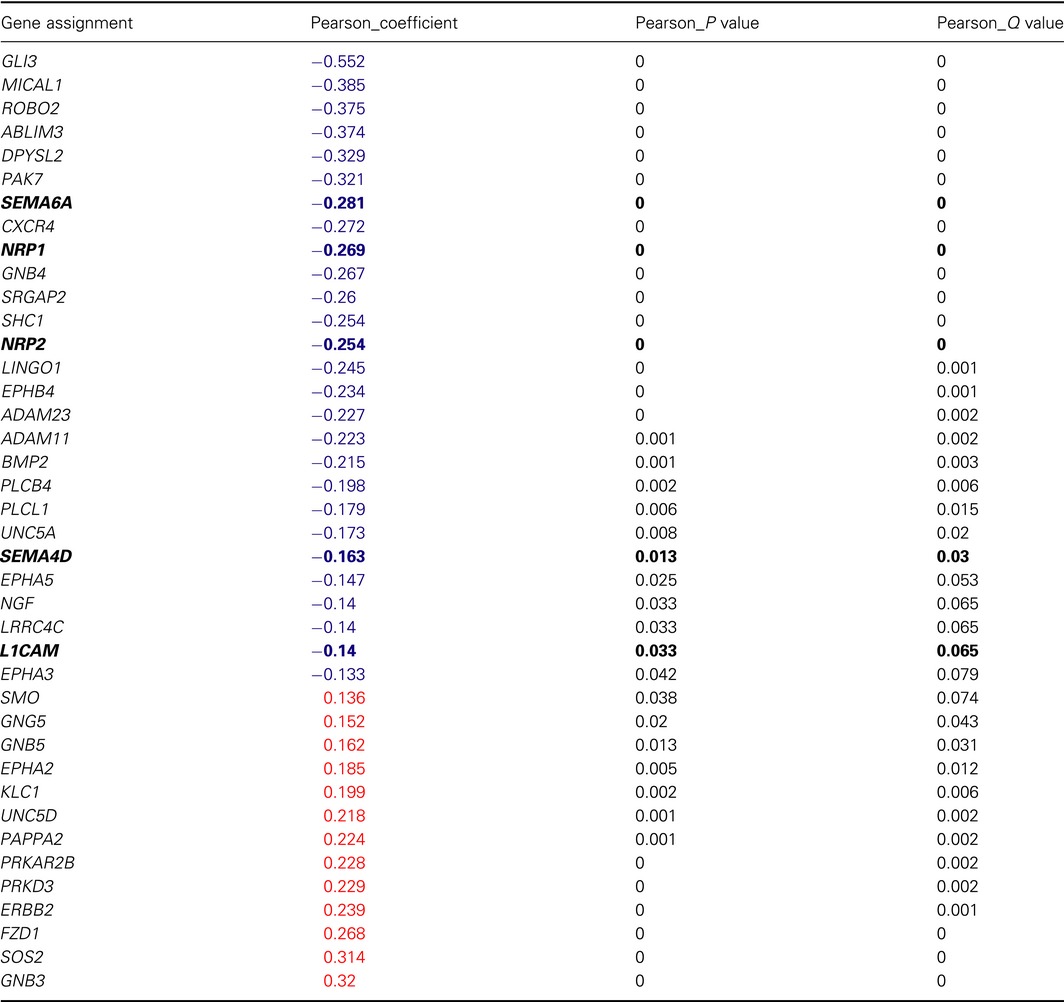
Semaphorin pathway genes are highlighted in bold.
Figure 3.
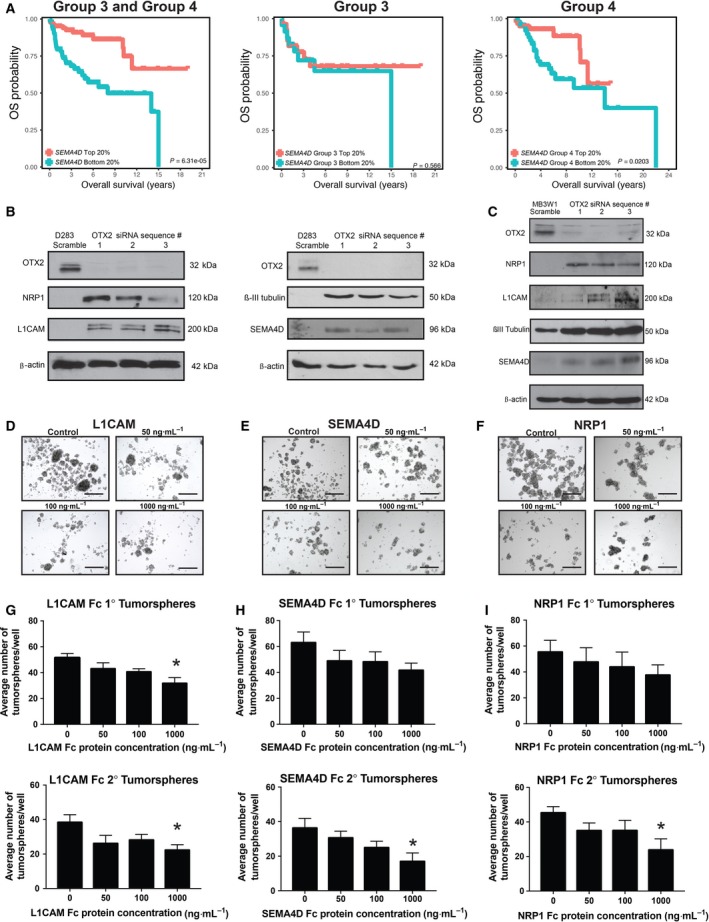
Semaphorin genes are negatively correlated with OTX2 expression and self‐renewal in MB tumorspheres. (A) Kaplan–Meier curves of Group 3 and Group 4 patients with high (red) and low (blue) SEMA4D expression for Group 3 and Group 4 combined (left), Group 3 alone (middle), and Group 4 alone (right). (B) Immunoblots depicting increases in NRP1, L1CAM, PLXNA2, SEMA4D, and βIII‐tubulin protein levels following OTX2 knockdown in D283 tumorspheres. β‐Actin serves as a loading control. (C) Immunoblots depicting increases in NRP1, L1CAM, SEMA4D, and βIII‐tubulin protein levels following OTX2 knockdown in MB3W1 tumorspheres using three siRNA sequences. β‐Actin serves as a loading control. (D–F) Representative images of D283 tumorspheres following 5‐day treatment with recombinant L1CAM Fc (D), SEMA4D Fc (E), or NRP1 Fc (F) chimera protein. N = 4 biological replicates. (G–I) Total number of primary (upper) and secondary (lower) tumorspheres following 5‐day treatment with L1CAM Fc (G) SEMA4D Fc (H) or NRP1 Fc chimera protein (I). N = 4 biological replicates. Error bars: SEM. P < 0.05*. Scale bar: 400 μm.
Of the five SEMA pathway genes negatively correlated with OTX2 expression in patient samples, L1CAM and NRP1 were most strongly upregulated following OTX2 KD in tumorspheres (Fig. S2) and SEMA4D was associated with prognosis (Fig. 3A). Thus, we chose these three genes for additional analyses at the protein level. Upon OTX2 KD, we observed an increase in L1CAM, NRP1, and SEMA4D protein concomitant with an increase in βIII‐tubulin by immunoblot in D283 and MB3W1 tumorspheres (Fig. 3B,C). Collectively, these results provide further support for the idea that axon guidance genes, particularly those belonging to the SEMA signaling pathway, are putative tumor suppressors in Group 3 and Group 4 MB and that SEMA4D is a novel prognostic indicator specifically in Group 4.
3.5. Increased SEMA gene levels are inversely correlated with tumorsphere formation, self‐renewal, and growth
Next, as proof of principle, we tested how modulation of OTX2 and SEMA pathway gene expression affects MB stem cell self‐renewal and growth in vitro. Recombinant human L1CAM, SEMA4D, and NRP1 Fc chimera proteins were added to D283 tumorsphere cultures (50–1000 ng·mL−1) and evaluated over passage (Fig. 3D–I). Increasing concentrations of recombinant SEMA4D Fc, L1CAM Fc, and NRP1 Fc chimera resulted in a dose‐dependent decrease in both primary and secondary tumorsphere formation (Fig. 3D–I) without affecting growth and viability (Fig. S4); however, only the highest concentration (1000 ng·mL−1) was significant. We also asked whether SEMA4D, NRP1, and L1CAM contribute to the OTX2 KD phenotype by performing dual OTX2/SEMA gene knockdown experiments in D283 tumorspheres (Fig. 4A–C). OTX2 was knocked down using 1 of our validated siRNA sequences at day 0 (s9931 or s9932, as these resulted in the most significant phenotypic change; Fig. 1), and then at day 2, cells were treated with either two independent SEMA4D, NRP1, or L1CAM siRNA sequences or a nonsilencing (scramble) siRNA negative control. While no rescue in tumorsphere formation or cell number was evident in OTX2 KD/L1CAM KD tumorspheres (Fig. 4D, G, J), we observed a partial rescue in both tumorsphere formation and cell number for both OTX2 KD/SEMA4D KD and OTX2 KD/NRP1 KD tumorspheres (Fig. 4E, F, H, I, K, L). Similar increases in tumorsphere size and cell number were observed following dual OTX2/SEMA4D or OTX2/NRP1 KD in MB3W1 tumorspheres (Fig. S5). For both D283 and MB3W1, there was no significant change in viability as measured by Trypan blue staining following dual KD (Fig. S6). Collectively, these results provide further evidence that SEMA genes are associated with a tumor‐suppressive role and contribute to the OTX2 KD phenotype in MB tumorspheres.
Figure 4.
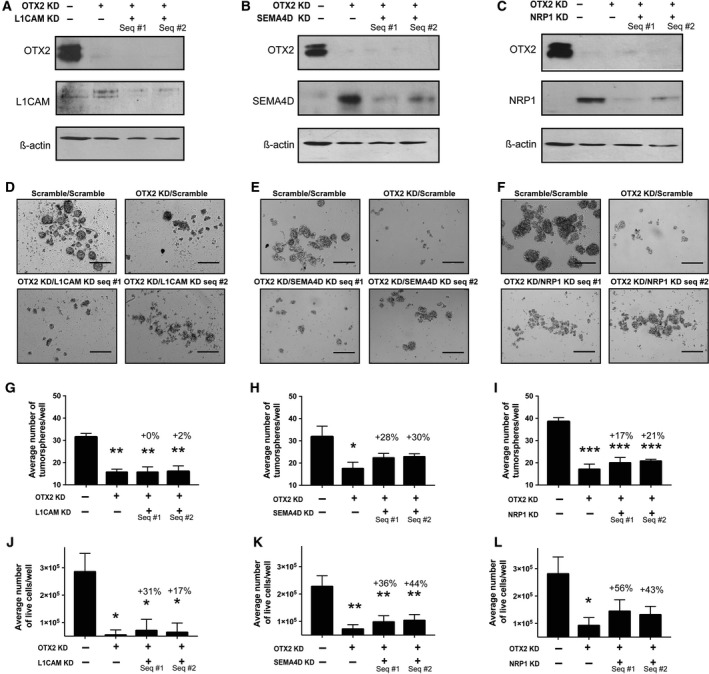
Decreased levels of semaphorin pathway genes in OTX2 KD cells result in a partial rescue of tumorsphere formation and growth. (A–C) Immunoblots depicting OTX2 and either L1CAM (A) SEMA4D (B) or NRP1 (C) protein levels following dual OTX2 and L1CAM, SEMA4D, or NRP1 knockdown in D283 tumorspheres over 5 days. β‐Actin serves as a loading control. (D–F) Representative images of D283 tumorspheres following dual OTX2 and either L1CAM (D), SEMA4D (E), or NRP1 (F) knockdown. Scale bar: 400 μm. (G–I) Quantification of tumorsphere number following dual OTX2 and either L1CAM (G), SEMA4D (H), or NRP1 (I) knockdown in D283 tumorspheres over 5 days. Note the partial recovery of tumorsphere number in the SEMA4D and NRP1 double knockdowns. Error bars: SEM. P < 0.05*, P < 0.01**, P < 0.001***. For all experiments, N = 3 or N = 4 biological replicates. (J–L) Quantification of total live cell number following dual OTX2 and either L1CAM (J), SEMA4D (K), or NRP1 (L) knockdown in D283 tumorspheres over 5 days. Error bars: SEM. P < 0.05*, P < 0.01**. For all experiments, N = 3–8 biological replicates.
3.6. OTX2 limits RHO pathway activation
Next, we investigated the downstream pathways known to mediate the effects of SEMA and other axon guidance gene signaling such as RHO and MAPK (both ERK1/2 and p38) in OTX2 KD cells. Further interrogation of our gene expression profiling data revealed that RHO and MAPK signaling pathways were differentially expressed in OTX2high relative to OTX2low tumorspheres (Table S7). Genes associated with L1CAM interactions as well as SEMA interactions/SEMA4D signaling including the RHO pathway members ROCK1/ROCK2 and several RHO guanine nucleotide exchange factors were significantly enriched in gene sets that were upregulated following OTX2 KD (Fig. 5A, B, D; Table S8). Similarly, genes associated with MAPK signaling (both ERK1/2 and p38) were enriched in gene sets that were upregulated in the OTX2 KD cells; however, there was also enrichment in the scramble controls (Fig. 5C). In support of these findings, we observed an increase in RHO activity in D283 tumorspheres as well as HD‐MB03 tumorspheres following OTX2 KD (Fig. 5E, F) while MAPK pathway activation (both ERK1/2 and p38) was inconsistent (data not shown).
Figure 5.
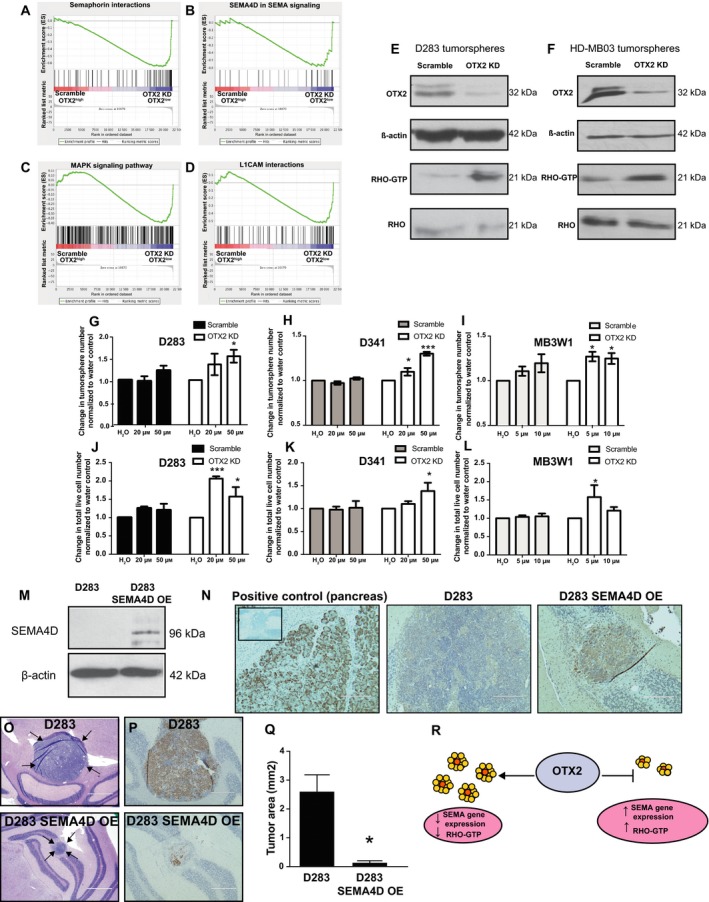
OTX2 levels are negatively correlated with activation of RHO signaling. (A–D) Gene set enrichment analysis (GSEA) demonstrating that genes associated with SEMA interactions (A), SEMA4D signaling (B), MAPK signaling (C), and L1CAM interactions (D) were enriched in genes sets that are downregulated in the scramble and upregulated in the OTX2 KD D283 tumorspheres. (E,F) Detection of the GTP‐bound form of active RHO in a pull‐down assay from scramble and OTX2 KD D283 (E) and HD‐MB03 (F) tumorsphere lysates. β‐Actin serves as a loading control for OTX2. Total RHO serves as a loading control for RHO‐GTP. (G–L) Treatment of D283 (G,J) and D341 (H,K) and MB3W1 (I,L) scramble (SC) and OTX2 KD tumorspheres with the RHO‐associated, coiled‐coil containing protein kinase (ROCK) inhibitor Y‐27632 results in a significant increase in tumorsphere number and total live cell number specifically in OTX2 KD cells relative to H2O controls, N = 3 biological replicates for D283 and MB3W1; N = 4 biological replicates for D341. Error bars: SEM. P < 0.05*, P < 0.001***. In addition to the treatment effects within the OTX2 KD cells, there was also a statistically significant difference between the scramble and the OTX2 KD tumorspheres in (H) (P < 0.001***) and (J) (P < 0.01**). Note that for MB3W1, higher concentrations were toxic; thus, the assays were performed at 5 and 10 μm. (M) Immunoblot validation of stable SEMA4D OE in D283 tumorspheres. β‐Actin serves as a loading control. (N) Representative images of SEMA4D staining in the pancreas (positive control for SEMA4D expression) (left) as well as tumors derived from D283 (middle) or D283 SEMA4D OE (right) following injection into NOD SCID mice. Inset: secondary antibody only negative control. Scale bar: 200 μm. (O) Representative images of tumors derived from D283 control or D283 SEMA4D OE tumorspheres following injection into the cerebellum of NOD SCID mice. Scale bar: 1000 μm. Arrows denote intracerebellar tumors from each. (P) Representative images of Ki67 staining in tumors derived from D283 control or D283 SEMA4D OE tumorspheres following injection into the cerebellum of NOD SCID mice. Scale bar: 400 μm. (Q) Quantification of tumor area in the vermis following intracerebellar injection of 2 × 10⁵ D283 control or D283 SEMA4D OE tumorsphere cells. Error bars: SEM. P < 0.05*. (R) Working model depicting the relationship between OTX2, SEMA gene expression, and RHO activity. OTX2 levels are inversely correlated with SEMA gene expression and RHO activity. Increased expression of SEMA genes and RHO activity is associated with decreased self‐renewal and growth and a more differentiated phenotype.
To further interrogate the functional role of the RHO pathway in MB stem/progenitor cells, we treated scramble and OTX2 KD tumorspheres from D283, D341, and MB3W1 cells with the Y‐27632 ROCK inhibitor. While ROCK inhibition had no significant effect on tumorsphere formation or cell number in scramble controls, there was a statistically significant increase in OTX2 KD tumorsphere number and cell number in all three cell lines (Fig. 5G–L). Viability was significantly increased in D283 tumorspheres when treated with 20 μm ROCK only (data not shown). These results reveal a novel inhibitory role for the RHO pathway in MB stem/progenitor cells. Thus, both SEMA genes and their downstream effectors are negatively correlated with the OTX2‐driven phenotype in MB tumorspheres.
3.7. Stable overexpression of SEMA4D inhibits localized tumor growth in vivo
Finally, as SEMA4D is a novel prognostic indicator in Group 3 and Group 4 patients, is associated with a decrease in self‐renewal, and growth and is an upstream regulator of RHO activity, we evaluated the effect of this candidate gene on tumor growth in vivo. We generated stable D283 SEMA4D overexpressing (OE) tumorspheres (Fig. 5M) and injected 2 × 10⁵ D283 SEMA4D OE and corresponding D283 control tumorspheres into the cerebellum of NOD SCID mice (N = 4 for each). SEMA4D OE was sustained in vivo (Fig. 5N), and as expected, compared with D283 control tumors, D283 SEMA4D OE tumors displayed significantly less localized growth in the vermis as demonstrated by a decrease in Ki67 staining (Fig. 5O, P) as well as a significant decrease in tumor area (2.6 ± 0.6 mm2 in D283 vs. 0.1 ± 0.07 mm2 in D283 SEMA4D OE) (Fig. 5Q). However, two of the D283 SEMA4D OE animals exhibited extensive subarachnoid space tumor cell spread (data not shown), suggesting that SEMA4D may be contributing to a phenotypic switch in vivo.
4. Discussion
We have defined an OTX2‐driven stem cell program in Group 3 and Group 4 MB. Brain tumor cells grown in stem cell conditions more closely retain the genotype and phenotype of primary tumors compared with serum‐cultured lines (Lee et al., 2006). Interestingly, Di et al. (2005) previously showed that all trans‐retinoic acid (ATRA) downregulates OTX2 expression and inhibits OTX2+ MB cell growth in vitro. However, subsequent testing of ATRA and other retinoic acids in tumorspheres and in intracranial transplant models rendered the cells resistant to treatment (Bai et al., 2010). Thus, tumorspheres grown in stem cell‐enriched conditions are the most biologically relevant in vitro model system for characterizing the OTX2 regulatory network. This is supported by changes in OTX2 levels during the later stages of human cerebellar development where OTX2 is expressed in the more primitive progenitor cells of the external granular layer (EGL) but is not detected postnatally (de Haas et al., 2006).
We have identified novel associations between OTX2 and a large cohort of axon guidance genes and their downstream targets in Group 3 and Group 4 MB stem/progenitor cells. The majority of genes associated with axon guidance pathways were negatively correlated with OTX2 expression and self‐renewal suggesting a novel tumor‐suppressive role in these tumors. Importantly, this negative correlation was demonstrated in recently derived cell lines (Dietl et al., 2016; Milde et al., 2012) as well as primary patient samples with SEMA4D serving as a novel prognostic indicator in Group 4 MB tumors. The family of genes that regulate axon guidance has been found to play prominent roles in neuronal migration, motility, and tumor progression, but to our knowledge, it has never been associated with stem/progenitor cell populations in highly aggressive MB. Our results also extend current knowledge that axon guidance genes can undergo alternative splicing in MB tumors (Dubuc et al., 2012). Interestingly, several differentially expressed SEMA genes such as SEMA6A (Renaud et al., 2008), PLXNA2 (Renaud et al., 2008), NRP1 (Telley et al., 2016), and L1CAM (Huang et al., 2013) have been shown to play a role in cerebellar development further underscoring the notion that an early cerebellar stem/progenitor is the cell of origin for Group 3 and Group 4 MB. Indeed, a large number of neuronal differentiation genes (Table S3) including, but not limited to, CBLN1, NEUROD1, NR2F1, and NRXN1 (Schuller et al., 2006; Uemura et al., 2010) have been implicated in cerebellar morphology and/or granule cell development thus further validating the biological relevance of the tumorsphere model system.
We propose a working model in which OTX2 promotes MB self‐renewal/growth and suppresses differentiation by inhibiting the expression of several classes of axon guidance genes, including SEMA pathway genes, and their downstream effectors (Fig. 5R). A recent study has shown that SEMA genes regulate brain tumor stem cell survival. Specifically, the SEMA ligand SEMA3C controls glioblastoma stem cell survival though RAC1 activation (Man et al., 2014), suggesting that the effect of SEMA genes on brain tumor stem cells is cell context specific. Moreover, as our dual OTX2/SEMA gene KD studies only resulted in a partial rescue of tumorsphere formation and cell growth, additional OTX2‐axon guidance signaling pathways will need to be explored. The partial rescue was not surprising given the fact that OTX2 KD resulted in expression changes in 3614 genes. For example, ephrin/EPH family genes were also negatively correlated with OTX2 expression in our global gene expression (Table S4) and patient sample datasets (Table 1). As EPH and SEMA signaling share many downstream targets including the RHO family of GTPases, the role of OTX2‐EPH signaling in regulating MB self‐renewal will need to be examined.
Our results demonstrate that OTX2 is either a direct or indirect repressor of SEMA gene expression. OTX2 binding at genomic regions of SEMA genes that lack OTX2 binding motifs suggests that OTX2 can cooperate with a complex of factors to restrict SEMA gene expression in Group 3 and Group 4 MB. While two SEMA genes exhibited OTX2 enrichment at TAATCT and/or TAATCC OTX2 binding motifs, these sequences are not specific to OTX2; thus, additional experiments to define the mechanism by which OTX2 binds to these axon guidance genes are needed. Interestingly, Bai et al. (2012) showed that OTX2 represses myogenic differentiation by binding to the 258 bp MYOD1 core enhancer through its homeodomain in MB cells. In this study, the authors also suggested that OTX2 may recruit yet unidentified additional factors that will aid in suppressing multiple differentiation pathways (Bai et al., 2012). Bunt et al. (2012) proposed that the transcription factors NEUROD1 and NR2F1, both direct targets OTX2, may contribute to OTX2‐mediated regulation of differentiation, but the functional roles of these two proteins were not studied. Indeed, NEUROD1 and NR2F1 were both significantly upregulated following OTX2 KD in our MB tumorspheres (Table S3). In addition, OTX2 is associated with regulation of histone modifications (Bunt et al., 2013) and has recently been found to cooperatively control the active enhancer landscape in Group 3 MB (Boulay et al., 2017). Therefore, OTX2 may colocalize with specific histone modifications (i.e. H3K4me3 or H3K27me3) on select axon guidance pathway genes to regulate self‐renewal and differentiation. As axon guidance pathways have been shown to be critical regulators of invasion and metastasis in other cancers (Neufeld et al., 2016), it will also be imperative to evaluate the effects of SEMA pathway genes on Group 3 and Group 4 MB motility and metastasis. For example, the SEMA3B ligand has been shown to inhibit tumor cell growth while increasing metastatic dissemination in melanoma and nonsmall cell lung carcinoma cells (Rolny et al., 2008). OE of SEMA4D in our model system decreased localized tumor growth but an increase in subarachnoid space spread was observed. However, these studies were performed in a small number of animals and would need to be repeated with a larger cohort. Other axon guidance cues have shown variable effects on MB cell motility with NETRIN‐1 serving as a positive regulator of invasion (Akino et al., 2014), while SLIT2 inhibits MB invasion (Werbowetski‐Ogilvie et al., 2006). We have previously shown that higher self‐renewing MB tumorspheres exhibit a downregulated motility transcription program (Morrison et al., 2013). This raises the intriguing possibility that the effects of axon guidance genes on MB cells will be dependent on cellular phenotype.
Our results open up new avenues for studying the effects of the RHO family of small GTP‐binding proteins in MB stem/progenitor cells. SEMA4D signaling has been shown to either activate or inactivate RHO depending on the coupling of the PLXNB1 receptor with the ERBB2 or MET receptor tyrosine kinase (Swiercz et al., 2008). For example, through the involvement of a PLXN‐associated PDZ‐RHO‐GEF, RhoA activates cell migration via the PLXN‐ERBB2 complex in normal neural stem‐like cells (Swiercz et al., 2008). In our MB models, increased RHO activity is associated with a more differentiated phenotype, and this is consistent with previous findings in glioblastoma stem cells in which ROCK inhibitor treatment enhanced tumorsphere formation (Tilson et al., 2015).
In summary, we have found that OTX2 is a critical regulator of Group 3 and Group 4 self‐renewal and differentiation through modulation of a large cohort of axon guidance genes and downstream targets such as RHO activity. Our study offers novel mechanistic insights into MB self‐renewal and presents an informed framework to pursue novel targeted therapies aimed at axon guidance gene pathways to facilitate differentiation of MB cells.
Author contributions
MS and TEW‐O contributed to conception and design, collection and/or assembly of data, data analysis and interpretation, manuscript writing, and final approval of manuscript. NT, LCM, and RK contributed to collection and/or assembly of data, and final approval of manuscript. MW and TM contributed to data collection and final approval of manuscript. JZ, GP, PS, VR, MRDB, and MDT contributed to data analysis and interpretation, and final approval of manuscript.
Supporting information
Fig. S1. Knockdown of OTX2 in Group 3 and Group 4 MB decreases tumorsphere formation and self‐renewal.
Fig. S2. Semaphorin genes are negatively correlated with OTX2 expression in Group 3 and Group 4 MB cells.
Fig. S3. Axon guidance gene expression is upregulated following OTX2 knockdown in Group 3 and Group 4 MB cells.
Fig. S4. Recombinant semaphorin protein treatment does not significantly affect cell number or viability of D283 tumorspheres.
Fig. S5. Decreased levels of semaphorin pathway genes in MB3W1 OTX2 KD cells results in a partial rescue of tumorsphere formation and growth.
Fig. S6. Decreased levels of semaphorin pathway genes in D283 and MB3W1 OTX2 KD tumorspheres does not significantly affect viability.
Table S1. List of antibodies and concentrations used for Western blots.
Table S2. List of primers sequences used for qPCR.
Table S3. Neuronal differentiation genes that are significantly and differentially expressed following OTX2 knockdown in D283 tumorspheres.
Table S4. Axon guidance genes that are significantly and differentially expressed following OTX2 knockdown in D283 tumorspheres.
Table S5. Axon guidance pathway genes that were significantly and differentially expressed following OTX2 KD and the number of OTX2 binding peaks/overlaps within −5 kb to +2 kb of their transcriptional start sites.
Table S6. (A) Univariable cox regression analysis of survival by increasing SEMA4D expression across Group 3 and 4 medulloblastoma. (B) Statistical analyses of survival in patients exhibiting high SEMA6A NRP1, NRP2, or L1CAM gene expression relative to patients with low SEMA6A, NRP1, NRP2 or L1CAM gene expression.
Table S7. Gene Set Enrichment Analysis (GSEA) results for Reactome and KEGG databases identified pathways significantly enriched in gene sets that were downregulated in D283 Scramble relative to OTX2 KD tumorspheres.
Table S8. GSEA revealed that genes associated with SEMA4D signaling were enriched in gene sets that were downregulated in D283 scramble relative to OTX2 KD tumorspheres.
Acknowledgements
We thank Monroe Chan at the University of Manitoba Flow Cytometry Facility and Vet Services at the University of Manitoba for technical support. This work was funded by operating funds from the Canada Research Chairs Tier II Program, The Canadian Institutes of Health Research, The Paul H.T. Thorlakson Foundation Fund, the Children's Hospital Research Institute of Manitoba/Kenzie's Kauze, and Alex's Lemonade Stand Foundation. TWO holds a Canada Research Chair in Human Stem Cells and Neuro‐oncology. MDB holds a Canada Research Chair in Developmental Neuropathology.
References
- Acampora D, Mazan S, Lallemand Y, Avantaggiato V, Maury M, Simeone A and Brulet P (1995) Forebrain and midbrain regions are deleted in Otx2‐/‐ mutants due to a defective anterior neuroectoderm specification during gastrulation. Development 121, 3279–3290. [DOI] [PubMed] [Google Scholar]
- Adamson DC, Shi Q, Wortham M, Northcott PA, Di C, Duncan CG, Li J, McLendon RE, Bigner DD, Taylor MD et al (2010) OTX2 is critical for the maintenance and progression of Shh‐independent medulloblastomas. Cancer Res 70, 181–191. [DOI] [PMC free article] [PubMed] [Google Scholar]
- Akino T, Han X, Nakayama H, McNeish B, Zurakowski D, Mammoto A, Klagsbrun M and Smith E (2014) Netrin‐1 promotes medulloblastoma cell invasiveness and angiogenesis, and demonstrates elevated expression in tumor tissue and urine of patients with pediatric medulloblastoma. Cancer Res 74, 3716–3726. [DOI] [PMC free article] [PubMed] [Google Scholar]
- Ang SL, Jin O, Rhinn M, Daigle N, Stevenson L and Rossant J (1996) A targeted mouse Otx2 mutation leads to severe defects in gastrulation and formation of axial mesoderm and to deletion of rostral brain. Development 122, 243–252. [DOI] [PubMed] [Google Scholar]
- Bai R, Siu IM, Tyler BM, Staedtke V, Gallia GL and Riggins GJ (2010) Evaluation of retinoic acid therapy for OTX2‐positive medulloblastomas. Neuro Oncol 12, 655–663. [DOI] [PMC free article] [PubMed] [Google Scholar]
- Bai RY, Staedtke V, Lidov HG, Eberhart CG and Riggins GJ (2012) OTX2 represses myogenic and neuronal differentiation in medulloblastoma cells. Cancer Res 72, 5988–6001. [DOI] [PMC free article] [PubMed] [Google Scholar]
- Beby F and Lamonerie T (2013) The homeobox gene Otx2 in development and disease. Exp Eye Res 111, 9–16. [DOI] [PubMed] [Google Scholar]
- Boulay G, Awad ME, Riggi N, Archer TC, Iyer S, Boonseng WE, Rossetti NE, Naigles B, Rengarajan S, Volorio A et al (2017) OTX2 activity at distal regulatory elements shapes the chromatin landscape of group 3 medulloblastoma. Cancer Discov 7, 288–301. [DOI] [PMC free article] [PubMed] [Google Scholar]
- Bunt J, de Haas TG, Hasselt NE, Zwijnenburg DA, Koster J, Versteeg R and Kool M (2010) Regulation of cell cycle genes and induction of senescence by overexpression of OTX2 in medulloblastoma cell lines. Mol Cancer Res 8, 1344–1357. [DOI] [PubMed] [Google Scholar]
- Bunt J, Hasselt NE, Zwijnenburg DA, Hamdi M, Koster J, Versteeg R and Kool M (2012) OTX2 directly activates cell cycle genes and inhibits differentiation in medulloblastoma cells. Int J Cancer 131, E21–E32. [DOI] [PubMed] [Google Scholar]
- Bunt J, Hasselt NA, Zwijnenburg DA, Koster J, Versteeg R and Kool M (2013) OTX2 sustains a bivalent‐like state of OTX2‐bound promoters in medulloblastoma by maintaining their H3K27me3 levels. Acta Neuropathol 125, 385–394. [DOI] [PubMed] [Google Scholar]
- Cavalli FMG, Remke M, Rampasek L, Peacock J, Shih DJH, Luu B, Garzia L, Torchia J, Nor C, Morrissy AS et al (2017) Intertumoral heterogeneity within medulloblastoma subgroups. Cancer Cell 31, 737–754.e736. [DOI] [PMC free article] [PubMed] [Google Scholar]
- Clarke MF, Dick JE, Dirks PB, Eaves CJ, Jamieson CH, Jones DL, Visvader J, Weissman IL and Wahl GM (2006) Cancer stem cells–perspectives on current status and future directions: AACR Workshop on cancer stem cells. Cancer Res 66, 9339–9344. [DOI] [PubMed] [Google Scholar]
- Croft D, Mundo AF, Haw R, Milacic M, Weiser J, Wu G, Caudy M, Garapati P, Gillespie M, Kamdar MR et al (2014) The Reactome pathway knowledgebase. Nucleic Acids Res 42, D472–D477. [DOI] [PMC free article] [PubMed] [Google Scholar]
- Di C, Liao S, Adamson DC, Parrett TJ, Broderick DK, Shi Q, Lengauer C, Cummins JM, Velculescu VE, Fults DW et al (2005) Identification of OTX2 as a medulloblastoma oncogene whose product can be targeted by all‐trans retinoic acid. Cancer Res 65, 919–924. [PubMed] [Google Scholar]
- Dietl S, Schwinn S, Dietl S, Riedel S, Deinlein F, Rutkowski S, von Bueren AO, Krauss J, Schweitzer T, Vince GH et al (2016) MB3W1 is an orthotopic xenograft model for anaplastic medulloblastoma displaying cancer stem cell‐ and Group 3‐properties. BMC Cancer 16, 115. [DOI] [PMC free article] [PubMed] [Google Scholar]
- Dubuc AM, Morrissy AS, Kloosterhof NK, Northcott PA, Yu EP, Shih D, Peacock J, Grajkowska W, van Meter T, Eberhart CG et al (2012) Subgroup‐specific alternative splicing in medulloblastoma. Acta Neuropathol 123, 485–499. [DOI] [PMC free article] [PubMed] [Google Scholar]
- Friedman HS, Burger PC, Bigner SH, Trojanowski JQ, Brodeur GM, He XM, Wikstrand CJ, Kurtzberg J, Berens ME, Halperin EC et al (1988) Phenotypic and genotypic analysis of a human medulloblastoma cell line and transplantable xenograft (D341 Med) demonstrating amplification of c‐myc. Am J Pathol 130, 472–484. [PMC free article] [PubMed] [Google Scholar]
- Friedman HS, Burger PC, Bigner SH, Trojanowski JQ, Wikstrand CJ, Halperin EC and Bigner DD (1985) Establishment and characterization of the human medulloblastoma cell line and transplantable xenograft D283 Med. J Neuropathol Exp Neurol 44, 592–605. [DOI] [PubMed] [Google Scholar]
- de Haas T, Oussoren E, Grajkowska W, Perek‐Polnik M, Popovic M, Zadravec‐Zaletel L, Perera M, Corte G, Wirths O, van Sluis P et al (2006) OTX1 and OTX2 expression correlates with the clinicopathologic classification of medulloblastomas. J Neuropathol Exp Neurol 65, 176–186. [DOI] [PubMed] [Google Scholar]
- He XM, Wikstrand CJ, Friedman HS, Bigner SH, Pleasure S, Trojanowski JQ and Bigner DD (1991) Differentiation characteristics of newly established medulloblastoma cell lines (D384 Med, D425 Med, and D458 Med) and their transplantable xenografts. Lab Invest 64, 833–843. [PubMed] [Google Scholar]
- Huang X, Hu J, Li Y, Zhuyun Yang Z, Zhu H, Zhou L, Ma K, Schachner M, Xiao Z and Li Y (2013) The cell adhesion molecule L1 regulates the expression of FGF21 and enhances neurite outgrowth. Brain Res 1530, 13–21. [DOI] [PubMed] [Google Scholar]
- Kanehisa M, Sato Y, Kawashima M, Furumichi M and Tanabe M (2016) KEGG as a reference resource for gene and protein annotation. Nucleic Acids Res 44, D457–D462. [DOI] [PMC free article] [PubMed] [Google Scholar]
- Kaur R, Aiken C, Morrison LC, Rao R, Del Bigio MR, Rampalli S and Werbowetski‐Ogilvie T (2015) OTX2 exhibits cell‐context‐dependent effects on cellular and molecular properties of human embryonic neural precursors and medulloblastoma cells. Dis Model Mech 8, 1295–1309. [DOI] [PMC free article] [PubMed] [Google Scholar]
- Kawauchi D, Ogg RJ, Liu L, Shih DJH, Finkelstein D, Murphy BL, Rehg JE, Korshunov A, Calabrese C, Zindy F et al (2017) Novel MYC‐driven medulloblastoma models from multiple embryonic cerebellar cells. Oncogene 36, 5231–5242. [DOI] [PMC free article] [PubMed] [Google Scholar]
- Kawauchi D, Robinson G, Uziel T, Gibson P, Rehg J, Gao C, Finkelstein D, Qu C, Pounds S, Ellison DW et al (2012) A mouse model of the most aggressive subgroup of human medulloblastoma. Cancer Cell 21, 168–180. [DOI] [PMC free article] [PubMed] [Google Scholar]
- Lee J, Kotliarova S, Kotliarov Y, Li A, Su Q, Donin NM, Pastorino S, Purow BW, Christopher N, Zhang W et al (2006) Tumor stem cells derived from glioblastomas cultured in bFGF and EGF more closely mirror the phenotype and genotype of primary tumors than do serum‐cultured cell lines. Cancer Cell 9, 391–403. [DOI] [PubMed] [Google Scholar]
- Lin CY, Erkek S, Tong Y, Yin L, Federation AJ, Zapatka M, Haldipur P, Kawauchi D, Risch T, Warnatz HJ et al (2016) Active medulloblastoma enhancers reveal subgroup‐specific cellular origins. Nature 530, 57–62. [DOI] [PMC free article] [PubMed] [Google Scholar]
- Louis D, Ohgaki H, Wiestler OD and Cavenee WK (2016) WHO Classification of Tumours of the Central Nervous System, 4th edn revised. International Agency for Research on Cancer (IARC), Lyon, France. [Google Scholar]
- Man J, Shoemake J, Zhou W, Fang X, Wu Q, Rizzo A, Prayson R, Bao S, Rich JN and Yu JS (2014) Sema3C promotes the survival and tumorigenicity of glioma stem cells through Rac1 activation. Cell Rep 9, 1812–1826. [DOI] [PMC free article] [PubMed] [Google Scholar]
- Matsuo I, Kuratani S, Kimura C, Takeda N and Aizawa S (1995) Mouse Otx2 functions in the formation and patterning of rostral head. Genes Dev 9, 2646–2658. [DOI] [PubMed] [Google Scholar]
- Milde T, Lodrini M, Savelyeva L, Korshunov A, Kool M, Brueckner LM, Antunes AS, Oehme I, Pekrun A, Pfister SM et al (2012) HD‐MB03 is a novel Group 3 medulloblastoma model demonstrating sensitivity to histone deacetylase inhibitor treatment. J Neurooncol 110, 335–348. [DOI] [PubMed] [Google Scholar]
- Morrison LC, McClelland R, Aiken C, Bridges M, Liang L, Wang X, Di Curzio D, Del Bigio MR, Taylor MD and Werbowetski‐Ogilvie TE (2013) Deconstruction of medulloblastoma cellular heterogeneity reveals differences between the most highly invasive and self‐renewing phenotypes. Neoplasia 15, 384–398. [DOI] [PMC free article] [PubMed] [Google Scholar]
- Neufeld G, Mumblat Y, Smolkin T, Toledano S, Nir‐Zvi I, Ziv K and Kessler O (2016) The role of the semaphorins in cancer. Cell Adh Migr 10, 1–23. [DOI] [PMC free article] [PubMed] [Google Scholar]
- Northcott PA, Buchhalter I, Morrissy AS, Hovestadt V, Weischenfeldt J, Ehrenberger T, Grobner S, Segura‐Wang M, Zichner T, Rudneva VA et al (2017) The whole‐genome landscape of medulloblastoma subtypes. Nature 547, 311–317. [DOI] [PMC free article] [PubMed] [Google Scholar]
- Northcott PA, Korshunov A, Witt H, Hielscher T, Eberhart CG, Mack S, Bouffet E, Clifford SC, Hawkins CE, French P et al (2011) Medulloblastoma comprises four distinct molecular variants. J Clin Oncol 29, 1408–1414. [DOI] [PMC free article] [PubMed] [Google Scholar]
- Northcott PA, Shih DJ, Peacock J, Garzia L, Morrissy AS, Zichner T, Stutz AM, Korshunov A, Reimand J, Schumacher SE et al (2012) Subgroup‐specific structural variation across 1,000 medulloblastoma genomes. Nature 488, 49–56. [DOI] [PMC free article] [PubMed] [Google Scholar]
- Omodei D, Acampora D, Mancuso P, Prakash N, Di Giovannantonio LG, Wurst W and Simeone A (2008) Anterior‐posterior graded response to Otx2 controls proliferation and differentiation of dopaminergic progenitors in the ventral mesencephalon. Development 135, 3459–3470. [DOI] [PubMed] [Google Scholar]
- Pei Y, Moore CE, Wang J, Tewari AK, Eroshkin A, Cho YJ, Witt H, Korshunov A, Read TA, Sun JL et al (2012) An animal model of MYC‐driven medulloblastoma. Cancer Cell 21, 155–167. [DOI] [PMC free article] [PubMed] [Google Scholar]
- Puelles E, Acampora D, Gogoi R, Tuorto F, Papalia A, Guillemot F, Ang SL and Simeone A (2006) Otx2 controls identity and fate of glutamatergic progenitors of the thalamus by repressing GABAergic differentiation. J Neurosci 26, 5955–5964. [DOI] [PMC free article] [PubMed] [Google Scholar]
- Ramaswamy V, Remke M, Bouffet E, Bailey S, Clifford SC, Doz F, Kool M, Dufour C, Vassal G, Milde T et al (2016) Risk stratification of childhood medulloblastoma in the molecular era: the current consensus. Acta Neuropathol 131, 821–831. [DOI] [PMC free article] [PubMed] [Google Scholar]
- Remke M, Hielscher T, Korshunov A, Northcott PA, Bender S, Kool M, Westermann F, Benner A, Cin H, Ryzhova M et al (2011) FSTL5 is a marker of poor prognosis in non‐WNT/non‐SHH medulloblastoma. J Clin Oncol 29, 3852–3861. [DOI] [PubMed] [Google Scholar]
- Renaud J, Kerjan G, Sumita I, Zagar Y, Georget V, Kim D, Fouquet C, Suda K, Sanbo M, Suto F et al (2008) Plexin‐A2 and its ligand, Sema6A, control nucleus‐centrosome coupling in migrating granule cells. Nat Neurosci 11, 440–449. [DOI] [PubMed] [Google Scholar]
- Rolny C, Capparuccia L, Casazza A, Mazzone M, Vallario A, Cignetti A, Medico E, Carmeliet P, Comoglio PM and Tamagnone L (2008) The tumor suppressor semaphorin 3B triggers a prometastatic program mediated by interleukin 8 and the tumor microenvironment. J Exp Med 205, 1155–1171. [DOI] [PMC free article] [PubMed] [Google Scholar]
- Schuller U, Kho AT, Zhao Q, Ma Q and Rowitch DH (2006) Cerebellar ‘transcriptome’ reveals cell‐type and stage‐specific expression during postnatal development and tumorigenesis. Mol Cell Neurosci 33, 247–259. [DOI] [PubMed] [Google Scholar]
- Schwalbe EC, Lindsey JC, Nakjang S, Crosier S, Smith AJ, Hicks D, Rafiee G, Hill RM, Iliasova A, Stone T et al (2017) Novel molecular subgroups for clinical classification and outcome prediction in childhood medulloblastoma: a cohort study. Lancet Oncol 18, 958–971. [DOI] [PMC free article] [PubMed] [Google Scholar]
- Snuderl M, Batista A, Kirkpatrick ND, Ruiz de Almodovar C, Riedemann L, Walsh EC, Anolik R, Huang Y, Martin JD, Kamoun W et al (2013) Targeting placental growth factor/neuropilin 1 pathway inhibits growth and spread of medulloblastoma. Cell 152, 1065–1076. [DOI] [PMC free article] [PubMed] [Google Scholar]
- de Sousa e Melo F, Kurtova AV, Harnoss JM, Kljavin N, Hoeck JD, Hung J, Anderson JE, Storm EE, Modrusan Z, Koeppen H et al (2017) A distinct role for Lgr5+ stem cells in primary and metastatic colon cancer. Nature 543, 676–680. [DOI] [PubMed] [Google Scholar]
- Subramanian A, Tamayo P, Mootha VK, Mukherjee S, Ebert BL, Gillette MA, Paulovich A, Pomeroy SL, Golub TR, Lander ES et al (2005) Gene set enrichment analysis: a knowledge‐based approach for interpreting genome‐wide expression profiles. Proc Natl Acad Sci U S A 102, 15545–15550. [DOI] [PMC free article] [PubMed] [Google Scholar]
- Swiercz JM, Worzfeld T and Offermanns S (2008) ErbB‐2 and met reciprocally regulate cellular signaling via plexin‐B1. J Biol Chem 283, 1893–1901. [DOI] [PubMed] [Google Scholar]
- Telley L, Cadilhac C, Cioni JM, Saywell V, Jahannault‐Talignani C, Huettl RE, Sarrailh‐Faivre C, Dayer A, Huber AB and Ango F (2016) Dual function of NRP1 in axon guidance and subcellular target recognition in cerebellum. Neuron 91, 1276–1291. [DOI] [PubMed] [Google Scholar]
- Thompson EM, Keir ST, Venkatraman T, Lascola C, Yeom KW, Nixon AB, Liu Y, Picard D, Remke M, Bigner DD et al (2017) The role of angiogenesis in Group 3 medulloblastoma pathogenesis and survival. Neuro Oncol 19, 1217–1227. [DOI] [PMC free article] [PubMed] [Google Scholar]
- Tilson SG, Haley EM, Triantafillu UL, Dozier DA, Langford CP, Gillespie GY and Kim Y (2015) ROCK inhibition facilitates in vitro expansion of glioblastoma stem‐like cells. PLoS One 10, e0132823. [DOI] [PMC free article] [PubMed] [Google Scholar]
- Uemura T, Lee SJ, Yasumura M, Takeuchi T, Yoshida T, Ra M, Taguchi R, Sakimura K and Mishina M (2010) Trans‐synaptic interaction of GluRdelta2 and Neurexin through Cbln1 mediates synapse formation in the cerebellum. Cell 141, 1068–1079. [DOI] [PubMed] [Google Scholar]
- Werbowetski‐Ogilvie TE, Seyed Sadr M, Jabado N, Angers‐Loustau A, Agar NY, Wu J, Bjerkvig R, Antel JP, Faury D, Rao Y et al (2006) Inhibition of medulloblastoma cell invasion by Slit. Oncogene 25, 5103–5112. [DOI] [PMC free article] [PubMed] [Google Scholar]
Associated Data
This section collects any data citations, data availability statements, or supplementary materials included in this article.
Supplementary Materials
Fig. S1. Knockdown of OTX2 in Group 3 and Group 4 MB decreases tumorsphere formation and self‐renewal.
Fig. S2. Semaphorin genes are negatively correlated with OTX2 expression in Group 3 and Group 4 MB cells.
Fig. S3. Axon guidance gene expression is upregulated following OTX2 knockdown in Group 3 and Group 4 MB cells.
Fig. S4. Recombinant semaphorin protein treatment does not significantly affect cell number or viability of D283 tumorspheres.
Fig. S5. Decreased levels of semaphorin pathway genes in MB3W1 OTX2 KD cells results in a partial rescue of tumorsphere formation and growth.
Fig. S6. Decreased levels of semaphorin pathway genes in D283 and MB3W1 OTX2 KD tumorspheres does not significantly affect viability.
Table S1. List of antibodies and concentrations used for Western blots.
Table S2. List of primers sequences used for qPCR.
Table S3. Neuronal differentiation genes that are significantly and differentially expressed following OTX2 knockdown in D283 tumorspheres.
Table S4. Axon guidance genes that are significantly and differentially expressed following OTX2 knockdown in D283 tumorspheres.
Table S5. Axon guidance pathway genes that were significantly and differentially expressed following OTX2 KD and the number of OTX2 binding peaks/overlaps within −5 kb to +2 kb of their transcriptional start sites.
Table S6. (A) Univariable cox regression analysis of survival by increasing SEMA4D expression across Group 3 and 4 medulloblastoma. (B) Statistical analyses of survival in patients exhibiting high SEMA6A NRP1, NRP2, or L1CAM gene expression relative to patients with low SEMA6A, NRP1, NRP2 or L1CAM gene expression.
Table S7. Gene Set Enrichment Analysis (GSEA) results for Reactome and KEGG databases identified pathways significantly enriched in gene sets that were downregulated in D283 Scramble relative to OTX2 KD tumorspheres.
Table S8. GSEA revealed that genes associated with SEMA4D signaling were enriched in gene sets that were downregulated in D283 scramble relative to OTX2 KD tumorspheres.