

Abstract
We analyzed the production of reactive oxygen species, the accumulation of salicylic acid (SA), and peroxidase activity during the incompatible interaction between cotyledons of the cotton (Gossypium hirsutum) cv Reba B50/Xanthomonas campestris pv malvacearum (Xcm) race 18. SA was detected in petioles of cotyledons 6 h after infection and 24 h post inoculation in cotyledons and untreated leaves. The first peak of SA occurred 3 h after generation of superoxide (O2·−), and was inhibited by infiltration of catalase. Peroxidase activity and accumulation of SA increased in petioles of cotyledons and leaves following H2O2 infiltration of cotyledons from 0.85 to 1 mm. Infiltration of 2 mm SA increased peroxidase activity in treated cotyledons and in the first leaves, but most of the infiltrated SA was rapidly conjugated within the cotyledons. When increasing concentrations of SA were infiltrated 2.5 h post inoculation at the beginning of the oxidative burst, the activity of the apoplastic cationic O2·−-generating peroxidase decreased in a dose-dependent manner. We have shown that during the cotton hypersensitive response to Xcm, H2O2 is required for local and systemic accumulation of SA, which may locally control the generation of O2·−. Detaching cotyledons at intervals after inoculation demonstrated that the signal leading to systemic accumulation of SA was emitted around 3 h post inoculation, and was associated with the oxidative burst. SA produced 6 h post infection at HR sites was not the primary mobile signal diffusing systemically from infected cotyledons.
The hypersensitive response (HR) in plants is a mechanism of resistance to pathogenic microbes, and is characterized by a rapid and localized tissue collapse resulting in necrotization and immobilization of the intruding pathogen at sites of attack (Goodman and Novacky, 1994). During incompatible interactions following pathogenic stress, generation of reactive oxygen species (ROS) is an event activated at the onset of the HR (Levine et al., 1994; Lamb and Dixon, 1997; Tiedemann et al., 1997). Local defense genes to the invading pathogen are also triggered and may extend to the uninfected tissues surrounding the HR and the whole plant (Ross, 1961; Ryals et al., 1996; Dorey et al., 1997, 1998; Sticher et al., 1997).
Local resistance (LR) and systemic acquired resistance (SAR) are generally accompanied by elevated levels of endogenous salicylic acid (SA) (Malamy and Klessig, 1992; Dorey et al., 1997). There is strong evidence that SA plays a central role in LR and SAR signaling (Malamy et al., 1990; Métraux et al., 1990; Rasmussen et al., 1991; Malamy and Klessig, 1992; Dorey et al., 1997; Durner et al., 1997), since it has been demonstrated that infiltration of Arabidopsis with SA induced the same set of SAR genes as pathogen infection (Ward et al., 1991; Uknes et al., 1992). The induction of LR and SAR by SA might occur through generation of SA radicals, a likely by-product of the interaction of SA with catalase and peroxidases (Durner and Klessig, 1996). Furthermore, plants engineered for constitutive expression of a bacterial salicylate hydroxylase gene, which failed to accumulate SA at normal levels, have severe problems in establishing HR and SAR (Gaffney et al., 1993; Delaney et al., 1994).
Whether SA is the phloem-translocated signal that mediates SAR is still a matter of debate. Rasmussen et al. (1991) demonstrated that SA is most likely not the long-distance signal that leads to the induction of SAR, but instead is required for transduction of the perceived long-distance signal leading to the onset of SAR. Similarly, while experiments clearly demonstrated a correlation between the detection of SA in the phloem and SAR expression in pathogen-infected plants (Hammond-Kosak and Jones, 1996; Ryals et al., 1996), they did not prove that SA is the long-distance mobile signal. Nevertheless, evidence of transport has come from a demonstration in which the translocation of 18O-labeled SA was evidenced in tobacco mosaic virus-infected tobacco (Shulaev et al., 1995). It was shown that methyl-SA, produced from SA upon tobacco mosaic virus infection of tobacco, may function as an airborne signal (Shulaev et al., 1997; Seskar et al., 1998).
Resistance of cotton (Gossypium hirsutum) plants to the bacterial pathogen Xanthomonas campestris pv. malvacearum (Xcm) is mediated by a gene-for-gene interaction (De Feyter et al., 1993). In the incompatible interaction between cv Reba B50 and the avirulent race 18 of Xcm, a sharp production of superoxide (O2·−) was characterized at HR sites 3 h after cotyledon infection, followed by an accumulation of H2O2 between 4 and 6 h post inoculation (Martinez et al., 1998). Generation of O2·− was demonstrated to be mediated by an apoplastic cationic NADH-peroxidase, while the constitutive NADPH-oxidase remained inactive (Martinez et al., 1998). Resistance of cotton plants was associated with a strong increase in anionic-peroxidase activities both at HR sites in cotyledons 12 h after infection and systemically in leaves 24 h after cotyledon infection (Martinez et al., 1996). The activity of peroxidase is a useful marker for LR and SAR in cotton plants challenged by an avirulent isolate of Xcm.
We studied the relationships between the oxidative burst and the activities of SA and peroxidase. SA has been previously evidenced to act upstream (Draper, 1997) or downstream (Leon et al., 1995) to the production of ROS. Therefore, it was of interest to further investigate the role of both SA and H2O2 molecules during an incompatible interaction between cotton plants and Xcm race 18 to better understand the time sequence of events leading to cotton LR and SAR.
MATERIALS AND METHODS
Plant Material and Bacterial Strains
Two cotton (Gossypium hirsutum) varieties were used in this study. The susceptible Acala-44 variety possesses no known major genes for resistance to Xcm (Hunter et al., 1968; De Feyter et al., 1993). The cv Reba B50 (Allen × Stoneville 2B), similar to the Luther Bird's 101-102B line, contains the B2B3 blight resistance key genes. Associated with resistant determinants introduced from Empire WR and MVW (Brinkerhoff et al., 1984), those genes confer immunity to all Xcm races, except race 20 (Innes, 1983; Hillocks, 1992).
Ten-day-old cotyledons of both varieties were inoculated with Xcm race 18 or race 20, collected in cotton fields in Burkina Faso, by infiltration of the bacterial suspension (107 colony forming units [cfu]/mL) (Daï et al., 1996). This gives an initial bacterial density of about 4.104 cfu/cm2. So far, three interactions have been investigated: the incompatible one (cv Reba B50/Xcm race 18) and the two compatible ones (cv Reba B50/Xcm race 20 and cv Acala-44/Xcm race 18). Controls consisted in plants from each variety that were infiltrated with sterile water. Plants were grown in a greenhouse at 30°C ± 1°C under 80% humidity.
Collection of Petiole Exudates
After Xcm inoculation of cv Reba B50 or cv Acala-44 cotyledons, apoplastic washing fluids (AWF) were prepared by vacuum infiltration of petioles of fresh cotyledons (Rasmussen et al., 1991). Petioles were cut at both their stem and cotyledon ends and were washed with distilled water. They were immerged in a Petri dish for 15 min in 50 mm sodium acetate, pH 6.0, containing 0.25 m NaCl. Vacuum was applied and slowly released. Petioles were then introduced vertically in Eppendorf tubes and centrifuged (×5,000g per min); 20 to 30 μL per g of petiole of AWF were obtained. An equal volume of methanol was then added to the AWF. Exudates were collected 0, 1, 3, 6, and 12 h and 1, 2, 3, 4, 5, 7, and 9 d after inoculation. In parallel, activity of the cytoplasmic enzyme Glc-6-P dehydrogenase (EC1.1.1.49) was assayed in the AWF to detect cytoplasmic contamination.
HPLC Analysis of SA
Fifty microliters of methanolic extracts of petiole exudate were injected onto a C18 column (250 × 4.6 mm; 5 μm; Lichrospher 100 Rp 18, Alltech, Deerfield, IL) equilibrated with 5% (v/v) buffered acetonitrile (50 mm sodium acetate buffer, pH 4.5). SA was eluted isocratically 15 min following injection, and detected by fluorescence (excitation, 290 nm; emission, 402 nm). Concentration was determined using a linear range of calibration standards consisting in 0 to 1.3 μg/50 μL of SA (Sigma-Aldrich, St. Louis). SA concentration was expressed in micrograms per gram fresh weight.
Chemical hydrolysis of residues was performed at 80°C in 500 μL of 2 m NaOH. After 2.5 h, the hydrolysis mixture was acidified with HCl (to obtain a 4 m HCl solution) and incubated for an additional 1 h at 80°C. The hydrolysis mixture was then centrifugated at 1,000g, and the supernatant was partitioned and prepared for HPLC (Enyedi et al., 1992).
Assay of O2·−-Generating Activity of Cotyledon Discs
The O2·−-generating activity of cotyledon discs was assayed spectrophotometrically by measuring the reduction of exogeneously supplied cytochrome c at 550 nm as previously described (Martinez et al., 1998).
Isoelectric Focusing (IEF) and Assay of Peroxidases
For IEF, cotyledons of each group of plants were mixed in liquid nitrogen and homogenized in 0.05 m sodium acetate buffer, pH 6.0, containing 25 mm β-mercapto-ethanol and 5% polyvinylpolypyrolidone (v/g fresh weight). After centrifugation (15 min at 12,000g), the supernatant liquid was filtered on polysulfone membrane (0.45 μm, Gelman, Pall France, St. Germain en Laye, France). IEF was performed according to the method of Robertson et al. (1987) on vertical plates (70 × 80 mm, Bio-Rad Laboratories, Hercules, CA). For the analysis of cationic peroxidase isoenzymes, the pH gradient of the gel ranged from 3.0 to 11, with a larger amount of pH 9.0/11 ampholytes (0.6% ampholytes 3.0/10; 2.5% ampholytes 9.0/11, from Serva, Heidelberg). The anode solution consisted in 20 mm acetic acid and the cathode solution in 25 mm NaOH. The lane corresponding to the pI markers was cut and stained with Coomassie Blue R-250 (Neuhoff et al., 1988). After migration of proteins (40 μg of proteins per lane), peroxidase activity was revealed using 0.2% (w/v) guaiacol, 0.01% (w/v) 3-amino-9-ethylcarbazole, and 0.03% (w/v) H2O2 in 0.05 m sodium phosphate buffer, pH 6.0. Total peroxidase activity of crude extracts was spectrophotometrically assessed at 470 nm using only guaiacol as the hydrogen donor. Peroxidase activity was calculated using the molar extinction coefficient of tetraguaiacol (26.6 × 10³ mol−1 cm−1) and specific activity was expressed in nanokatals per milligram of total proteins.
Infiltration of H2O2, SA, Catalase, or Aminotriazole
Cotyledons were syringe-infiltrated with H2O2 (1 mm), SA (2 mm), catalase (500 units/mL), or with the aminotriazole (5 mm) catalase inhibitor. The 2-mm SA solution was prepared by titration with 0.1 m NaOH to a pH value around 7.0. The effects of SA on O2·− production and on the activity of cationic peroxidases was observed 3 h post infection by Xcm during the oxidative burst after infiltration of SA realized 2.5 h post inoculation. To determine the effect of H2O2 on plant defense responses, catalase and aminotriazole were also infiltrated 3 h after infection. In dose-dependent experiments, H2O2 was infiltrated with 5 mm aminotriazole in concentrations of 0.5, 0.7, 0.85, 1.0, 5.0, 10, 50, 100, 150, 200, and 250 mm, while SA was injected at concentrations of 20, 50, and 100 μm and 1.0, 2.0, and 3.0 mm.
Cotyledon Excision Experiments
To determine the time of signal transmission leading to the expression of SAR, infected cotyledons were excised from plants 0, 0.5, 1, 1.5, 2, 3, 6, 12, 24, 48, and 72 h after inoculation, and SA content was measured in petiole exudate. The noninoculated leaves of the first rank on same plants were excised 72 h after inoculation of cotyledons, and exudates were collected from petioles for assessing SA content and peroxidase activity. Estimation was performed on six separated plants per infected line and per time.
Bacterial Growth Determination
Bacterial growth was determined by triturating infected cotyledons or leaves in sterile deionized water. After serial dilutions, bacterial concentration were determined by plate counts and expressed as cfu per square centimeter. Estimation was performed 4 d after inoculation, based on 10 replicates per infected line and per sample.
RESULTS
Time Course of SA Production during Infection
In the incompatible interaction cv Reba B50/Xcm race 18, SA was first detected 5 h after infection in petiole exudate from inoculated cotyledons with a peak at 6 h (Fig. 1A). The level of SA then increased in both the exudates of untreated leaves and infected cotyledons 24 h post inoculation, with a higher content in cotyledons (Fig. 1B). In the compatible interactions cv Acala-44/Xcm race 18 and cv Reba B50/Xcm race 20 (not shown), no significant increase in SA content was detected in petiole exudates. Plants from both cultivars infiltrated with water contained no detectable level of SA. Xcm race 18-infected cotyledons co-infiltrated with catalase did not induce any significant production of SA.
Figure 1.

Effect of Xcm race 18 on the endogenous level of free SA in relationship to time (A, 0–12 h; B, 0–240 h) in the petioles of infected cotton cotyledons (●; ○) and the upper untreated leaves (▪; □) of the cv Reba B50 (●; ▪) and cv Acala-44 (○; □) lines. The cotyledons of each variety were inoculated, and samples of petiole phloem exudate were collected at various times following infection. SA was separated by HPLC and measured as described in “Materials and Methods.” Each value is the mean ± se of 10 replicates from different plants. The arrow in A indicates the time at which the oxidative burst occurs. SA content is expressed as μg g−1 fresh matter (FM).
Effect of SA on the Oxidative Burst
The relations between SA and the oxidative burst occurring in cotyledons during the incompatible interaction cv Reba B50/Xcm race 18 were investigated 3 h after inoculation. After Xcm inoculation (2.5 h) at the beginning of the oxidative burst, cotyledons were infiltrated with increasing concentrations of SA; generation of O2·− was assessed via reduction of cytochrome c. Figure 2 shows that the reduction decreased in a dose-dependent manner following SA treatments. The use of SOD (1,000 units mL−1) inhibited the reaction, as previously shown by Martinez et al. (1998).
Figure 2.

Influence of SA on O2·− production. cv Reba B50 cotton cotyledons were infiltrated with various concentrations of SA 2.5 h after inoculation with Xcm race 18. Cotyledon discs were incubated in cytochrome c medium, and O2·− production was monitored by the reduction of cytochrome c 3 h post infection. Each value is the mean ± se of six replicates from different plants. ▪, cv Reba B50/Xcm race 18; ▴, 0.05 mm SA; □, 0.1 mm SA; ○, 1 mm SA; ●, 2 mm SA.
Three hours after infection, cationic peroxidases have previously been demonstrated to be responsible for the production of O2·− during the incompatible interaction cv Reba B50/Xcm race 18 (Martinez et al., 1998). A dose-response experiment on IEF gel was carried out to investigate the effect on the cationic peroxidase activity of increasing quantities of SA infiltrated 2.5 h after Xcm inoculation. Guaiacol activities of the cationic peroxidases decreased in a dose-dependent manner following SA infiltration in cotyledons (Fig. 3). Furthermore, in non-infected plants, the oxidative burst was never induced whatever the SA concentration (1–250 mm).
Figure 3.

Dose-dependent effect of SA on the activity of cationic peroxidase (pI 9–9.5) assessed following IEF. SA was infiltrated 2.5 h following inoculation with Xcm race 18 at concentrations of 0.02, 0.05, 0.1, 1.0, 2.0, 3.0, and 5.0 mm (lanes b–h), and peroxidase activity was assayed 3 h post infection. Lane a, Infiltration with Xcm race 18 only.
Effect of H2O2 on the Accumulation of SA
From previous experiments, it appeared that in the incompatible interaction cv Reba B50/Xcm race 18, a strong production of O2·− occurred 3 h after infection, followed by accumulation of H2O2 between 4 and 6 h post infection (Martinez et al., 1998). The fact that the appearance of these ROS in infected cotyledons preceeded SA accumulation suggested that H2O2 and/or O2·− could induce SA accumulation. In this respect, noninfected cotyledons of cv Reba B50 were treated with increasing concentration of H2O2 with aminotriazole or not, and subsequently assessed for the accumulation of free SA. Free SA was detected after infiltration of cotyledons with 0.85 mm H2O2 plus aminotriazole or more (Fig. 4). Without the addition of aminotriazole, H2O2 induced detectable SA from 150 mm.
Figure 4.

Dose-dependent effect of H2O2 on the SA level in cotyledons of cv Reba B50 plants. Cotton cotyledons were infiltrated with different concentrations of H2O2 plus 5 mm aminotriazole (black bars) or with H2O2 alone (white bars). Petioles were harvested 72 h after infiltration. Levels of endogenous free SA were analyzed by HPLC. Each value is the mean ± se of 10 replicates from different plants.
Effect of SA on Peroxidase Activities
A significant increase in the total peroxidase activity assayed spectrophotometrically 72 h following infiltration of increasing quantities of SA in noninfected cv Reba B50 cotyledons and leaves, was induced by 2 mm SA and more (Fig. 5). Infiltration of 2 mm SA in cotyledons of both noninfected cv Reba B50 and cv Acala-44 resulted in an increase in the local peroxidase activity in cotyledons 3 h after treatments and in the systemic peroxidase activity 12 h after infiltration (Fig. 6). No significant change was detected in plants injected with water.
Figure 5.

Dose-dependent effect of SA on peroxidase activity in cotyledons and leaves of the cotton cv Reba B50. Cotyledons were infiltrated with various concentrations of SA, and peroxidase activity was measured 72 h later in extracts of cotyledons (black bars) and untreated leaves (white bars). Each value is the mean ± se of 10 replicates from different plants.
Figure 6.
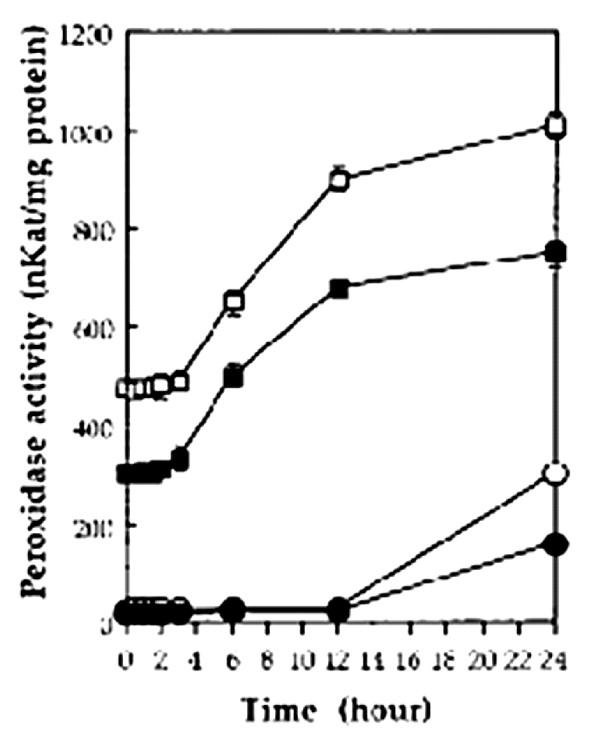
Time course effect of 2 mm SA on peroxidase activity in cotyledons and leaves of the cotton cv Reba B50 and cv Acala-44. SA was infiltrated into cotyledons, and cotyledons and untreated leaves were harvested at the indicated times on the x axis and analyzed for peroxidase activity. ▪, cv Acala-44 cotyledon; □, cv Reba B50 cotyledon; ●, cv Acala-44 leaves; ○, cv Reba B50 leaves.
Is SA Free or Conjugated following Infiltration in Cotton Cotyledons?
When cotyledon extracts from untreated cotton plants were analyzed, most of the SA was conjugated and was found in hydrolyzed extract (time 0−) (Fig. 7). Immediately after infiltration of 2 mm SA, 85% of free SA was recovered from cotyledons (time 0+). Half an hour later, only 40% was found in unhydrolyzed extracts, while 25% was extracted in the hydrolyzed part. Conjugation of SA increased with time, and 3 h after treatment, 60% was found in the hydrolyzed extracts.
Figure 7.

Free SA in cotton cotyledon extracts following hydrolysis. Cotyledons were sampled before infiltration of 2 mm SA (0−), and 0 (0+), 0.5, 1, and 3 h after infiltration. Black bars, Free SA; white bars, conjugated SA. Each value is the mean ± se of six replicates.
SA Accumulation and Peroxidase Activity following Infiltration of 1 mm H2O2 Plus Aminotriazole
The time course of SA accumulation in cotyledons and leaves of both cultivars was analyzed following infiltration of cotyledons with 1 mm H2O2 plus aminotriazole. Three hours after infiltration, the level of SA increased in the two cultivars, but at a lower intensity in the susceptible Acala-44 variety (Fig. 8, A and B). An increase in SA content was detected in petiole exudate of untreated leaves from 12 h post inoculation. In water-infiltrated cotyledons and untreated leaves, no increase in SA was detected (not shown). The time course of total peroxidase activity after infiltration of cotyledons with 1 mm H2O2 revealed a significant increase between 12 and 24 h post treatment in cotyledons of the two cultivars, while in leaves, stimulation of this activity was observed 24 h post inoculation (Fig. 8, A and B).
Figure 8.

Time-dependent effect of H2O2 (1 mm) on SA accumulation (hatched bars, cotyledons; white bars, leaves) and peroxidase activity in infiltrated cotyledons (▪) and upper untreated leaves (○) of cv Reba B50 plants (A) or cv Acala-44 (B). Petioles of infiltrated cotyledons were harvested with the upper untreated leaves at the indicated times, and analyzed for SA content by HPLC. Each value is the mean ± se of 10 replicates from different plants.
Leaf Detachment Experiment in cv Reba B50 Plants Infected with Xcm
To determine the time of signal emission leading to SAR, infected cotyledons were excised from plants after inoculation; the content of SA was measured in petiole exudate of leaves and cotyledons, and peroxidase activity was measured in leaves.
Following infiltration with race 18, infected cv Reba B50 cotyledons were detached at different times to determine the time sequence of SA apparition in petioles of cotyledons and leaves (Table I). No SA was detected in petiole exudate of cotyledons before 3 h post inoculation. In leaves, SA was detected only when inoculated cotyledons were detached after 3 h post-inoculation. This indicated that the signal that induced accumulation of SA in the first noninoculated leaves was translocated between 2 and 3 h after inoculation. Analysis of total peroxidase activity in leaves showed an increase only if SA accumulated in petioles of leaves.
Table I.
Determination of signal emission in cv Reba B50 plants challenged by the Xcm avirulent race 18
| Time of Cotyledon Detachment after Inoculation | SA Content
|
Peroxidase Activity in Leavesb | |
|---|---|---|---|
| Cotyledon exudatea | Leaf exudateb | ||
| h | μg/g fresh material | nkat/mg protein | |
| 0 | 0 | 0 | 70 ± 18 |
| 0.5 | 0 | 0 | 72 ± 20 |
| 1 | 0 | 0 | 75 ± 15 |
| 1.5 | 0 | 0 | 60 ± 12 |
| 2 | 0 | 0 | 74 ± 11 |
| 3 | 0.08 ± 0.001 | 0.67 ± 0.13 | 245 ± 13 |
| 6 | 0.3 ± 0.015 | 0.65 ± 0.1 | 237 ± 20 |
| 12 | 0.05 ± 0.01 | 0.68 ± 0.1 | 241 ± 15 |
| 24 | 0.64 ± 0.012 | 0.68 ± 0.2 | 248 ± 25 |
| 48 | 1.4 ± 0.2 | 0.65 ± 0.1 | 238 ± 20 |
| 72 | 1.6 ± 0.2 | 0.65 ± 0.14 | 245 ± 12 |
Data are the means of six replicates per time.
At the time of cotyledon detachment.
72 h post inoculation.
Similar experiments were conducted on cv Reba B50 cotyledons inoculated with Xcm race 20. Previous works demonstrated that in this compatible interaction, the infection caused an increase in peroxidase activity in non-infected leaves (Martinez et al., 1996). No increase in SA content was detected in infected cotyledons nor in the first leaves (not shown). The significant increase in peroxidase activity occurred in leaves only if infected cotyledons remained attached on plant 48 h after inoculation. This indicated that the signal transmitted 2 d after infection of cv Reba B50 cotyledons with Xcm race 20 induced an increase in peroxidase activity but did not trigger SA accumulation.
Effect of SAR on Bacterial Growth
In cv Reba B50, pre-inoculation of cotyledons with Xcm race 18, followed by leaf post inoculation with the same race, induced 50% inhibition of the bacterial growth compared with post inoculation of water-infiltrated cotyledons (Tables II and III); when leaves were post-treated with Xcm race 20, inhibition reached 70%. In plants whose cotyledons were pre-inoculated with Xcm race 20, about 30% of growth inhibition was observed whatever the race leaves were post-inoculated with. In similar experiments performed on cv Acala-44, about 20% inhibition of the bacterial growth was estimated.
Table II.
Effect of SAR on bacterial growth in cv Reba B50
| Cotyledon Pre-Inoculation
|
||||||
|---|---|---|---|---|---|---|
| Race 18 | Race 20 | Water | ||||
| Leaf post-inoculationa | Race 18 | Race 20 | Race 18 | Race 20 | Race 18 | Race 20 |
| Bacterial densityb | 63 ± 5 | 900 ± 52 | 87 ± 11 | 1,965 ± 110 | 130 + 15 | 3,024 ± 110 |
| Growth inhibition (%)c | 51.5 | 70.3 | 33 | 35 | – | – |
Leaves of rank 1 were infiltrated 72 h following cotyledon inoculation.
Estimation of the bacterial growth in leaves was performed 4 d after leaf infiltration; bacterial density is expressed as cfu × 105 cm−2; 10 infected plants were analyzed.
Percentage of inhibition of bacterial growth was estimated using the bacterial density of infected leaves from plants whose cotyledons were previously water-infiltrated; 10 plants were analyzed.
Table III.
Effect of SAR on bacterial growth in cv Acala 44
| Cotyledon Pre-Inoculation
|
||||||
|---|---|---|---|---|---|---|
| Race 18 | Race 20 | Water | ||||
| Leaf post-inoculationa | Race 18 | Race 20 | Race 18 | Race 20 | Race 18 | Race 20 |
| Bacterial densityb | 4,102 + 85 | 3,995 ± 80 | 4,195 ± 101 | 4,327 | 5,002 ± 230 | 5,311 ± 80 |
| Growth inhibition (%)c | 18 | 20.2 | 21 | 18.5 | – | – |
Leaves of rank 1 were infiltrated 72 h following cotyledon inoculation.
Estimation of the bacterial growth in leaves was performed 4 d after leaf infiltration; bacterial density is expressed as cfu × 105/cm−2; 10 infected plants were analyzed.
Percentage of inhibition of bacterial growth was estimated using the bacterial density of infected leaves from plants whose cotyledons were previously water-infiltrated; 10 plants were analyzed.
DISCUSSION
The hypersensitive response of cotton to Xcm appears to follow the gene-for-gene concept leading to specific host cell death (De Feyter et al., 1993; 1998). In the incompatible interaction cv Reba B50/Xcm race 18, the production of O2·− 3 h after infection, followed by the accumulation of H2O2 (Martinez et al., 1998), is an event that precedes two accumulations of free SA. The first one is locally produced in cotyledons at HR sites 6 h post inoculation, while the second occurs systemically from 24 h post inoculation. A strong stimulation of the total peroxidase activity was observed in cotyledons and leaves, and bacterial growth significantly decreased in post-inoculated leaves of plants whose cotyledons were pre-inoculated. As predicted, controls consisting of Xcm race 20-infected plants or infiltration of Xcm race 18-infected cotyledons with catalase did not reveal any significant production of SA or increase in peroxidase activity.
To better understand the roles of H2O2 and SA in cotton HR, we further investigated effects of exogenous H2O2 and SA on events of the HR. The fact that the production of O2·− and the activity of the O2·−-generating cationic peroxidase were inhibited by increasing quantities of SA suggests that SA accumulating in cotyledons 6 h post infection may be involved in the control of the production of O2·−. Previous studies have demonstrated that SA inhibits ascorbate peroxidase and catalase, two key enzymes for scavenging H2O2, by serving as an electron-donating substrate (Durner and Klessig, 1995), although SA was shown to be a better reducing substrate than an effective inhibitor (Kvaratskhelia et al., 1997). This role is supported by the redox deactivation mechanism by SA of the iron Fenton reaction centers (Cheng et al., 1996). Our observations (Figs. 2 and 3) indicate that in Xcm race 18-infected cotton cotyledons, SA may cause perturbations of the cellular redox state and block the O2·−-generating cationic peroxidase activity.
In addition to this putative regulating role for SA, the marked activity of SOD observed just after generation of O2·− also likely contributed to local detoxication by O2·− dismutation into H2O2 (C. Martinez, E. Bresson, and M. Nicole, unpublished data). The application of 1 mm H2O2 in aminotriazole-treated cv Reba B50 or cv Acala-44 cotyledons induced SA accumulation (Fig. 4) and caused an increase in total peroxidase activity (Fig. 8), as in the incompatible interaction cv Reba B50/Xcm race 18 (Martinez et al., 1996). The physiological concentration at which H2O2 causes these effects in planta is difficult to evaluate because of catalase-dependent degradation of H2O2 into molecular oxygen. But co-infiltration with the catalase inhibitor aminotriazole indicated that a concentration around 1 mm was able to induce significant effects in cotton cotyledons, in accordance with previous works indicating that the action of SA in SAR is mediated by elevated amounts of H2O2 (Wu et al., 1997).
Infiltration of SA into cv Reba B50 or cv Acala-44 cotyledons stimulated total peroxidase activity in cotyledons and leaves (Figs. 5 and 6), in a manner similar to that in pathogen-induced resistance. Compared with SA content produced in cotton during infection, the relatively large quantity of infiltrated SA (2 mm) required to stimulate peroxidase activity is explained by the possibility that SA could be conjugated to Glc to detoxify plant tissues from free SA (Enyedi et al., 1992; Hennig et al., 1993). In our experiments, 30 min after SA infiltration, about 25% were found to be conjugated. A cell wall-associated β-glucosidase that releases SA from Glc has been identified in tobacco, suggesting that SA-β-glucoside serves as an inactive storage form of SA (Chen et al., 1995). It is likely that in cotton a part of infiltrated SA escaped glycosylation and may serve as a signal.
The leaf detachment experiment conducted in our study (Table I) clearly demonstrated that removing inoculated cotyledons from cv Reba B50 plants prior to 3 h post inoculation blocked the systemic response of Reba B50 plants challenged by Xcm race 18. It is thus possible that the signal at the onset of SAR was generated around 3 h following cotyledon inoculation in parallel to (or resulting from) the oxidative burst. The higher level of SA found in noninfected leaves compared with that in the inoculated cotyledons before ablation (Table I) strongly indicates that the systemically accumulated free SA did not originate from the inoculated cotyledons but, rather, was induced by another putative systemically translocated signal. Although our data revealed that cotyledon SA is likely not the primary signal that triggers SAR in cotton, they are consistent with the involvement of SA in the cascade of downstream events that are associated with HR and culminate with the manifestation of SAR. This is consistent with the observation that in the compatible interactions Reba 50/Xcm race 20 and cv Acala-44/Xcm race 18, no increase in SA or peroxidase activity was detected and no limitation of the bacterial growth was recorded in post-inoculated leaves of plants whose cotyledons were pre-inoculated.
Our observations strengthen previous suggestions that H2O2 accumulation is required for SA-dependent responses (Leon et al., 1995; Neuenschwander et al., 1995; Alvarez et al., 1998) and led us to propose the following model for the H2O2- and SA-mediated LR and SAR of cotton to Xcm (Fig. 9). Three hours following plant infection, apoplastic cationic peroxidase generated O2·−, which could result in the accumulation of H2O2 between 4 and 6 h, likely from dismutation by SOD, although other sources of H2O2 are suspected (Martinez et al., 1998). Accumulation of SA 6 h post infection in cotyledons occurs downstream of pathogen-dependent ROS production, likely under H2O2 control. In parallel, and perhaps in response to SA, an increase in total peroxidase activity and the inhibition of bacterial growth were demonstrated. In this model, SA may inhibit the O2·−-generating system. The translocated signal both induced a systemic accumulation of SA and the activation of peroxidase activity. Since plants responded to H2O2 (Figs. 4 and 8) in a way similar to the way they respond to pathogen infection—systemic production of SA and activation of peroxidase activity (Fig. 1; Martinez et al., 1996)—it is expected that H2O2 promotes establishment of cotton SAR to Xcm.
Figure 9.

Schematic diagram illustrating relationships between the oxidative burst and salicylic acid in LR and SAR to Xcm in cotton. PoxA, activity of total peroxidase.
In contrast to the proposed model, Draper (1997) indicated that the accumulation of SA within developing lesions on tobacco leaves begins to accumulate within 1 to 2 h after inoculation, prior to the sustained oxidative burst. In addition, several authors (Kauss and Jeblick, 1995; Mur et al., 1996; Rao et al., 1997) demonstrated an early role for SA that may cause the generation of the oxidative burst in incompatible interactions. Accordingly, the addition of SA to a tobacco suspension culture immediately induced a rapid transient generation of O2·−, followed by a transient increase in the cytosolic free calcium ion concentration (Kawano et al., 1998). These observations may suggest that SA and oxidative burst pathways occur independently in some host-pathogen systems.
Similar responses of both cotton cultivars following infiltration with H2O2 (Fig. 8), SA (Fig. 6), or in the incompatible interaction indicate that ROS in the cotton/Xcm system play the role of an internal emergency signal for the induction of the hypersensitive cell death, as previously reported with other plants (Chen et al., 1993; Levine et al., 1994; Tenhaken et al., 1995; Jabs et al., 1996; Alvarez et al., 1998).
It should be noted that plants of the cv Reba B50 challenged by the virulent Xcm race 20, did not display any HR symptoms, nor did they accumulate SA in cotyledons or in leaves (Fig. 8), but showed symptoms of bacterial blight. Surprisingly, a systemic stimulation of peroxidase activity was detected 48 h after infection and was associated with a relative inhibition of the bacterial population in cotyledons (Table II). In the excised cotyledon experiment (Table I), we demonstrated that in the compatible interaction cv Reba B50/Xcm race 20, the signal inducing the systemic response was only generated after 48 h following inoculation. Mechanisms underlying the systemic stimulation of peroxidase activity in the cv Reba B50 infected with incompatible Xcm race 18 seem different from those implicated in the compatible interaction cv Reba B50/Xcm race 20, in which no SA was detected. This strongly suggests that a signal different from SA could be responsible for the activation of a delayed systemic response in this interaction. In contrast to pathogen-induced SAR, a signaling pathway controlling induced systemic resistance has been recently reported (Van Wees et al., 1997; Pieterse et al., 1998), and is independent of SA accumulation. The plant growth regulators jasmonic acid and ethylene have been shown to be implicated in this plant defense response (Wasternack and Parthier, 1997).
Our data demonstrated that incompatible recognition of Xcm by cotton triggers the oxidative burst that precedes the production of SA in cells undergoing the HR to race 18. Our data emphasized the upstream role of H2O2 as the initiating signal of LR and SAR in cotton, which was confirmed by the inhibition of SA production and the HR phenotype after co-infiltration of catalase with Xcm (data not shown). We provide evidence that treatment with H2O2 positively influences the local and systemic accumulation of SA, which is correlated with the enhancement of peroxidase activity. This strengthens the hypothesis that H2O2 is a key molecule in plant resistance to pathogenic microbes (Levine et al., 1994; Léon et al., 1995; Tenhaken et al., 1995; Wu et al., 1997; Alvarez et al., 1998). In the sequence of events following pathogen recognition in Xcm-infected plants, SA acts after the oxidative burst but plays a central signaling role for LR and SAR, since pre-exposure of cotton tissues to SA never induced generation of O2·−. Furthermore, SA could be involved in feedback regulation of the O2·−-generating peroxidase activity in these plants. It should be now of interest to determine whether the ROS in Xcm-infected cotton plants could be involved in gene activation, including the Phe ammonia-lyase-encoding gene. Phe ammonia-lyase could be involved, not only in phenol synthesis by hypersensitive responding cells (Daï et al., 1996) including SA, but also transiently stimulated in stem vascular fluids (Smith-Becker et al., 1998). This may confirm that in Xcm-infected cotton, SA is not the signal transported from cells undergoing the HR to the whole plant, but accumulates in stems as a transient molecule involved in SAR signaling.
ACKNOWLEDGMENT
The authors acknowledge Dr. J. Durner (University of New Jersey) for kindly revising the manuscript.
LITERATURE CITED
- Alvarez ME, Pennell RI, Meijer PJ, Ishikawa A, Dixon RA, Lamb C. Reactive oxygen intermediates mediate a systemic signal network in the establishment of plant immunity. Cell. 1998;92:773–784. doi: 10.1016/s0092-8674(00)81405-1. [DOI] [PubMed] [Google Scholar]
- Brinkerhoff LA, Verhalen LM, Johnson WM, Essenberg M, Richardson PE. Development of immunity to bacterial blight of cotton and its implication for other diseases. Plant Dis. 1984;68:168–173. [Google Scholar]
- Chen Z, Malamy J, Henning J, Contath U, Sanchez-Cassa P, Silva H, Ricigliano J, Klessig D. Induction, modification, and transduction of the salicylic acid signal in plant defense responses. Proc Natl Acad Sci USA. 1995;92:4134–4137. doi: 10.1073/pnas.92.10.4134. [DOI] [PMC free article] [PubMed] [Google Scholar]
- Chen Z, Silva H, Klessig D. Active oxygen species in the induction of plant systemic acquired resistance by salicylic acid. Science. 1993;262:1883–1886. doi: 10.1126/science.8266079. [DOI] [PubMed] [Google Scholar]
- Cheng I, Zhao C, Amolins A, Galazka M, Doneski L. A hypothesis for the in vivoantioxidant action of salicylic acid. BioMetals. 1996;9:285–290. [Google Scholar]
- Daï GH, Nicole M, Martinez C, Bresson E, Daniel JF, Andary C, Geiger JP. Flavonoids accumulate in cell walls, middle lamellae and callose-rich papillae during an incompatible interaction between Xanthomonas campestris pv. malvacearum(Race 18) and cotton. Physiol Mol Plant Pathol. 1996;49:285–306. [Google Scholar]
- De Feyter R, McFadden H, Dennis L. Five avirulence genes from Xanthomonas campestris pv. malvacearumcause genotype-specific cell death when expressed transiently in cotton. Mol Plant-Microbe Interact. 1998;11:698–701. [Google Scholar]
- De Feyter R, Yang Y, Gabriel DW. Gene-for-gene interactions between cotton R genes and Xanthomonas campestris pv. malvacearumavr genes. Mol Plant-Microbe Interact. 1993;6:225–237. doi: 10.1094/mpmi-6-225. [DOI] [PubMed] [Google Scholar]
- Delaney TP, Uknes S, Vernoij B, Friedrich L, Weymann K, Negrotto D, Gaffney T, Gut-Rella M, Kessmann H, Ward E, Ryals J. A central role of salicylic acid in plant disease resistance. Science. 1994;266:1247–1250. doi: 10.1126/science.266.5188.1247. [DOI] [PubMed] [Google Scholar]
- Dorey S, Baillieul F, Pierrel MA, Saindrenan P, Fritig B, Kauffmann S. Spatial and temporal induction of cell death, defense genes, and accumulation of salicylic acid in tobacco leaves reacting hypersensitively to a fungal glycoprotein elicitor. Mol Plant-Microbe Interact. 1997;10:646–655. [Google Scholar]
- Dorey S, Baillieul F, Pierrel MA, Saindrenan P, Fritig B, Kauffmann S. Tobacco class I and II catalases are differentially expressed during elicitor-induced hypersensitive cell death and localized acquired resistance. Mol Plant-Microbe Interact. 1998;11:1102–1109. [Google Scholar]
- Draper J. Salicylate, superoxide synthesis and cell suicide in plant defence. Trends Plant Sci. 1997;2:162–165. [Google Scholar]
- Durner J, Klessig DF. Inhibition of ascorbate peroxidase by salicylic acid and 2, 6-dichloroisonicotinic acid, two inducers of plant defense responses. Proc Natl Acad Sci USA. 1995;92:11312–11316. doi: 10.1073/pnas.92.24.11312. [DOI] [PMC free article] [PubMed] [Google Scholar]
- Durner J, Klessig DF. Salicylic acid is a modulator of tobacco and mammalian catalases. J Biol Chem. 1996;271:28492–28501. doi: 10.1074/jbc.271.45.28492. [DOI] [PubMed] [Google Scholar]
- Durner J, Shah J, Klessig DF. Salicylic acid and disease resistance in plants. Trends Plant Sci. 1997;2:266–274. [Google Scholar]
- Enyedi A, Yalpani N, Silverman P, Raskin I. Localization, conjugation, and function of salicylic acid in tobacco during the hypersensitive reaction to tobacco mosaic virus. Proc Natl Acad Sci USA. 1992;89:2480–2484. doi: 10.1073/pnas.89.6.2480. [DOI] [PMC free article] [PubMed] [Google Scholar]
- Gaffney T, Friedrich L, Vernooij B, Negrotto D, Nye G, Uknes S, Ward E, Kessmann H, Ryals J. Requirement of salicylic acid for the induction of systemic acquired resistance. Science. 1993;261:754–756. doi: 10.1126/science.261.5122.754. [DOI] [PubMed] [Google Scholar]
- Goodman RN, Novacky AJ. The Hypersensitive Reaction in Plants to Pathogens. St Paul: APS Press; 1994. [Google Scholar]
- Hammond-Kosak KE, Jones JDG. Resistance gene-dependant plant defense responses. Plant Cell. 1996;8:1773–1791. doi: 10.1105/tpc.8.10.1773. [DOI] [PMC free article] [PubMed] [Google Scholar]
- Hennig J, Malamy J, Grynkiewicz G, Indumski J, Klessig D. Interconversion of the salicylic acid signal and its glucoside in tobacco. Plant J. 1993;4:593–600. doi: 10.1046/j.1365-313x.1993.04040593.x. [DOI] [PubMed] [Google Scholar]
- Hillocks RJ. Cotton Diseases. Melksham, UK: CAB International Redwood Press; 1992. [Google Scholar]
- Hunter RE, Brinkerhoff LA, Bird LS. Development of a set of Upland cotton lines for differentiating races of Xanthomonas malvacearum. Phytopathology. 1968;58:830–832. [Google Scholar]
- Innes N. Bacterial blight of cotton. Biol Rev. 1983;58:157–176. [Google Scholar]
- Jabs T, Dietrich RA, Dangl JL. Initiation of runaway cell death in an Arabidopsismutant by extracellular superoxide. Science. 1996;273:1853–1856. doi: 10.1126/science.273.5283.1853. [DOI] [PubMed] [Google Scholar]
- Kauss H, Jeblick W. Pretreatment of parsley suspension cultures with salicylic acid enhances spontaneous and elicited production of H2O2. Plant Physiol. 1995;108:1171–1178. doi: 10.1104/pp.108.3.1171. [DOI] [PMC free article] [PubMed] [Google Scholar]
- Kawano T, Sahashi N, Takahashi K, Uozumi N, Muto S. Salicylic acid induces extracellular superoxide generation followed by an increase in cytosolic calcium ion in tobacco suspension culture: the earliest events in salicylic acid signal transduction. Plant Cell Physiol. 1998;39:721–730. [Google Scholar]
- Kvaratskhelia M, Winkel C, Thorneley RNF. Salicylic acid is a reducing substrate and not an effective inhibitor of ascorbate peroxidase. J Biol Chem. 1997;272:20998–21001. doi: 10.1074/jbc.272.34.20998. [DOI] [PubMed] [Google Scholar]
- Lamb C, Dixon R. The oxidative burst in plant disease resistance. Annu Rev Plant Physiol Plant Mol Biol. 1997;48:251–275. doi: 10.1146/annurev.arplant.48.1.251. [DOI] [PubMed] [Google Scholar]
- Leon J, Lawton MA, Raskin I. Hydrogen peroxyde stimulates salicylic acid biosynthesis in tobacco. Plant Physiol. 1995;108:11673–1678. doi: 10.1104/pp.108.4.1673. [DOI] [PMC free article] [PubMed] [Google Scholar]
- Levine A, Tehnaken R, Dixon R, Lamb C. H2O2from the oxidative burst orchestrates the plant hypersensitive disease resistance response. Cell. 1994;6:427–437. doi: 10.1016/0092-8674(94)90544-4. [DOI] [PubMed] [Google Scholar]
- Malamy J, Carr JP, Klessig DF, Raskin I. Salicylic acid: a likely endogenous signal in the resistance response of tobacco to viral infection. Science. 1990;250:1001–1004. doi: 10.1126/science.250.4983.1002. [DOI] [PubMed] [Google Scholar]
- Malamy J, Klessig D. Salicylic acid and plant defense resistance. Plant J. 1992;2:643–654. [Google Scholar]
- Martinez C, Geiger JP, Bresson E, Daniel JF, Dai GH, Andary C, Nicole M. Isoperoxidases are associated with resistance of cotton to Xanthomonas campestris pv. malvacearum(race 18) In: Obinger O, Burner U, Ebermann R, Penel C, Greppin H, editors. Plant Peroxidases: Biochemistry and Physiology. Vienna, Austria: University of Agriculture; 1996. and University of Geneva, Switzerland, pp 327–332. [Google Scholar]
- Martinez C, Montillet JL, Bresson E, Agnel JP, Daï GH, Daniel JF, Geiger JP, Nicole M. Apoplastic peroxidase generates superoxide anions in cells of cotton cotyledons undergoing the hypersensitive reaction to Xanthomonas campestris pv. malvacearumrace 18. Mol Plant-Microbe Interact. 1998;11:1038–1047. [Google Scholar]
- Métraux JP, Signer H, Ryals J, Ward E, Wyss-Benz M, Gaudin J, Raschdorf K, Blum W, Inverardi B. Increase in salicylic acid at the onset of systemic acquired resistance in cucumber. Science. 1990;250:1004–1006. doi: 10.1126/science.250.4983.1004. [DOI] [PubMed] [Google Scholar]
- Mur LAJ, Naylor G, Warner SAJ, Sugars JM, White RF, Draper J. Salicylic acid potentiates defense gene expression in leaf tissue exhibiting acquired resistance to pathogen attack. Plant J. 1996;9:559–571. [Google Scholar]
- Neuenschwander U, Vernooji B, Friedrich L, Uknes S, Kessman H, Ryals J. Is hydrogen peroxide a second messenger of salicylic acid in systemic acquired resistance? Plant J. 1995;8:227–233. [Google Scholar]
- Neuhoff V, Arold N, Taube D, Ehrhardt W. Improved staining of proteins in polyacrylamide gels including isoelectric focusing gels with clear background at nanogram sensitivity using Coomassie Brilliant Blue G-250 and R-250. Electrophoresis. 1988;9:255–262. doi: 10.1002/elps.1150090603. [DOI] [PubMed] [Google Scholar]
- Pieterse CM, Van Wees SCM, Pelt JAV, Knoester M, Laan R, Gerrits H, Weisbeek PJ, Van Loon LC. A novel signaling pathway controlling induced systemic resistance in Arabidopsis. Plant Cell. 1998;10:1571–1580. doi: 10.1105/tpc.10.9.1571. [DOI] [PMC free article] [PubMed] [Google Scholar]
- Rao MV, Paliath G, Ormod DP, Murr DP, Watkins CB. Influence of salicylic acid on H2O2 production, oxidative stress, and H2O2-metabolizing enzymes. Plant Physiol. 1997;115:137–149. doi: 10.1104/pp.115.1.137. [DOI] [PMC free article] [PubMed] [Google Scholar]
- Rasmussen JB, Hammerschmidt R, Zook MN. Systemic induction of salicylic acid accumulation in cucumber after inoculation with Pseudomonas syringae pv. syringae. Plant Physiol. 1991;97:1342–1347. doi: 10.1104/pp.97.4.1342. [DOI] [PMC free article] [PubMed] [Google Scholar]
- Robertson EF, Dannelly HK, Malloy PJ, Reeves HC. Rapid isoelectric focusing in a vertical polyacrylamide minigel system. Anal Biochem. 1987;167:290–294. doi: 10.1016/0003-2697(87)90166-7. [DOI] [PubMed] [Google Scholar]
- Ross AF. Localized acquired resistance to plant virus infection in hypersensitive hosts. Virology. 1961;14:329–339. doi: 10.1016/0042-6822(61)90318-x. [DOI] [PubMed] [Google Scholar]
- Ryals J, Neuenschwander U, Willit M, Molina A, Steiner HY. Systemic acquired resistance. Plant Cell. 1996;8:1899–2019. doi: 10.1105/tpc.8.10.1809. [DOI] [PMC free article] [PubMed] [Google Scholar]
- Seskar M, Shulaev V, Raskin I. Endogenous methyl salicylate in pathogen-inoculated tobacco plants. Plant Physiol. 1998;116:387–392. [Google Scholar]
- Shulaev V, Leon J, Raskin I. Is salicylic a translocated signal of systemic acquired resistance in tobacco? Plant Cell. 1995;7:1691–1701. doi: 10.1105/tpc.7.10.1691. [DOI] [PMC free article] [PubMed] [Google Scholar]
- Shulaev V, Silverman P, Raskin I. Airborne signaling by methyl salicylate in plant pathogen resistance. Nature. 1997;385:718–721. [Google Scholar]
- Smith-Becker J, Marois E, Huguet EJ, Midland SL, Sims JJ, Keen NT. Accumulation of salicylic acid and 4-hydroxybenzoic acid in phloem fluids of cucumber during systemic acquired resistance is preceded by a transient increase in phenylalanine ammonia-lyase activity in petioles and stems. Plant Physiol. 1998;116:231–238. doi: 10.1104/pp.116.1.231. [DOI] [PMC free article] [PubMed] [Google Scholar]
- Sticher L, Mauch-Mani B, Metraux JP. Systemic acquired resistance. Annu Rev Phytopathol. 1997;35:235–270. doi: 10.1146/annurev.phyto.35.1.235. [DOI] [PubMed] [Google Scholar]
- Tenhaken R, Levine A, Brisson L, Dixon R, Lamb C. Function of the oxidative burst in hypersensitive disease resistance. Proc Natl Acad Sci USA. 1995;92:4158–4163. doi: 10.1073/pnas.92.10.4158. [DOI] [PMC free article] [PubMed] [Google Scholar]
- Tiedemann AV. Evidence for a primary role of active oxygen species in induction of host cell death during infection of bean leaves with Botrytis cinerea. Physiol Mol Plant Pathol. 1997;50:151–166. [Google Scholar]
- Uknes S, Mauch-Mani B, Moyer M, Potter S, Williams S, Dincher S, Chandler D, Slusarenko A, Ward E, Ryals J. Acquired resistance in Arabidopsis. Plant Cell. 1992;4:645–656. doi: 10.1105/tpc.4.6.645. [DOI] [PMC free article] [PubMed] [Google Scholar]
- Van Wees SCM, Pieterse CMJ, Trijssenaar A, Van't Westende YAM, Hartog F, Van Loon LC. Differential induction of systemic resistance in Arabidopsis by biocontrol bacteria. Mol Plant-Microbe Interact. 1997;6:716–724. doi: 10.1094/MPMI.1997.10.6.716. [DOI] [PubMed] [Google Scholar]
- Ward ER, Uknes SJ, Williams SC, Dincher SS, Wiederhold DL, Alexander DC, Ahl-Goy P, Ryals JA. Coordinate gene activity in response to agent that induce systemic acquired resistance. Plant Cell. 1991;3:1085–1094. doi: 10.1105/tpc.3.10.1085. [DOI] [PMC free article] [PubMed] [Google Scholar]
- Wasternack C, Parthier B. Jasmonate-signaled gene expression. Trends Plant Sci. 1997;2:302–307. [Google Scholar]
- Wu G, Shortt BJ, Lawrence EB, Leon J, Fitzsimmons KC, Levine EB, Raskin I, Shah DM. Activation of host defense mechanisms by elevated production of H2O2in transgenic plants. Plant Physiol. 1997;115:427–435. doi: 10.1104/pp.115.2.427. [DOI] [PMC free article] [PubMed] [Google Scholar]