

Abstract
The linkage between electronic health records (EHRs) and genotype data makes it plausible to study the genetic susceptibility of a wide range of disease phenotypes. Despite that EHR-derived phenotype data are subjected to misclassification, it has been shown useful for discovering susceptible genes, particularly in the setting of phenome-wide association studies (PheWAS). It is essential to characterize discovered associations using gold standard phenotype data by chart review. In this work, we propose a genotype stratified case-control sampling strategy to select subjects for phenotype validation. We develop a closed-form maximum-likelihood estimator for the odds ratio parameters and a score statistic for testing genetic association using the combined validated and error-prone EHR-derived phenotype data, and assess the extent of power improvement provided by this approach. Compared with case-control sampling based only on EHR-derived phenotype data, our genotype stratified strategy maintains nominal type I error rates, and result in higher power for detecting associations. It also corrects the bias in the odds ratio parameter estimates, and reduces the corresponding variance especially when the minor allele frequency is small.
Keywords: EHR, internal validation, outcome misclassification, PheWAS, sampling strategy
1 | INTRODUCTION
The last decade has seen the identification of a large collection of genetic variants that are associated with a wide range of human phenotypes. It is important to understand biological mechanisms underlying these findings, which may ultimately lead to improved disease prevention or treatment. Understanding pleiotropy, where one genetic variant is associated with multiple phenotypes, is of particular interest. The development of large biobanks that link rich electronic health record (EHR) data and dense genetic information has made it possible to investigate these effects in a cost-effective fashion. In EHR-based genetic association studies, data for a range of phenotypes are extracted from the EHR, and genetic data are obtained from patients’ biological samples. A number of efforts have been made to facilitate EHR-based genetic and genomic research, such as the establishment of the Electronic Medical Records and Genomics network (https://emerge-network.org), the UK Biobank (https://www.ukbiobank.ac. uk), China Kadoorie Biobank (https://www.ckbiobank.org), Precision Medicine Initiative Cohort Program (https://www.nih.gov/precision-medicine-initiative-cohort-program), and Million Veteran Program (https://www.research.va.gov/mvp/). Studies conducted using these EHRs have successfully replicated many reported association findings (Kho et al., 2012; Ritchie et al., 2010), which underscored the feasibility of EHR-based genetic association studies (Hripcsak & Albers, 2013).
EHRs have unique advantages for genetic research. First, they naturally offer large samples, which can easily reach hundreds of thousands of patients. Second, they are cost-effective because EHR data are derived from information collected for routine clinical care, making it unnecessary to separate phenotype subjects. More importantly, unlike classical population- or family-based genetic association studies, EHRs are not limited to phenotypes that were designed to be collected for testing one or several hypotheses. For a genetic variant that has been reported for association with one or a short list of phenotypes, the rich phenotypic information available from EHRs makes it feasible to test association between the variant and the entire spectrum of disease of phenotypes, known as phenome-wide association studies (PheWAS) (Denny et al., 2010; Jones, Pembrey, Golding, & Herrick, 2005). Recent EHR-based PheWAS have demonstrated feasibility and unique advantage of using EHR data and PheWAS phenotyping algorithm to identify genetic associations (Denny et al., 2011, 2013).
Data in EHRs are available in both structured and unstructured formats. Structured data include billing codes, such as the International Classification of Diseases, 9th revision (ICD-9) code that is used to record disease diagnoses and procedures, dispensed medications, and lab results. Unstructured data are usually composed of raw text files generated from clinical encounters, or the prose-based results of imaging tests and other procedures. In the ideal situation, multiple forms of structured and unstructured data can be integrated to precisely determine phenotype status. This can be tedious, time consuming, and expensive, especially when manual review of text documents is required. Therefore, algorithmic combinations of structured data elements are more commonly employed as it is significantly more efficient. Unfortunately, the resultant phenotype is usually error prone. EHR-based studies routinely report the accuracy of phenotyping using only the ICD-9 coding system (Denny et al., 2010; Denny, Bastarache, & Roden, 2016; Liao et al., 2016). The reported positive predictive values (PPVs) for different phenotypes typically ranged between 56% and 89% (Denny, 2012).
Current PheWAS only use billing codes to determine phenotype status (Denny et al., 2011; Kho et al., 2012; Ritchie et al., 2013; Shameer et al., 2014). Relevant ICD-9 codes are mapped to each phenotype, and subsequently subjects are classified as the presence or absence of one specific phenotype of interest. PheWAS also identify a control group separately for each phenotype. Then individual phenotypes are tested in turn for association with the SNP by logistic regression. The method of Bonferroni correction or false discovery rate control (Benjamini & Hochberg, 1995; Benjamini & Yekutieli, 2001) is applied to account for multiplicity in testing multiple phenotypes. PheWAS do not account for phenotype misclassification in SNP-phenotype association testing, because it is largely infeasible to validate all phenotypes, even in a small subsample.
It is widely known that association analysis using misclassified phenotype data results in biased estimates of odds ratio (OR) association parameters and reduced test power (Copeland, Checkoway, McMichael, & Holbrook, 1977; Magder & Hughes, 1997; Quade, Lachenbruch, Whaley, McClish, & Haley, 1980). To understand whether the associations discovered in PheWAS truly reflect underlying biology or due to oversimplified assumption on phenotype inaccuracy, further evaluation and characterization are warranted using gold standard phenotype data derived from chart review. Medical chart review is often performed on a small subset of subjects to validate or develop a phenotyping rule/algorithm, where the subset is selected either randomly or stratified on EHR-derived case-control (CC) status. Due to the small sample size, analysis using merely the validation subset not only is inefficient, but also leads to biased OR estimates and inflated type I error rates, particularly when the minor allele frequency (MAF) of the genetic variant is low. In this paper, we propose to exploit the internally validated subsample to correct the bias in the estimation of OR association parameters due to phenotyping inaccuracy, and investigate whether this strategy can lead to power improvement. Our method is applicable regardless of the strategy used for selecting the validation sub-sample. In addition, we propose a strategy to select validation subsample based on both EHR-derived phenotype status and genotype data, aiming to mitigate the bias and gain more efficiency for analyzing SNPs with low MAF.
2 | METHODS
We consider a situation when the EHR-derived binary phenotype status, denoted as S, and genotype data for a single nucleotide polymorphism (SNP), denoted as X, are observed for each subject. The true phenotype status obtained by medical chart view, denoted as Y, is obtained for a subset of patients who are randomly selected based on S or on both S and X. Let S = 1 denote the status of being a case and S = 0 of being a control based on EHR. Let Y = 1 and Y = 0 be the respective case and control status based on medical chart review that is used as “gold standard.” We adopt a codominant coding for X. That is, for a diallelic SNP with major allele A and minor allele a, X is coded as two dummy variables X1 and X2 taking three possible combinations of values, i.e., X1 = 0 and X2 = 0 for genotype AA, X1 = 1 and X2 = 0 for genotype Aa, and X1 = 0 and X2 = 1 for genotype aa. We specify the relationship between the phenotype status Y and genotypes X by a logistic regression model
| (1) |
where β1 and β2 are the log-OR parameters comparing the likelihood of being diseased for subjects with genotype Aa or aa to those with AA. Our goal is to obtain unbiased estimates of β1 and β2, as well as test the association between the gold standard phenotype status Y and SNP genotype X under the null hypothesis H0∶β1 = β2 = 0. We consider the situation when genotypes X and EHR-derived phenotype S are conditionally independent given Y, i.e., P (S|Y, X) = P (S|Y). That is, the sensitivity (SN) and specificity (SP) of S as a crude measurement for Y is nondifferential.
We consider the scenario that among an EHR cohort of N subjects, the phenotype status Y is obtained only for (n < N) subjects who are selected into the validation subsample. Therefore, estimation of β1 and β2 with the observed data, (Si, Yi, Xi), i = 1, 2, …, n, for the validated subjects and (Sj, Xj), j = n + 1, n + 2, … , N for the nonvalidated subjects, is a missing data problem. Let ψ0 = eα, ψ1 = eβ1, and ψ2 = eβ2. The likelihood function for the observed data can be written as
| (2) |
where Ω = (ψ0, ψ1, ψ2, ϕ, θ) with ϕ = P (S = 1 Y = 1) and θ = P (S = 0|Y = 0) being sensitivity and specificity, respectively.
2.1 | Estimation of β1 and β2
We applied the expectation-maximization (EM) algorithm (Dempster, Laird, & Rubin, 1977) to derive closed form of OR estimates, and obtained the variance of these estimates by applying the Louis formula (Louis, 1982). At the mth iteration of the EM algorithm, define
Let and denote the number of true cases (Y =1) and true controls (Y =0) in the validation data who carry k minor allele(s), respectively, where k=0, 1, 2. The superscript “ν” indicates “validation.” Let and denote the number of EHR-derived cases (S =1) and controls (S =0) in the non-validation subsample who carry k minor alleles, respectively. Define
and
for k = 0, 1, 2. and are the expected number of true cases and true controls in the total samples who carry k minor alleles, respectively. Both of them are influenced by the PPV and the NPV . Then at the (m + 1)th iteration, OR estimates of ψ1 and ψ2 are updated with the closed-form formula
These estimates have similar forms as standard OR estimates if Y were fully observed for all subjects. Using only the validation subsample, OR estimates would be and . It is straightforward to show that these estimates converge to the true parameter values as the sample size increases. Let be the number of subjects in the validation subsample with EHR-derived CC status a and true CC status b. Then sensitivity ϕ and specificity θ are simultaneously updated at each iteration of the EM algorithm by
with the expected cell counts in the cross-tabulation of Y and S for the entire data set equal to
and
2.2 A score test of genetic association
The association test of the null hypothesis H0∶β1=β2=0 using the EHR-derived phenotype status S directly maintains the nominal type I error rate, but may lose power because it only utilizes the information of the error-prone EHR-based phenotype S. A natural question arises on whether association testing based on gold standard phenotype status Y with the validated and error-prone data would have increased power. Let U = (Uβ, Uη) be the score function derived from the likelihood function (2), where Uβ is a vector of scores for the interest parameters (β1, β2) and Uη is a vector of scores for the nuisance parameters η = (α, ϕ, θ). In particular, Uβ can be estimated as
where the estimated phenotype prevalence
and the conditional expectation
with being the maximize likelihood estimator (MLE) obtained under H0. By Louis’s method (Louis, 1982), the variance-covariance matrix of U is determined as
where J is the negative of the second derivative matrix of the log-likelihood function for the complete data if Y were observed for all subjects, Ep(J) is the conditional expectation of J given observed data, and superscript “T ” denotes vector transpose. The second term in V (U) is the penalty due to the unknown gold standard phenotype status in the nonvalidation sample. The variance of Uβ under H0, which accounts for the variance of estimating sensitivity and specificity, is equal to , where Vββ, Vβη, Vηβ, and Vηη are the appropriate submatrices of the matrix V (U) with
The score statistic is constructed as , which follows a χ2 distribution with two degrees of freedom under the null hypothesis.
2.3 | A genotype-stratified CC study design
The selection of the validation subsample affects the efficiency of the OR parameter estimates and as well as the power of association test based on the score statistic T. Subjects can be selected randomly, but the majority of the selected would be controls when the phenotype prevalence is low. To mitigate this problem, it is more common to select the same number of EHR-derived cases and controls. But even under this design, when the MAF of the SNP of interest is low, only a small number of the selected would be homozygous in the minor allele. Therefore, both sampling methods, referred to as the completely random (CR) and CC design below, can lead to large variance for the estimates and and inflated type I error rate for the association test based on T in finite samples.
Following an idea of balanced two-phase design (Breslow & Cain, 1988), we propose a genotype-stratified CC (GS-CC) design for selecting the validation subsample. From a 2-by-3 contingency table of the EHR-based phenotype S and the genotype X, GS-CC strives to select comparable numbers of subjects from the six cells. When the phenotype prevalence is low and MAF is small, the counts in some cells may be too small to allow the balanced selection. Then GS-CC selects all subjects in the cells with low counts and similar numbers from the remaining cells. Therefore, in addition to balancing the numbers of EHR-based cases and controls, GS-CC also balances the selected number of the three genotypes. Consequently, when MAF is small, GS-CC selects more subjects with the rare genotype aa. The two-phase design was proposed mainly for addressing the expensive covariate problem when it is feasible to measure covariates only for a selected subset of subjects. The GS-CC design applies the same idea to address the “expensive phenotyping” problem where the medical chart review can only be conducted for a selected subset of subjects to obtain “gold standard” CC status.
3 | SIMULATION STUDIES
We conducted extensive simulation studies to evaluate the finite sample performance of the three designs, namely, GS-CC, CR, and CC. The comparisons include the relative estimation efficiency, the type I error rate and power of the proposed score test. We first generated SNP genotype data under Hardy-Weinberg equilibrium using MAF 0.1 or 0.3, and then generated phenotype data Y from model (1). We used the log additive model for the log-OR parameters in model (1), with β2 = 2β1 and β1 taking values that were reported in the Phe-WAS literature (Denny et al., 2010, 2013), log (1.3), log (1.5), or log (2). The intercept parameter α in model (1) was chosen so that the phenotype prevalence P (Y = 1) was equal to 0.05 or 0.2, corresponding to rare or common phenotypes. The total sample size N in each scenario was determined so that 90% power can be achieved by the standard score test in the absence of phenotype misclassification. The error-prone phenotype data S were then generated according to given sensitivity and specificity. At the same sensitivity and specificity, the PPV value would be higher for a common phenotype and lower for a rare phenotype. To ensure reasonable PPV values in each scenario, different ranges of specificity were determined according to the phenotype prevalence (i.e., from 0.8 to 0.98 at prevalence of 0.20; from 0.96 to 0.99 at prevalence of 0.05). Sensitivity was set as 0.6, 0.8, or 0.9. A validation subsample of size 200–400 was selected for each of the three sampling methods. All the simulations were repeated 2,000 times. We considered six methods for testing associations: (1) standard method, where the standard score test was performed in the data without any phenotype misclassification; (2) naïve method, where the EHR-derived phenotype was used directly as outcome in the association test; (3) validation only method, where only the validated subsample was used in the standard score test; (4–6) our proposed score test under CR, CC, and GS-CC sampling designs.
3.1 | Estimation of OR parameters
Results on the OR parameter estimation are presented in Table 1. The estimated log-OR parameters appeared to be severely biased using the naïve method, particularly for β2 (Table 1a), with bias increasing as MAF or specificity decreases. In contrast, our estimates that utilized the validation subsample appeared to be unbiased or much less biased under all three sampling designs (“CR,” “CC,” “GS-CC”). When the MAF was small (0.1) and misclassification rates were high, the bias for the β2 estimate was much larger under CR and CC than that under GS-CC. The bias became much less severe as the MAF, sensitivity, and specificity became larger. Estimates under GS-CC appeared to have smaller standard error than those under CR and CC, with greater reduction in variance for the estimated β2, the log-OR for the rare genotype, when the MAF is small. For example, with MAF 0.1 as well as sensitivity and specificity both 0.8, the variance under GS-CC was 68% smaller than that under CC (Table 1a).
TABLE 1.
Simulation Results on the Estimated Log ORsa
| MAF | log(OR) | (a) Common Phenotypeb | (b) Rare Phenotypec | |||||||
|---|---|---|---|---|---|---|---|---|---|---|
| Naïve | CR | CC | GS-CC | Naïve | CR | CC | GS-CC | |||
| 0.1 | β1 = 0.262 | Bias | −0.145 | 0.004 | 0.003 | 0.0001 | −0.127 | 0.002 | −0.002 | −0.0001 |
| SD | 0.078 | 0.154 | 0.150 | 0.148 | 0.077 | 0.152 | 0.134 | 0.132 | ||
| β2 = 0.525 | Bias | −0.290 | −0.092 | −0.091 | −0.031 | −0.269 | −0.133 | −0.117 | −0.059 | |
| SD | 0.302 | 0.667 | 0.674 | 0.382 | 0.292 | 0.767 | 0.627 | 0.391 | ||
| 0.3 | β1 = 0.262 | Bias | −0.148 | 0.005 | 0.001 | 0.002 | −0.133 | 0.007 | −0.0002 | 0.0004 |
| SD | 0.065 | 0.136 | 0.133 | 0.137 | 0.064 | 0.146 | 0.120 | 0.121 | ||
| β2 = 0.525 | Bias | −0.285 | −0.002 | −0.004 | −0.007 | −0.253 | 0.002 | −0.006 | −0.006 | |
| SD | 0.112 | 0.217 | 0.209 | 0.191 | 0.102 | 0.206 | 0.179 | 0.169 | ||
Validation sample size is 400.
Total sample size = 5,000, P(S = 1|Y = 1) = 0.8, P(S = 0|Y = 0) = 0.8, and P(Y = 1) = 0.2.
Total sample size = 15,000, P(S = 1|Y = 1) = 0.8, P(S = 0|Y = 0) = 0.96, and P(Y = 1) = 0.05.
3.2 | Type I error rates and power
With a sufficiently large validation subsample, the score test that we derived should be a valid test as long as the subsamples are randomly selected and the selection does not depend on the true phenotype status. However, substantial validation effort is practically not realistic. We therefore investigated the validity of the score test under three sampling schemes with reasonable sample sizes of validation data.
Table 2 displays type I error rates under both common (prevalence = 0.2) and rare phenotypes (prevalence = 0.05). As expected, the naïve method maintained the nominal type I error rate in all the considered scenarios. The type I error rates were inflated under CR when the phenotype was rare or when the misclassification rate was high for a common phenotype. The inflation persisted under CR even with large MAF (0.3) when the phenotype prevalence was low. The inflation was also observed under CC when the MAF and specificity were both low. However, the type I error rates under GS-CC appeared to be close to 0.05 under all simulation scenarios.
TABLE 2.
Type I Error Rates of Four Considered Methods at Nominal Level 0.05
| Common Phenotype (Prevalence = 0.2) | |||||||||
|---|---|---|---|---|---|---|---|---|---|
| SN | SP | MAF = 0.1 | MAF = 0.3 | ||||||
| Naïve | CR | CC | GS-CC | Naïve | CR | CC | GS-CC | ||
| 0.6 | 0.80 | 0.049 | 0.083 | 0.072 | 0.054 | 0.045 | 0.057 | 0.061 | 0.053 |
| 0.85 | 0.046 | 0.074 | 0.066 | 0.048 | 0.055 | 0.062 | 0.059 | 0.055 | |
| 0.90 | 0.045 | 0.064 | 0.055 | 0.053 | 0.045 | 0.061 | 0.055 | 0.047 | |
| 0.95 | 0.049 | 0.059 | 0.054 | 0.051 | 0.053 | 0.062 | 0.058 | 0.059 | |
| 0.98 | 0.049 | 0.053 | 0.048 | 0.052 | 0.050 | 0.053 | 0.056 | 0.055 | |
| 0.8 | 0.80 | 0.052 | 0.073 | 0.066 | 0.054 | 0.052 | 0.061 | 0.060 | 0.056 |
| 0.85 | 0.044 | 0.058 | 0.055 | 0.052 | 0.047 | 0.054 | 0.045 | 0.050 | |
| 0.90 | 0.050 | 0.062 | 0.058 | 0.057 | 0.058 | 0.057 | 0.056 | 0.055 | |
| 0.95 | 0.049 | 0.055 | 0.052 | 0.049 | 0.053 | 0.054 | 0.050 | 0.050 | |
| 0.98 | 0.050 | 0.052 | 0.051 | 0.045 | 0.049 | 0.047 | 0.051 | 0.051 | |
| 0.9 | 0.80 | 0.053 | 0.075 | 0.075 | 0.060 | 0.049 | 0.055 | 0.053 | 0.050 |
| 0.85 | 0.049 | 0.058 | 0.059 | 0.047 | 0.048 | 0.053 | 0.053 | 0.054 | |
| 0.90 | 0.048 | 0.055 | 0.055 | 0.051 | 0.048 | 0.055 | 0.048 | 0.049 | |
| 0.95 | 0.046 | 0.053 | 0.052 | 0.044 | 0.048 | 0.051 | 0.052 | 0.051 | |
| 0.98 | 0.049 | 0.050 | 0.051 | 0.045 | 0.049 | 0.051 | 0.050 | 0.049 | |
| Rare Phenotype (Prevalence = 0.05) | |||||||||
| SN | SP | MAF = 0.1 | MAF = 0.3 | ||||||
| Naïve | CR | CC | GS-CC | Naïve | CR | CC | GS-CC | ||
| 0.6 | 0.96 | 0.049 | 0.094 | 0.063 | 0.047 | 0.043 | 0.088 | 0.049 | 0.049 |
| 0.97 | 0.050 | 0.093 | 0.061 | 0.042 | 0.052 | 0.090 | 0.055 | 0.052 | |
| 0.98 | 0.046 | 0.082 | 0.058 | 0.046 | 0.047 | 0.085 | 0.050 | 0.047 | |
| 0.987 | 0.043 | 0.082 | 0.051 | 0.044 | 0.049 | 0.074 | 0.048 | 0.047 | |
| 0.993 | 0.053 | 0.072 | 0.053 | 0.046 | 0.051 | 0.068 | 0.052 | 0.052 | |
| 0.8 | 0.96 | 0.052 | 0.097 | 0.068 | 0.052 | 0.049 | 0.082 | 0.053 | 0.051 |
| 0.97 | 0.053 | 0.097 | 0.068 | 0.053 | 0.051 | 0.082 | 0.057 | 0.057 | |
| 0.98 | 0.052 | 0.076 | 0.057 | 0.051 | 0.047 | 0.067 | 0.049 | 0.046 | |
| 0.987 | 0.046 | 0.072 | 0.046 | 0.045 | 0.045 | 0.062 | 0.048 | 0.048 | |
| 0.993 | 0.049 | 0.065 | 0.048 | 0.048 | 0.050 | 0.059 | 0.052 | 0.053 | |
| 0.9 | 0.96 | 0.045 | 0.088 | 0.067 | 0.046 | 0.052 | 0.079 | 0.052 | 0.053 |
| 0.97 | 0.053 | 0.091 | 0.065 | 0.046 | 0.048 | 0.074 | 0.054 | 0.053 | |
| 0.98 | 0.052 | 0.084 | 0.059 | 0.051 | 0.049 | 0.067 | 0.049 | 0.050 | |
| 0.987 | 0.046 | 0.067 | 0.051 | 0.044 | 0.050 | 0.061 | 0.047 | 0.049 | |
| 0.993 | 0.047 | 0.055 | 0.047 | 0.041 | 0.043 | 0.052 | 0.047 | 0.045 | |
Type I error rates given in bold were inflated.
Figure 1 shows heatmaps of test powers of two tests (naïve and GS-CC) when the phenotype prevalence was 0.2, MAF was 0.3, and OR was 1.3. Our proposed test under GS-CC appeared to be more powerful across all combinations of sensitivity and specificity that we considered. Even at a high sensitivity of 0.9 and specificity of 0.95, the power of the naïve method was as low as 44.5%, which was only about half the power that the sample size could afford in the absence of misclassification. With the internal validation subsample selected under GS-CC sampling, the power increased to 64%, representing 50% increase compared with the naïve method.
FIGURE 1.
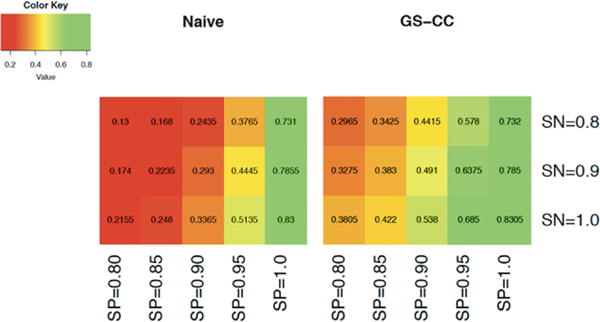
Heatmaps for the powers of two tests: test based on the EHR-derived phenotype only (naïve) and proposed score test under GS-CC sampling. The parameters were set as follows: phenotype prevalence = 0.05, MAF = 0.3, OR = 1.3, total sample size = 7,000, and validation subsample size = 400
Figures 2 and 3 display the power of the six methods in a wide range of simulation scenarios when the phenotype prevalence was 0.2, although we recognized that some might have inflated type I error rates. The naïve method (naïve) can have substantially lower power. Incorporating the internal validation subsample led to increased power in all scenarios, even when the phenotyping accuracy was very high. For example, when sensitivity was 0.9 and specificity was 0.85 in Figure 3A, the power under GS-CC sampling was 0.81 while that of the naïve method was only 0.56. GS-CC outperformed CR and CC in all scenarios displayed in Figures 2 and 3. With increased sensitivity and specificity, the power of all methods approached that of the ideal scenario where the true phenotype data were available for all subjects (standard). The specificity appeared to have larger impact on power. Lower specificity led to dramatically reduced power because more controls were misclassified as cases. Results when the phenotype prevalence was 0.05 (supplementary Figs. S1 and S2) were largely similar, except that GS-CC and CC had similar power.
FIGURE 2.
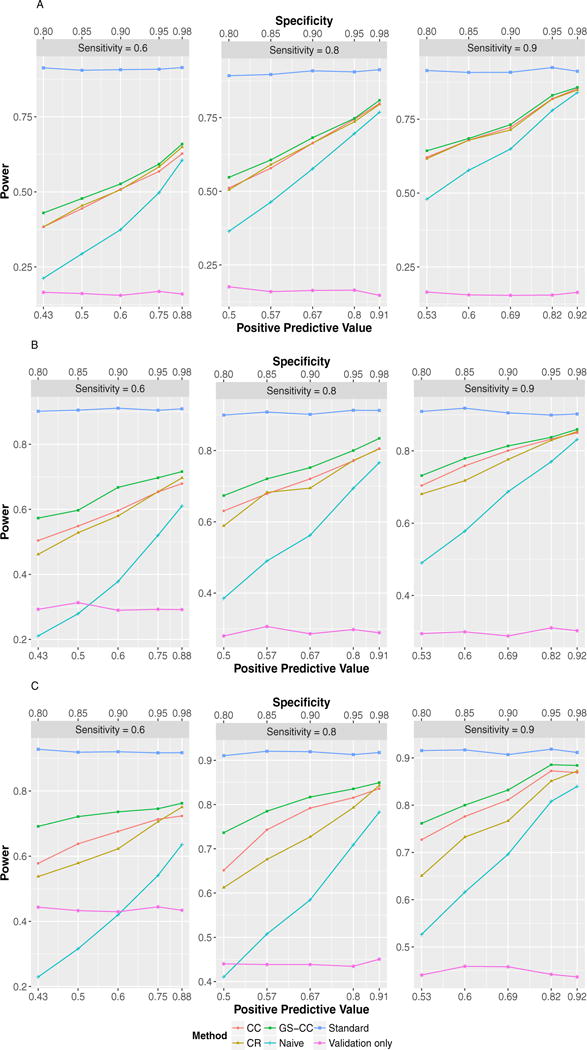
Test powers in common phenotype scenarios (prevalence = 0.2) with MAF 0.1. (A) OR = 1.3, total sample size = 6,000, validation subsample = 400; (B) OR = 1.5, total sample size = 2,400, validation subsample = 400; (C) OR = 2.0, total sample size = 800, validation subsample = 200
FIGURE 3.
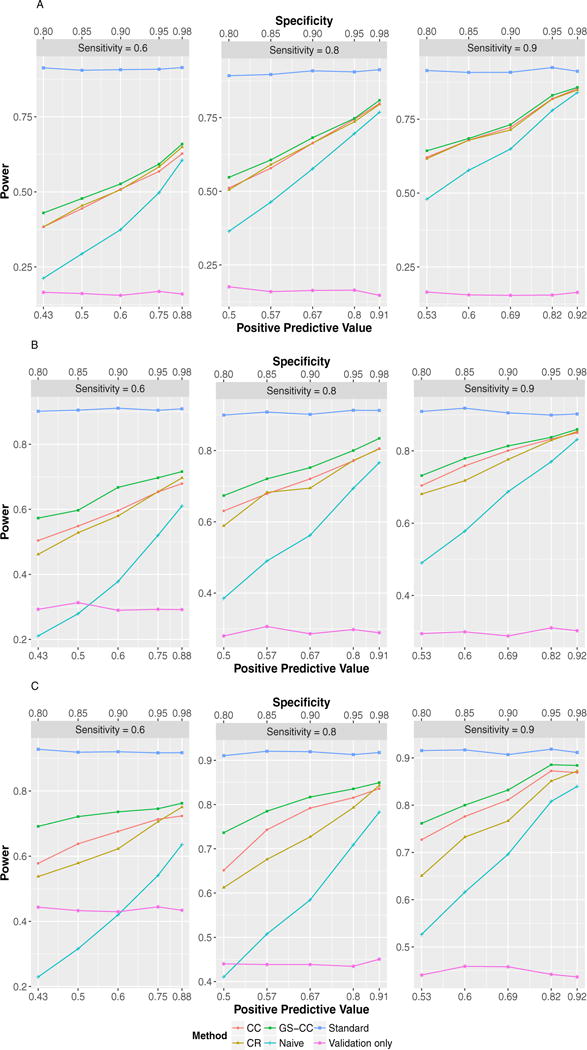
Test powers in common phenotype scenarios (prevalence = 0.2) with MAF 0.3. (A) OR = 1.3, total sample size = 2,900, validation subsample = 400; (B) OR = 1.5, total sample size = 1,150, validation subsample = 300; (C) OR = 2.0, total sample size = 390, validation subsample = 100
4 | DISCUSSION
Because of the large number of phenotypes explored in PheWAS, phenotyping based only on the ICD-9 billing codes is the feasible choice. However, the resultant phenotype status suffers misclassification. Errors in phenotype data may lead to underpowered association tests, which might partially explain why PheWAS may fail to replicate some associations reported from genome-wide association study (GWAS) (Denny et al., 2013). In addition, OR parameter estimates in PheWAS were generally smaller than those reported in the NHGRI Catalog (Denny et al., 2013), and the attenuation may also be partially due to phenotype misclassification. To evaluate a SNP-phenotype association that is observed in PheWAS, we proposed new statistical methods to account for phenotype misclassification through utilization of an internal subsample of phenotypes validated from medical chart review. The value of the validated phenotype data in association analyses has been considered in the literature. Estimated misclassification rates from external sources can be used to account for misclassification (Carroll, Ruppert, Stefanski, & Crainiceanu, 2006; Luan, Pan, Gerberich, & Carlin, 2005). Alternatively, when controls are accurately selected, the algorithm-derived probability of being a case can be directly applied for association testing based on a logistic regression model for the binary phenotype status (Sinnott et al., 2014). When gold standard phenotype data for a group of subjects are obtained through medical chart review, it was found that combining validated and error-prone data through a chi-squared test statistic led to increased power (McDavid et al., 2013). But their test statistic is subjected to inflated type I error rates. Our estimation and testing methods represent powerful new strategies.
Our simulation results showed that inclusion of validation subsamples through the proposed score test may lead to substantially increased power. The test that used only the misclassified phenotype data can have severe power loss depending on the values of sensitivity and specificity. The GS-CC design can improve validity and efficiency for characterizing associations discovered using EHR-derived phenotype data. We believe that it is worthwhile also because it can be implemented as simple as the CC design. It has well-controlled type I error rates regardless of the MAF of the test SNP, phenotype misclassification rates, and phenotype prevalence, while CC and CR designs may have inflated type I error rates when the MAF is low or misclassification rate is high. GS-CC can lead to higher power than CC and CR designs, especially when the phenotype prevalence is not low. In supplementary Figures S1 and S2, GS-CC and CC had similar powers due to the small number of true cases. In this case, or generally when the phenotype is rare, the number of subjects with phenotype present may not be large enough to enable a balanced selection in GS-CC. That is, lack of a sufficient number of true cases may lead to similar selection of subjects by GS-CC and CC, and therefore similar power. Besides power increase, GS-CC, coupled with the proposed estimation methods, corrects the bias of the OR estimates and greatly reduces the variance particularly when the MAF is low.
We conservatively considered the situation that only one SNP-phenotype association need to be validated post Phe-WAS. When more than one phenotype is associated with the variant, separate validation subsamples should be obtained for each phenotype. Following the current practice of Phe-WAS, we considered that each phenotype was tested separately. A pleiotropic effect would be suggested if the variant was associated with multiple phenotypes. The power of Phe-WAS can potentially be improved if the correlations among the phenotypes can be exploited through suitable multivariate approaches similar as in GWAS (Klei, Luca, Devlin, & Roeder, 2008; O’Reilly et al., 2012; Stephens, 2013; Van der Sluis, Posthuma, & Dolan, 2013). This is an important topic to consider, but unfortunately using ICD-9 codes for phenotyping in current PheWAS has largely limited this potential. This is because the identified cases across phenotypes hardly overlap in our experience. It is critical to improve phenotyping practice in PheWAS to fulfill this promise. Another benefit of multivariate approach is to reduce the testing multiplicity. The Bonferroni and Benjamini-Hochberg procedures (Benjamini & Hochberg, 1995), which are routinely used in PheWAS to adjust for multiple testing, treat tests of individual phenotypes as independent and therefore are conservative in the presence of strong correlation between phenotypes.
The GS-CC design is based only on one single SNP. When more than one SNP is of interest for association with a spectrum of phenotypes, the analysis should then be considered as multiple PheWAS. And naturally separate validation subsamples should be selected for each phenotype. Otherwise, the selection of the validation subsample should be based on the one that has the most potential of power increase under GS-CC. In this case, we note that PheWAS study genetic variants reported in the NHGRI catalogue, which are largely in linkage equilibrium. Therefore, for genetic variants not involved in GS-CC sampling, the analysis can be done just like CC design with a similar efficiency. The choice of the genetic variant also relies on the desire of power increase, which is affected by the sample size of cohort data, the magnitude of the effect size, and the MAF. For example, if the power under CC or even the naïve method is close to 80% for one specific SNP, there is little desire to improve it by using GS-CC, and therefore sampling on the other SNP might be more valuable.
We did not consider covariates in the current work. When some confounding variables are present, association testing using only the error-prone phenotype can have inflated type I error rates. Our proposed methods can be extended if the EHR-derived phenotype is independent of the genotype and covariates conditional on true CC status. One such example is to control for different EHR study sites. The sensitivity, specificity, and prevalence of the EHR-derived phenotype may vary across sites given the heterogeneity of the EHR system. When the covariates are discrete, a straightforward extension of our methods is to perform the analysis within each stratum defined by distinct covariate values and then summarize stratum-specific results.
In summary, our proposed GS-CC sampling design, together with the accompanying methods of estimation and testing, provides a useful solution to address the challenge of phenotype misclassification in EHR-based genetic association studies. We will extend our methods to incorporate continuous covariates including population stratification.
Supplementary Material
Acknowledgments
This work was supported, in part, by the NIH grant R01-ES016626 (L.W., J.C.) and a PA CURE grant (J.H.M., J.C.) from the Pennsylvania Department of Health, USA. All authors have no conflict of interest to declare.
Footnotes
SUPPORTING INFORMATION
Additional Supporting Information may be found online in the supporting information tab for this article.
ORCID
Lu Wang iDhttp://orcid.org/0000-0002-1737-686X
Jinbo Chen iDhttp://orcid.org/0000-0003-3174-2552
References
- Benjamini Y, Hochberg Y. Controlling the false discovery rate: A practical and powerful approach to multiple testing. Journal of the Royal Statistical Society. Series B (Methodological) 1995;57(1):289–300. [Google Scholar]
- Benjamini Y, Yekutieli D. The control of the false discovery rate in multiple testing under dependency. Annals of Statistics. 2001;29(4):1165–1188. [Google Scholar]
- Breslow NE, Cain KC. Logistic regression for two-stage case-control data. Biometrika. 1988;75(1):11–20. [Google Scholar]
- Carroll RJ, Ruppert D, Stefanski LA, Crainiceanu CM. Measurement error in nonlinear models: a modern perspective. CRC Press; 2006. [Google Scholar]
- Copeland KT, Checkoway H, McMichael AJ, Holbrook RH. Bias due to misclassification in the estimation of relative risk. American Journal of Epidemiology. 1977;105(5):488–495. doi: 10.1093/oxfordjournals.aje.a112408. [DOI] [PubMed] [Google Scholar]
- Dempster AP, Laird NM, Rubin DB. Maximum likelihood from incomplete data via the EM algorithm. Journal of the Royal Statistical Society. Series B (Methodological) 1977;39(1):1–38. [Google Scholar]
- Denny JC. Mining electronic health records in the genomics era. PLoS Computational Biology. 2012;8(12):e1002823. doi: 10.1371/journal.pcbi.1002823. https://doi.org/10.1371/journal.pcbi.1002823. [DOI] [PMC free article] [PubMed] [Google Scholar]
- Denny JC, Bastarache L, Ritchie MD, Carroll RJ, Zink R, Mosley JD, et al. Systematic comparison of phenome-wide association study of electronic medical record data and genome-wide association study data. Nature Biotechnology. 2013;31(12):1102–1111. doi: 10.1038/nbt.2749. [DOI] [PMC free article] [PubMed] [Google Scholar]
- Denny JC, Bastarache L, Roden DM. Phenome-wide association studies as a tool to advance precision medicine. Annual Review of Genomics and Human Genetics. 2016;17:353–373. doi: 10.1146/annurev-genom-090314-024956. [DOI] [PMC free article] [PubMed] [Google Scholar]
- Denny JC, Crawford DC, Ritchie MD, Bielinski SJ, Basford MA, Bradford Y, Andrade M. Variants near FOXE1 are associated with hypothyroidism and other thyroid conditions: Using electronic medical records for genome-and phenome-wide studies. American Journal of Human Genetics. 2011;89(4):529–542. doi: 10.1016/j.ajhg.2011.09.008. [DOI] [PMC free article] [PubMed] [Google Scholar]
- Denny JC, Ritchie MD, Basford MA, Pulley JM, Bastarache L, Brown-Gentry K, Crawford DC. PheWAS: Demonstrating the feasibility of a phenome-wide scan to discover gene disease associations. Bioinformatics. 2010;26(9):1205–1210. doi: 10.1093/bioinformatics/btq126. [DOI] [PMC free article] [PubMed] [Google Scholar]
- Hripcsak G, Albers DJ. Next-generation phenotyping of electronic health records. Journal of the American Medical Informatics Association. 2013;20(1):117–121. doi: 10.1136/amiajnl-2012-001145. [DOI] [PMC free article] [PubMed] [Google Scholar]
- Jones R, Pembrey M, Golding J, Herrick D. The search for genotype/phenotype associations and the phenome scan. Paediatric and Perinatal Epidemiology. 2005;19(4):264–275. doi: 10.1111/j.1365-3016.2005.00664.x. [DOI] [PubMed] [Google Scholar]
- Kho AN, Hayes MG, Rasmussen-Torvik L, Pacheco JA, Thompson WK, Armstrong LL, Lowe WL. Use of diverse electronic medical record systems to identify genetic risk for type 2 diabetes within a genome-wide association study. Journal of the American Medical Informatics Association. 2012;19(2):212–218. doi: 10.1136/amiajnl-2011-000439. [DOI] [PMC free article] [PubMed] [Google Scholar]
- Klei L, Luca D, Devlin B, Roeder K. Pleiotropy and principal components of heritability combine to increase power for association analysis. Genetic Epidemiology. 2008;32(1):9–19. doi: 10.1002/gepi.20257. [DOI] [PubMed] [Google Scholar]
- Liao KP, Sparks JA, Hejblum B, Kuo IH, Cui J, Lahey L, Cai T. Phenome-wide association study of autoantibodies to citrullinated and non-citrullinated epitopes in rheumatoid arthritis. Arthritis & Rheumatology. 2016;69(4):742–749. doi: 10.1002/art.39974. https://doi.org/10.1002/art.39974. [DOI] [PMC free article] [PubMed] [Google Scholar]
- Louis TA. Finding the observed information matrix when using the EM algorithm. Journal of the Royal Statistical Society. Series B (Methodological) 1982;44(2):226–233. [Google Scholar]
- Luan X, Pan W, Gerberich SG, Carlin BP. Does it always help to adjust for misclassification of a binary outcome in logistic regression? Statistics in Medicine. 2005;24(14):2221–2234. doi: 10.1002/sim.2094. [DOI] [PubMed] [Google Scholar]
- Magder LS, Hughes JP. Logistic regression when the outcome is measured with uncertainty. American Journal of Epidemiology. 1997;146(2):195–203. doi: 10.1093/oxfordjournals.aje.a009251. [DOI] [PubMed] [Google Scholar]
- McDavid A, Crane PK, Newton KM, Crosslin DR, McCormick W, Weston N, Carlson CS. Enhancing the power of genetic association studies through the use of silver standard cases derived from electronic medical records. PLoS One. 2013;8(6):e63481. doi: 10.1371/journal.pone.0063481. https://doi.org/10.1371/journal.pone.0063481. [DOI] [PMC free article] [PubMed] [Google Scholar]
- O’Reilly PF, Hoggart CJ, Pomyen Y, Calboli FC, Elliott P, Jarvelin MR, Coin LJ. MultiPhen: Joint model of multiple phenotypes can increase discovery in GWAS. PLoS One. 2012;7(5):e34861. doi: 10.1371/journal.pone.0034861. https://doi.org/10.1371/journal.pone.0034861. [DOI] [PMC free article] [PubMed] [Google Scholar]
- Quade D, Lachenbruch PA, Whaley FS, McClish DK, Haley RW. Effects of misclassifications on statistical inferences in epidemiology. American Journal of Epidemiology. 1980;111(5):503–515. doi: 10.1093/oxfordjournals.aje.a112930. [DOI] [PubMed] [Google Scholar]
- Ritchie MD, Denny JC, Crawford DC, Ramirez AH, Weiner JB, Pulley JM, Roden DM. Robust replication of genotype-phenotype associations across multiple diseases in an electronic medical record. American Journal of Human Genetics. 2010;86(4):560–572. doi: 10.1016/j.ajhg.2010.03.003. [DOI] [PMC free article] [PubMed] [Google Scholar]
- Ritchie MD, Denny JC, Zuvich RL, Crawford DC, Schildcrout JS, Bastarache L, Roden DM. Genome- and phenome-wide analyses of cardiac conduction identifies markers of arrhythmia risk. Clinical perspective. Circulation. 2013;127(13):1377–1385. doi: 10.1161/CIRCULATIONAHA.112.000604. [DOI] [PMC free article] [PubMed] [Google Scholar]
- Shameer K, Denny JC, Ding K, Jouni H, Crosslin DR, De Andrade M, Kullo IJ. A genome- and phenome-wide association study to identify genetic variants influencing platelet count and volume and their pleiotropic effects. Human Genetics. 2014;133(1):95–109. doi: 10.1007/s00439-013-1355-7. [DOI] [PMC free article] [PubMed] [Google Scholar]
- Sinnott JA, Dai W, Liao KP, Shaw SY, Ananthakrishnan AN, Gainer VS, Cai T. Improving the power of genetic association tests with imperfect phenotype derived from electronic medical records. Human genetics. 2014;133(11):1369–1382. doi: 10.1007/s00439-014-1466-9. [DOI] [PMC free article] [PubMed] [Google Scholar]
- Stephens M. A unified framework for association analysis with multiple related phenotypes. PLoS One. 2013;8(7):e65245. doi: 10.1371/journal.pone.0065245. https://doi.org/10.1371/journal.pone.0065245. [DOI] [PMC free article] [PubMed] [Google Scholar]
- Van der Sluis S, Posthuma D, Dolan CV. TATES: Efficient multivariate genotype-phenotype analysis for genome-wide association studies. PLoS Genetics. 2013;9(1):e1003235. doi: 10.1371/journal.pgen.1003235. https://doi.org/10.1371/journal.pgen.1003235. [DOI] [PMC free article] [PubMed] [Google Scholar]
Associated Data
This section collects any data citations, data availability statements, or supplementary materials included in this article.