Abstract
Procyanidins are polyphenols abundant in dietary fruits, vegetables, nuts, legumes, and grains with a variety of chemopreventive biological effects. Rapid structure determination of these compounds is needed, notably for the more complex polymeric procyanidins. We review the recent developments in the structure elucidation of procyanidins with a focus on mass spectrometric approaches, especially liquid chromatography-tandem mass spectrometry (LC-MS/MS) and matrix-assisted laser desorption ionization (MALDI) MS/MS.
Keywords: Procyanidins, oligomeric, polymeric, structure elucidation
Introduction
Polyphenols are the largest group of secondary plant metabolites; their structural determination has been an intense area of investigation (Balas and Vercauteren 1994). Within polyphenols, procyanidins are derived from proanthocyanidins, also known as condensed tannins (Han et al. 2007). Procyanidins and proanthocyanidins naturally occur throughout the plant kingdom; commonly found with varying concentrations in commonly consumed foods such as fruits, vegetables, legumes, grains, and nuts (Table 1) (Gu et al. 2004; Han et al. 2007; Wang et al. 2011), as well as cosmetics (Kamimural et al. 2000) and pharmaceuticals (Fine 2003; Han et al. 2007; Wang et al. 2011) containing plant materials.
Table 1. Commonly consumed Foods Containing Procyanidins.
Commonly consumed food that have been found to contain procyanidins. (Gu et al. 2004; U.S. Department of 2004; Hellström et al. 2009)
| Fruits | ||
|
| ||
| apple | grape | quinces |
| apricot | kiwi fruit | raspberry |
| avocado | lingonberry | red currant |
| banana | lychee | rhubarb |
| bilberry | mango | rose hip |
| black currant | marionberry | rowanberry |
| blackberry | nectarine | Saskatoon berry |
| blueberry | orange | sea buckthorn |
| cherry | peach | strawberry |
| chokeberry | pear | sweet rowanberry |
| cloudberry | persimmons | tangerine |
| cranberry | pineapple | tomatoes |
| crowberry | plum | watermelon |
| dates, deglet noor | pomegranate | whortleberry |
| gooseberry | ||
|
| ||
| Vegetables | ||
|
| ||
| carrots | indian squash | pepper |
| eggplant | lettuce | potato |
| figs | onion | zucchini |
|
| ||
| Nuts, Legumes, Grains, Miscellaneous | ||
|
| ||
| almonds | chickpeas | sorghum |
| cashews | faba beans | wheat flours
|
| hazelnut | french beans | cinnamon |
| peanuts | kidney beans | dark/milk chocolate |
| pecan | lentils | hops |
| pistachio | pinto beans | tea beverage |
| walnuts | white beans | red wine |
|
|
||
| black beans | barley flour | white wine |
| black eye peas | buckwheat grits/flour | rose wine |
| cacao beans | rice | sherry wine |
The study of proanthocyanidins began with Jacques Masquelier in the 1940s with the investigation of the pine bark that Native Americans brewed to heal scurvy (Rastogi et al. 2015). Masquelier identified monomeric proanthocyanidins within the pine bark preparation, noted their safety, and characterized some of their biological activities. Continuing to be used as natural and alternative medicines, products rich in proanthocyanidins entered the natural product market as dietary supplements during the 1980s (Fine 2003).
As natural antioxidants, proanthocyanidins are used to stabilize food colors and to prevent rancidity due to oxidation of unsaturated fats (Malien-Aubert et al. 2002; Li and Deinzer 2009; Hellenbrand et al. 2015) as well as for chemoprevention of a variety of degenerative diseases (Shi et al. 2003; Faria et al. 2006; Han et al. 2007). In addition to antioxidant properties, procyanidins have been reported to exhibit anticancer (Gossé et al. 2005; Martin et al. 2013; Li et al. 2015), anti-infectious (Chaves and Gianfagna 2007), anti-inflammatory (Gentile et al. 2012; Tatsuno et al. 2012; Vázquez-Agell et al. 2013), cardioprotective (de Pascual-Teresa et al. 2010; Arranz et al. 2013), antimicrobial (Benavente-García et al. 1997), antiviral (Kimmel et al. 2011), antimutagenic (Duan et al. 2010), wounding healing (Zhang et al. 2016), antihyperglycemic (Montagut et al. 2010) as well as anti-allergic (Akiyama et al. 2000) activities.
Plants metabolites such as carbohydrates, fats, and proteins can form complexes with procyanidins that interfere with their extraction and isolation (Jakobek 2015). Solvents that have been used are methanol, ethanol, water, dimethylsulfoxide, acetone, and other similar alcohols. Gel permeation chromatography may then be used to obtain fractions enriched in procyanidins (Sui et al. 2016). Different approaches to extraction and subsequent chromatographic isolation of these compounds have contributed to the uncertainty regarding procyanidin concentrations in plant and foods (Tsao 2010).
An area that needs attention is the quantitative analysis of procyanidins. Adamson et al. (1999) analyzed procyanidins up to decamers in size using gel permeation chromatography followed by preparative normal-phase HPLC. Similarly, quantitative analysis of polymeric procyanidins were performed on grape seed extracts with a reverse-phase HPLC method (Peng et al. 2001). Sultana et al. (2008) looked at three different extraction processes on tea leaves, in which microwave-assisted extraction gave the highest yield, and further analysis was performed using reverse-phase HPLC. Proanthocyanidins from crude plant extracts were quantified with respect to procyanidins and prodelphinidins utilizing a UPLC-MS/MS method (Engstrom et al. 2014).
Although procyanidins levels within plants and foods remain unclear, the application of nuclear magnetic resonance (NMR) and mass spectrometry (MS) has enabled the structure elucidation in these phenolic compounds. To date, the structures of monomeric units catechin and epicatechin as well as some of their lower order oligomers have been established, but the identification of polymeric procyanidins and the extent of their formation in many plants and foods remains limited (Tarascou et al. 2006; Bittner et al. 2013).
Chemical Structures of Procyanidins
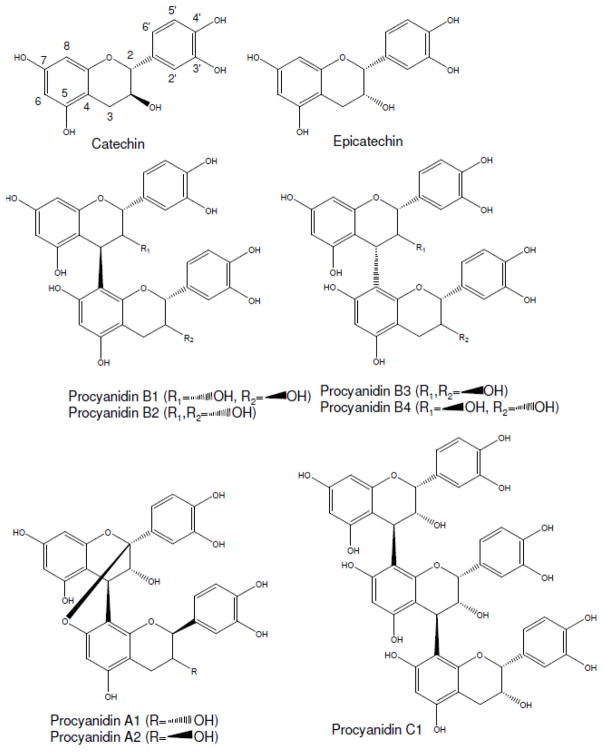
Procyanidins are proanthocyanidins built from flavan-3-ols (+)-catechin and (−)-epicatechin (Bittner et al. 2013). Proanthocyanidins are classified based on their monomeric unit linkages and are present in homo- and hetero-polymers. The most common proanthocyanidins are procyanidins (Figure 1). Procyanidins are homo-oligomeric (epi)catechin with two B-ring hydroxyl groups (Ge et al. 2016). This review concerns the structure determination of procyanidins and not their related proanthocyanidins.
Figure 1.
Chemical structures of monomeric and polymeric procyanidins (Xie and Dixon 2005; Tsao 2010)
Procyanidins can be categorized into A-type and B-type depending on the stereo configuration and linkage between monomers. B-type procyanidins are characterized by a single interflavan bond between carbon-4 of the B-ring and either carbon-8 or carbon-6 of the C-ring (Figure 1). B-type procyanidins are the most abundant, with procyanidins B1, B2, B3 and B4 occurring most frequently. A-type procyanidins have not only an interflavan bond but also a second ether linkage between the A-ring hydroxyl group and carbon-2 of the A-ring (Figure 1) (Bittner et al. 2013). The most common A-type compounds are A1 and A2.
Procyanidins can be categorized by their degree of polymerization (DP) (Gu et al. 2004); monomers form linkages leading to oligomers, further forming polymers. The most common monomeric unit is (−)-epicatechin, with B-type being the most prominent. Procyanidins containing 2–7 monomeric units are defined as oligoprocyanidins (Tsao and McCallum 2010).
Structure Elucidation
Nuclear Magnetic Resonance
NMR is a standard spectroscopic approach for the structural elucidation of a wide variety of natural products including procyanidins (Kind and Fiehn 2010). The structural elucidation of procyanidins by NMR has used a combination of homonuclear correlation (COSY) and heteronuclear one-bond (HSQC/HMQC) and multiple bond (HMBC) experiments (Morris 1986). Using long range correlation, the flavan junction carbon-4 and carbon-8 or carbon-4 and carbon-6 can be identified (Balas et al. 1995).
However, there has been considerable debate over the assignment of some protons and carbons in catechin and epicatechin (Balas et al. 1995). The position of these elements are solvent-dependent and are altered when derivatized (Balas and Vercauteren 1994). It has been suggested that rotation around the interfavan bond and ring interconversion is possible thereby confounding structure determination. To overcome this obstacle, the hydroxyl groups can be acetylated to impede the rotation, or alternatively, the spectra can be measured at varying temperatures with lower temperature slowing rotation and higher temperatures contributing to faster rotation (Khan et al. 1997).
Significant limitations of NMR analysis of procyanidins include sample isolation and large sample quantities. MS is generally carried out in the picogram range, while NMR is less sensitive requiring around 500 ng. Chromatographic separations of procyanidins are typically carried out prior to NMR analysis, but with the quantity requirements, purity problems often arise contributing to multiple interpretations of the data. Compared with mass spectrometry (MS), NMR is orders of magnitude less sensitive, orders of magnitude slower and to the best of our knowledge, unlike liquid chromatography-mass spectrometry (LC-MS), no LC-NMR analyses of procyanidins have yet been reported. Overcoming limitations of samples size, purity and speed, mass spectrometry and LC-MS have become effective tools for fast procyanidin structure elucidation (Silva Elipe 2003).
Liquid Chromatography and Mass Spectrometry (LC-MS)
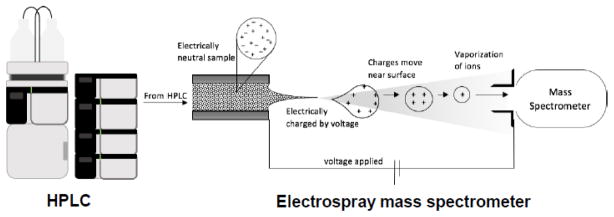
Introduced in the 1960s, high performance liquid chromatography (HPLC) has become a standard tool for the rapid analysis and purification of nonvolatile compounds including natural products (Miller 2005). The recent commercial introduction of ultra-high pressure liquid chromatography (UHPLC) enables even faster and higher resolution separations than HPLC. A variety of stationary phases are available for HPLC and UHPLC, however separations of polar procyanidins typically utilize reversed phase or normal phase columns (Churchwell et al. 2005). Mobile phases should have low ionic strength and contain only volatile additives when interfaced to mass spectrometry for on-line LC-MS analysis of procyanidins (Figure 2). Otherwise, ionization will be suppressed and the mass spectrometer inlet will become fouled by non-volatile deposits from the mobile phase (Hiraoka 2013).
Figure 2.
Electrospray serves as an atmospheric pressure interface between the HPLC and the mass spectrometer while simultaneously facilitating the formation of gas-phase ions of non-volatile and thermally labile solutes in the mobile phase such as procyanidins
As examples of reversed phase separations, Wollgast et al. (2001) studied procyanidins in crude chocolate extracts by reversed phase LC-MS, and Calderón et al. (2009) studied cocoa proanthocyanidins using C18 reversed phase LC-MS/MS and gradient elution from water to acetonitrile. More recently, Ortega et al. (2010) utilized reversed phase UHPLC-MS/MS to identify and quantify procyanidins up to nonamers in cocoa nib samples. UHPLC separations were carried out using gradient elution from water/acetic acid to acetonitrile.
As an example of normal phase LC-MS, Shoji et al. (2006) characterized procyanidins (dimers to octamers) in apple extracts according to the degree of polymerization using a combination of silica column fractionation followed by on-line normal phase LC-MS. The mobile phase consists of a hexane-methanol-ethyl acetate mixture. In another example, Karonen et al. (2004) utilized normal-phase and reversed phase LC-MS with negative ion electrospray ionization for the identification of procyanidins in pine bark. In general, proanthocyanidins from monomer to tetramers are optimally separated by reversed phase HPLC while polymers can be separated by their DP more efficiently using normal phase (Rigaud et al. 1993; Hammerstone et al. 1999; Gu et al. 2002).
Recently, several studies of procyanidins have utilized hydrophilic interaction chromatography (HILIC), a type of normal phase separation, in which the analyte is retained by partitioning between an aqueous layer on the hydrophilic stationary phase and the hydrophobic eluent (Hemström and Irgum 2006). Oligomeric and polymeric procyanidins from apples and cocoa eluted in order of increasing DP with individual peaks being obtained up to dodecamers for cocoa and apple extracts and up to tetradecamers for cacao seeds (Yanagida et al. 2007). Karonen et al. (2011) used LC-MS with HILIC and high resolution electrospray mass spectrometry to characterize oligomeric and polymeric procyanidins with degrees of polymerization up to 22 units that were obtained from silver birch bark.
Electrospray LC-MS (Figure 2) has become the most popular (Kind and Fiehn 2010) and is the only one to have been applied successfully to the analysis of procyanidins (Wollgast et al. 2001). Electrospray was first reported by Dole et al. (1968) as a technique to ionize high molecular weight synthetic polymers for mass spectrometric measurement. However, the application of electrospray mass spectrometry to the measurement of biopolymers such as proteins would not be realized for another 20 years (Fenn 2002), and its application to procyanidins would take even longer (Wollgast et al. 2001). Electrospray is one of the softest ionization techniques, which means that ions will form with the addition of little energy that might contribute to fragmentation in the ion source. Although the formation of molecular ions by the addition or loss of an electron can occur during electrospray, most analytes like procyanidins ionize by losing or gaining a proton to form [M-H]− or [M+H]+ ions, respectively (Hiraoka 2013).
During LC-MS, protonation/deprotonation of analytes containing heteroatoms can be facilitated by adjusting the pH of the mobile phase. As organic acids such as formic acid are often added to reversed phase mobile phases to facilitate HPLC separations (Miller 2005), positive ion electrospray mass spectrometry is used more often than negative ion mode for reversed phase LC-MS. However, electrospray LC-MS is not limited to reversed phase chromatography and may be used with normal phase columns as well (Nguyen and Schug 2008).
Once an intact procyanidin ion is formed during electrospray, it can be weighed in the mass spectrometer. The use of high-resolution accurate mass measurement analyzers such as time-of-flight (ToF), ion trap-ToF, quadrupole-ToF, as well as Fourier transform- ion cyclotron resonance and orbitrap mass spectrometers enable the elemental compositions of procyanidins to be determined. Additional structural information may be obtained by fragmenting the procyanidin ions using collision-induced dissociation and then weighing the product ions with high resolution tandem mass spectrometry (Kumar et al. 2016).
In studies of white birch bark procyanidins with DP up to 22 using negative ion electrospray LC-MS on a ToF analyzer, Karonen et al. (2011) found that high-resolution was essential to establish the charge state of each procyanidins based on their isotopic patterns. They also determined that only B-type procyanidins were present. As examples of ultrahigh resolution mass spectrometric analysis of procyanidins, Li et al. (2012) utilized FT-ion cyclotron resonance mass spectrometry with electrospray to identify oligomeric procyanidins in Litchi chinensis.
Unlike NMR, LC-MS/MS is so rapid that both accurate mass measurement of intact ions and their MS/MS product ions may be completed during single HPLC or UHPLC separations. The recent implementations of rapid polarity switching also enables on-line LC-MS/MS measurements of positive ions and negative ions during the sample chromatographic separation.
Two key components in the mass spectrometric analysis of complex mixtures such as procyanidins include resolution and mass accuracy. Mass accuracy is the degree of conformity of the measured value to the true value. Resolution is the ability to resolve two ions of similar mass-to-charge. Without high resolution accurate mass analysis, accurate charge state determination and accurate quantitation cannot be achieved (Mann and Kelleher 2008). The ability to perform structure elucidation of ions using high resolution accurate mass measurement and tandem mass spectrometry has been described by Kind and Fiehn (2010).
Another feature of electrospray that is less common with other ionization techniques is the ability to form not just singly charged ions, but also multiply charged species. Multiple charging is particularly valuable for large molecules, such as high order procyanidins polymers, that might be outside the mass range of a particular mass spectrometer (Hiraoka 2013). For example, mass spectrometers measure the mass-to-charge or m/z value of an ion, so that if z = 2, an ion of m/z 3000 will appear as m/z 1500. Therefore, multiple charging would enable a mass spectrometer with a mass range of just m/z 2000 to measure procyanidins with masses of 3000 or more.
As in peptide sequencing using tandem mass spectrometry (Wysocki et al. 2005; Wang et al. 2016), multiple charging can facilitate the fragmentation of procyanidins into more structurally significant product ions that can be obtained from single charged precursor ions (Gu et al. 2003; Karonen et al. 2004; Sarnoski et al. 2012; Patras et al. 2014; Ge et al. 2016). For example, Wollgast et al. (2001) identified procyanidins in cocoa using collision-induced dissociation and tandem mass spectrometry of their doubly-deprotonated, [M-2H]2−, pentamers, hexamers, and heptamers.
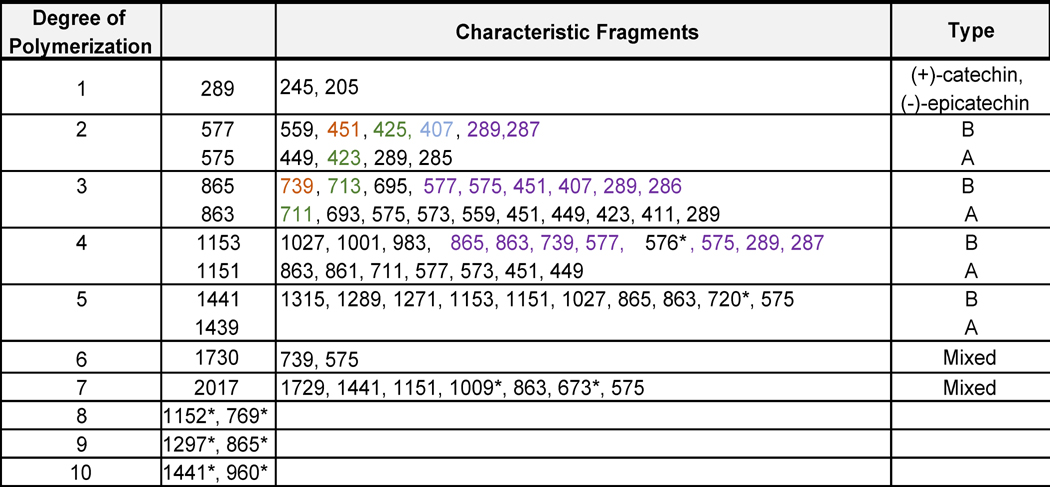
Positive electrospray mass spectrometry has been used successfully in measuring procyanidins up to pentamers in length, but larger procyanidins do not ionize efficiently in positive mode (Karonen et al. 2004). Due to the acidity of procyanidins, they are more readily measured as deprotonated molecules using negative ion electrospray mass spectrometry (Hellström et al. 2007). For example, oligomeric procyanidins have been detected using negative ion electrospray as singly charged deprotonated molecules of m/z 577, 865, 1153, 1441 and 1729 (Table 2) for dimeric, trimeric, tetrameric, pentameric, and hexameric procyanidins, respectively (Hammerstone et al. 2000; Ito et al. 2013). Multiply charged molecules formed using negative ion electrospray have been reported for higher order procyanidins such as doubly charged heptamers detected at m/z 1009 (Hellström et al. 2007).
Table 2. Molecular ions and Characteristic fragments in negative mode.
Deprotonated molecules and characteristic fragment ions reported for procyanidins using negative ion electrospray. (Hammerstone et al. 1999; Karonen et al. 2004; Hellström et al. 2007; Li et al. 2012; Sui et al. 2016)
multi charged species
 ,
,
 ,
,
 ,
,

As the DP increases, high mass procyanidins tend to form multiply charged species. However, as the DP increases, the ionization efficiency decreases. For example, Karonen et al. (2011) reported that singly-charged molecules and fragment ions are abundant for dimers and trimers, doubly-charged species [M-2H]2− are observed for octamers and nonamers, nonamers through octadecamers form triply charged species, [M-3H]3−, and only [M-4H]4− are observed for procyanidins with DP higher than hexadecamers. In studies of apple procyanidins ranging from dimers to octamers, Shoji et al. (2006) reported similar results; they observed singly charged species for the lowest mass compounds and doubly and triply charged signals for the higher order procyanidins.
Note that B-type procyanidin oligomers are composed of multiple monomer subunits with interflavanoid C-C linkages that differ by multiples of 288, which corresponds to the mass of the monomeric subunit (Karonen et al. 2004). As expected, B-type deprotonated procyanidins have been reported to fragment between monomeric subunits forming a series of product ions of [M-288n-1]−1 (Hellström et al. 2007). The m/z values of deprotonated procyanidin oligomers, their degrees of polymerization (DP), and the masses of their most abundant fragment ions are shown in Table 2.
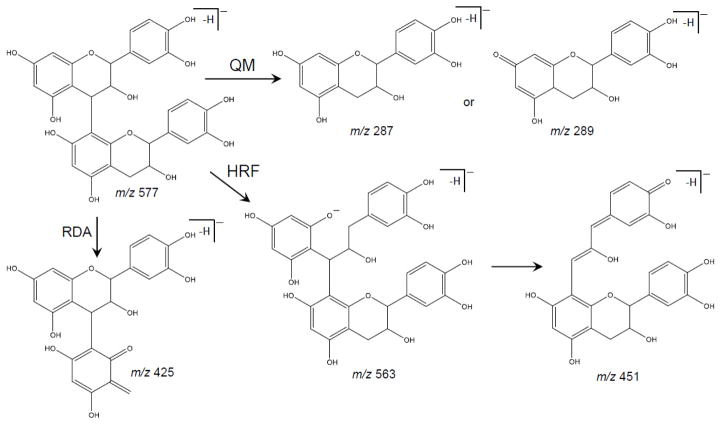
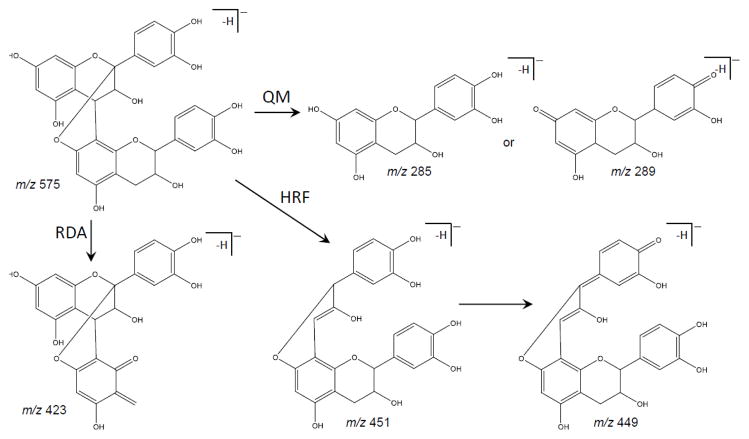
The main fragmentation pathways of procyanidins include quinone methide (QM) cleavage of the interflavanoid bond, as well as heterocyclic ring fission (HRF) and retro Diels-Alder (RDA) fission of the heterocyclic ring system subunits which are distinctive of proanthocyanidins (Hellström et al. 2007). These pathways can be seen in Figure 3 for B-type dimer procyanidins and in Figure 4 for an A-type dimer. The key component in understanding A- and B- type is recognizing that A-type dimers have been found to be 2 Da less than those of B-type, this difference accounts for the additional C-O-C linkage.
Figure 3.
Fragmentation pathway of B-type procyanidin dimer showing the products formed by quinone methide (QM), heterocyclic ring fussion (HRF), and retro-Diels Alder (RDA) reactions (Hellström et al. 2007)
Figure 4.
Fragmentation pathway of A-type procyanidin dimer showing the products formed by quinone methide (QM), heterocyclic ring fussion (HRF), and retro-Diels Alder (RDA) reactions (Sui et al. 2016)
QM formation will result in fragmentation between two catechin or epicatechin subunits in a procyanidin polymer. During this process, procyanidins will fragment to form one of two different QM ions. In the case of A-type dimers (Figure 4), fragmentation can form monomeric fragment ions of m/z 289 and m/z 285, and this difference of 4 Da is characteristic of A-type linkages. B-type procyanidin dimers (Figure 3), fragment to form monomeric ions of m/z 287 or m/z 289. Note that this 2 Da difference between fragment ions distinguishes B-type linkages from A-type. Therefore, QM fragmentation of dimers leads to pairs of product ions differing by 4 Da or 2 Da, which can be used to distinguish between types of procyanidins (Hellström et al. 2007; Sui et al. 2016). A-type trimers undergo the QM cleavage producing ions of m/z 575 and m/z 287. B-type trimers undergo QM cleavage of the upper interflavanoid bond producing ions of m/z 287 and 577, whereas cleavage of the lower interflavanoid bond forms ions of m/z 289 and 575. For B-type tetrameric and higher order procyanidins, fragment ions for QM cleavage were observed at m/z 287, 289, 575, 577 and 865 (Karonen et al. 2004). Chen et al. (2014) also described the conversion of B- to A-type trimers by quinone methide reaction mechanisms.
Karonen et al. (2004) reported that fragmentation of B-type procyanidin dimers via HRF can take place on either monomeric unit (Figure 3). The fragment ion of the dimer at m/z 451 indicates B-type (Figure 3) whereas a fragment ion at m/z 449 indicates an A-type dimer (Figure 4), loss of a phloroglucinol molecule. The B-type procyanidin trimer fragment similarly to that of the dimer, in which a fragment ion of m/z 739 is produced.
RDA fragmentation, which was the most common fragmentation pathway of the B-type procyanidin dimer (Friedrich et al. 2000), produces a fragment ion of m/z 425 with subsequent water elimination giving rise to an ion of m/z 407 (Figure 3). Fragmentation on the upper unit is considered to be energetically more favorable than the lower unit because it produces fragment ions with a larger Π – Π hyperconjugated system (Gu et al. 2003). A-type dimers produce fragment ions of m/z 423 (Figure 4), and A-type trimers produce fragment ions of m/z 711 (Sui et al. 2016). The ion at m/z 713 indicates RDA fragmentation of a B-type trimer (Karonen et al. 2004).
Matrix-Assisted Laser Desorption Ionization (MALDI)
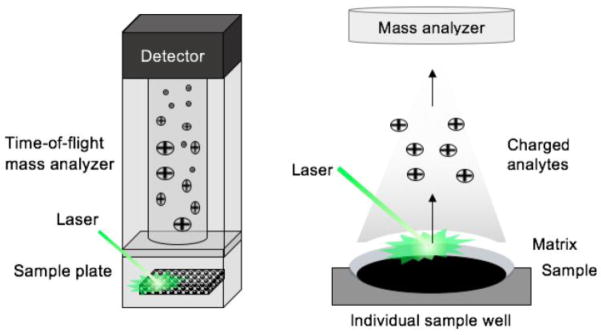
Invented in the 1980s, MALDI is an ionization technique for mass spectrometry that enables the simultaneous desorption and ionization of solid-phase biopolymers (Karas et al. 1987; Tanaka et al. 1988). Originally used for polymers, MALDI is also suitable for the ionization of procyanidins. As seen in Figure 5, the sample is dissolved in a solvent containing a matrix that will absorb the laser light, usually a UV or IR laser. The mixture is dried, loaded onto a MALDI target, and short laser pulses are used to evaporate the matrix which results in desorption and ionization of the associated procyanidin. If using a non-scanning mass spectrometer such as a ToF analyzer, complete mass spectra may be obtained with each pulse of the laser, thereby making MALDI mass spectrometry highly efficient and suitable for small procyanidin samples. Some ToF analyzers are also capable of high resolution and tandem mass spectrometry.
Figure 5.
Matrix-assisted laser desorption ionization utilizing a laser for desorption of a sample in a matrix material facilitating the protonation/deprotonation of samples such as procyanidins
During MALDI, analytes typically form abundant singly-protonated or deprotonated molecules, although molecular ion radicals and multiply charged species are possible. Analyte ionization during MALDI has been described as a photo-ionization process during which analytes become charged by proton transfer during collisions with matrix ions (Ehring et al. 1992). Alternatively, a cluster ionization mechanism has been proposed for MALDI in which preformed analyte ions are released from clusters during evaporation of matrix ions (Karas 1996).
The first MALDI MS measurements of procyanidins were reported by Ohnishi-Kameyama et al. (1997) using a ToF analyzer. Looking only at monomeric and dimeric procyanidins, DHB, α-cyano-4-hydroxycinnamic acid, sinnapinic acid, and 9-nitroanthracene were effective matrices. DHB is an optimum UV matrix for procyanidin MALDI mass spectrometry (Hurst et al. 2009). While there might be advantages of using IR lasers for procyanidin analysis, most MALDI MS studies of procyanidins have utilized UV lasers (Niu et al. 1998).
Unlike electrospray mass spectrometric studies of procyanidins, which usually utilize negative ion mode, the majority of MALDI MS studies of procyanidins have been carried out using positive ion mode. In positive ion MALDI mass spectra, the ion current is divided among several cationized species including [M+H]+, [M+Na]+, [M+K]+, and sometimes others. Dividing the procyanidin signals in this manner lowers the sensitivity of the analysis and complicates interpretation of the data, especially when measuring mixtures of compounds. To enhance the abundance of particular cationized procyanidins, cationization agents have been added to the MALDI matrix (Monagas et al. 2010). Addition of sodium chloride, sodium iodide, silver trifluoroacetate, and cesium trifluoroacete have all been used with varying degrees of success to detect procyanidins as [M+Na]+, [M+Ag]+ or [M+Cs]+ ions (Ohnishi-Kameyama et al. 1997; Krueger et al. 2003; Vivas et al. 2004; Sivakumaran et al. 2006; Spencer et al. 2007). Unless there is a compelling reason to use positive ion MALDI, the detection of procyanidins can be improved significantly by utilizing negative mode. This is consistent with the electrospray studies discussed above as well as with related desorption ionization studies of procyanins using fast atom bombardment (Self et al. 1986).
MALDI MS/MS of Procyanidins
Although MALDI-ToF/ToF is frequently used for peptide sequencing, few applications have been reported for procyanidin analysis. The published MALDI MS/MS spectra of procyanidins to date have reported relatively few product ions and have high background noise levels (Mateos-Martín et al. 2012; Pérez-Jiménez and Torres 2012). Because MALDI MS is not compatible with on-line HPLC or UHPLC, samples must be prepared in advance and might degrade before analysis or contain impurities that can suppress ionization. In this respect, MALDI mass spectrometry shares this limitation with NMR analysis of procyanidins. However, an advantage of MALDI analysis is easy interpretation of data including complex mixtures of procyanidins. While it is difficult to interpret DP with NMR, it is easily obtained using MALDI mass spectrometry.
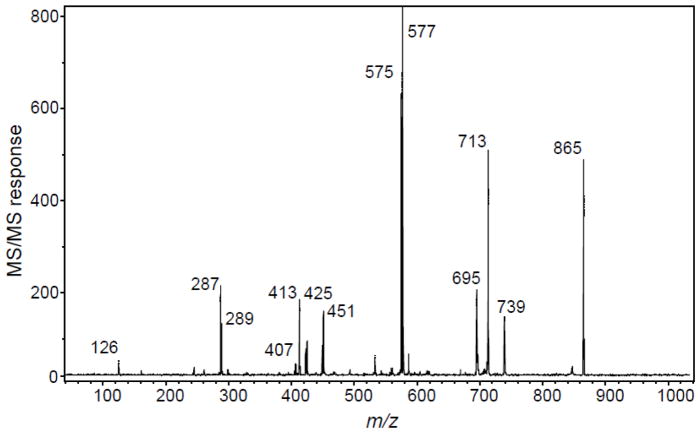
While it is possible to determine the type of procyanidin using MALDI-ToF mass spectrometry (MS1) (Stringano et al. 2011; Feliciano et al. 2012), definitive typing can also be obtained based on fragmentation patterns during product ion tandem mass spectrometry. A-type procyanidins have different fragmentation patterns than B-type procyanidins that can be used to differentiate unknown procyanidins by the type of linkages between monomeric units. For example, in the tandem mass spectrum of a B-type procyandin trimer (Figure 6), 13 fragment ions are recognizable corresponding to the expected fragmentation pathways of procyanidins – quinone methide formation, HRF, and RDA fragmentation.
Figure 6.
MALDI-ToF/ToF product ion mass spectrum of deprotonated procyanidin C1. This procyanidin B-type trimer was provided by Jan Glinski of Planta Analytica (New Milford, CT), and the tandem mass spectrum was obtained by Paul Kowalski using a Bruker Daltonics UltrafleXtreme (Billerica, MA) MALDI-ToF/ToF mass spectrometer.
Fragmentation observed for MALDI is similar to that for electrospray. The advantages of MALDI over electrospray include speed, sensitivity, and the ability to obtain singly charged procyanidin ions for tandem mass spectrometric analysis, especially for the higher DP compounds. With the benefit of multiple charging, procyanidins of higher DP have been reported using electrospray, although product ion tandem mass spectrometric analysis of larger procyanidins have been reported using MALDI ToF/ToF mass spectrometry (Wang et al. 2000; Karonen et al. 2004; Shoji et al. 2006; Oliveira et al. 2015)
Using MALDI ToF/ToF mass spectrometry for product ion analysis of higher order procyanidins, Mateos-Martín et al. (2012) described the fragmentation pathway of a tetrameric proanthocyanidin. In tetrameric form, the proanthocyanidin ion follows the general fragmentation pathway of QM, RDA, and HRF. The tetrameric ion showed a loss of 126 Da during HRF, loss of 152 Da via RDA reaction followed by subsequent loss of water and a loss of 288 Da to form the trimeric form. The trimeric ion showed the same fragmentation pathways including HRF, RDA reaction and subsequent water elimination as well as QM fragmentation forming the dimeric form. The dimeric ion showed similar fragmentation and to produce two monomeric units. In Figure 7, a tetrameric proanthocyanidin, the fragmentation pathways facilitated identification of the mixed type containing two B-type linkages with a lower A-type linkage (Mateos-Martín et al. 2012).
Figure 7.
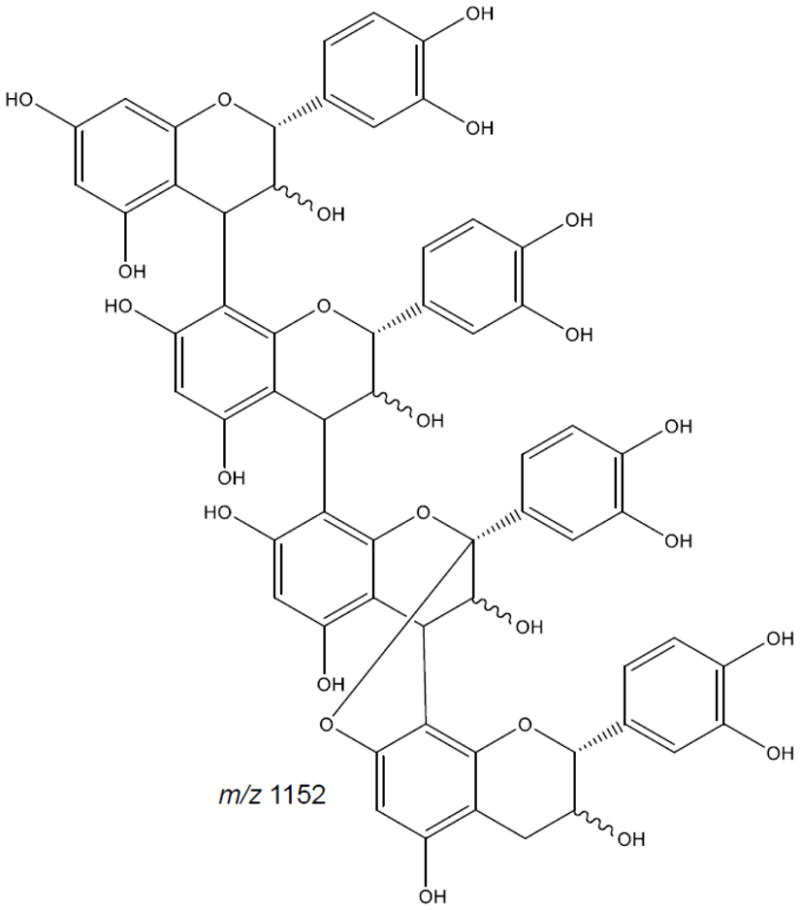
Tetramer proanthocyanidin displaying mixed type configuration (based on Mateos-Martín et al. 2012)
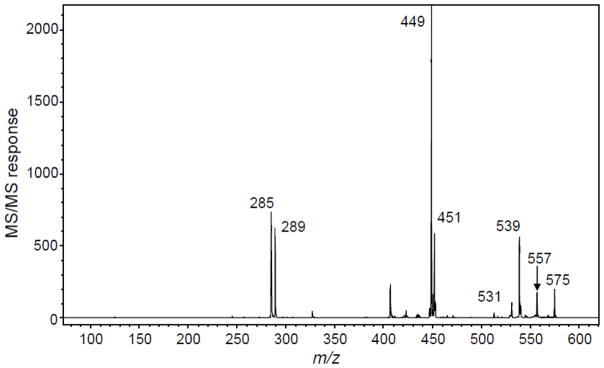
In the negative ion MALDI product ion tandem mass spectrum of Procyanidin C1 in Figure 6, the dimer doublet ions of m/z 575 and 577 and monomer doublet ions of m/z 287 and 289 show the 2 u mass difference that is characteristic of quinone methide formation by B-type procyanidins. In the case of the tandem mass spectrum of Procyandin A1 in Figure 8, the pair of ions of m/z 285 and 289 shows a 4 u mass difference indicating the formation of quinone methides by an A-type procyanidin. Figure 6 shows a fragment ion at m/z 739 corresponding to HRF of the trimeric unit whereas the fragment ion of m/z 451 corresponds to HRF of the dimeric form. In Figure 8, the fragment ion of m/z 449 corresponds to HRF from procyanidin A1 which is a dimer. Figure 6 shows fragment ions at m/z 713 which corresponds to RDA and a subsequent loss of water at m/z 695. Fragment ions of m/z 425 and m/z 407 correspond to RDA and water loss of the dimeric form.
Figure 8.
MALDI-ToF/ToF product ion mass spectrum of deprotonated procyanidin A1. This A-type procyanidin dimer was provided by Jan Glinski (Planta Analytica), and the tandem mass spectrum was obtained by Paul Kowalski (Bruker Daltonics).
All of these patterns of fragmentation – QM, HRF and RDA – are useful in quickly identifying the type of procyanidin. While MALDI-ToF MS analyses of procyanidins has been reported frequently, more attention should be given to the abundant structural information that may be obtained when using negative ion MALDI-ToF/ToF mass spectrometry.
Conclusion
Procyanidins, oligomeric compounds composed of catechin and epicatechin monomers, are widespread in foods and can have significant medicinal properties. Although much is already known about their biological activities, research concerning their medicinal benefits is continuing. Essential to this effort is a more thorough understanding of the procyanidin structures (polymer chain length and composition of A-type versus B-type linkages) and content in plants, foods and research materials. The high molecular weight of the longer chain procyanidins has hindered their analysis, but advances in MALDI ToF/ToF mass spectrometry mass range and the ability to form multiply charged ions using electrospray are helping to overcome this limitation. To date, the highest DP for procyanidins yet reported has been 28 (Hayasaka et al. 2003), but this value is expected to increase.
As the capabilities of mass spectrometers improve, not only with respect to mass range but also improved sensitivity, resolving power, accuracy, and new functionalities, the identification of higher order procyanidins will become routine. An example of an emerging new functionality in the field of biomedical mass spectrometry that might be useful for procyanidin analysis is ion mobility. A fast gas-phase separation technique based on ion size and shape, ion mobility mass spectrometry is orders of magnitudie faster than HPLC and should be useful for procyanidin analysis. Another area that requires additional development is the quantitative analysis of higher order DP procyanidins using mass spectrometry. Altogether, the application of state-of-the-art biomedical mass spectrometry is facilitating the structural analysis of procyandins, and the quantitative analysis of these important botanical natural products will follow.
Acknowledgments
The work was supported by the P50 AT000155 from the Office of Dietary Supplements and the National Center for Complementary and Integrative Health and F31AT009039 from the National Center for Complementary and Integrative Health.
Abbreviations
- PC
procyanidins
- DP
degree of polymerization
- MS
mass spectrometry
- MALDI
matrix-assisted laser desorption ionization
- QM
quinone methide
- RDA
retro Diels-Alder
References
- Adamson GE, Lazarus SA, Mitchell AE, et al. HPLC mehod for the quantification of procyanidins in cocoa and chocolate samples and correlation to total antioxidant capacity. J Agric Food Chem. 1999;47:4184–4188. doi: 10.1021/jf990317m. [DOI] [PubMed] [Google Scholar]
- Akiyama H, Sakushima J, Taniuchi S, et al. Antiallergic effect of apple polyphenols on the mouse model. Biol Pharm Bull. 2000;23:1370–1373. doi: 10.1248/bpb.23.1370. [DOI] [PubMed] [Google Scholar]
- Arranz S, Valderas-Martinez P, Chiva-Blanch G, et al. Cardioprotective effects of cocoa: clinical evidence from randomized clinical intervention trials in humans. Mol Nutr Food Res. 2013;57:936–947. doi: 10.1002/mnfr.201200595. [DOI] [PubMed] [Google Scholar]
- Balas L, Vercauteren J. Extensive high-resolution reverse 2D NMR analysis for the structural elucidation of procyanidin oligomers. Magn Reson Chem. 1994;32:386–393. [Google Scholar]
- Balas L, Vercauteren J, Laguerre M. 2D NMR structure elucidation of proanthocyanidins: the special case of the catechin-(4α-8)-catechin-(4α-8)-catechin trimer. Magn Reson Chem. 1995;33:85–94. [Google Scholar]
- Benavente-García O, Castillo J, Marin FR, et al. Uses and properties of citrus flavonoids. J Agric Food Chem. 1997;45:4505–4515. doi: 10.1021/jf8006568. [DOI] [PubMed] [Google Scholar]
- Bittner K, Rzeppa S, Humpf H-U. Distribution and quantification of flavan-3-ols and procyanidins with low degree of polymerization in nuts, cereals, and legumes. J Agric Food Chem. 2013;61:9148–9154. doi: 10.1021/jf4024728. [DOI] [PubMed] [Google Scholar]
- Calderón AI, Wright BJ, Hurst WJ, van Breemen RB. Screening antioxidants using LC-MS: case study with cocoa. J Agric Food Chem. 2009;57:5693–5699. doi: 10.1021/jf9014203. [DOI] [PMC free article] [PubMed] [Google Scholar]
- Chaves FC, Gianfagna TJ. Cacao leaf procyanidins increase locally and systemically in response to infection by Moniliophthora perniciosa basidiospores. Physiol Mol Plant Pathol. 2007;70:174–179. [Google Scholar]
- Chen L, Yuan P, Chen K, et al. Oxidative conversion of B- to A-type procyanidin trimer: evidence for quinone methide mechanism. Food Chem. 2014;154:315–322. doi: 10.1016/j.foodchem.2014.01.018. [DOI] [PubMed] [Google Scholar]
- Churchwell MI, Twaddle NC, Meeker LR, Doerge DR. Improving LC-MS sensitivity through increases in chromatographic performance: Comparisons of UPLC-ES/MS/MS to HPLC-ES/MS/MS. J Chromatogr B Anal Technol Biomed Life Sci. 2005;825:134–143. doi: 10.1016/j.jchromb.2005.05.037. [DOI] [PubMed] [Google Scholar]
- de Pascual-Teresa S, Moreno DA, García-Viguera C. Flavanols and anthocyanins in cardiovascular health: a review of current evidence. Int J Mol Sci. 2010;11:1679–1703. doi: 10.3390/ijms11041679. [DOI] [PMC free article] [PubMed] [Google Scholar]
- Dole M, Mack LL, Hines RL, et al. Molecular beams of macroions. J ChemPhys. 1968;49:2240–2249. [Google Scholar]
- Duan Y, Zhang H, Xu F, et al. Inhibition effect of procyanidins from lotus seedpod on mouse B16 melanoma in vivo and in vitro. Food Chem. 2010;122:84–91. [Google Scholar]
- Ehring H, Karas M, Hillenkamp F. Role of photoionization and photochemistry in ionization processes of organic molecules and relevance for matrix-assisted laser desorption lonization mass spectrometry. Org Mass Spectrom. 1992;27:472–480. [Google Scholar]
- Engstrom MT, Palijarvi M, Fryganas C, et al. Rapid Qualitative and Quantitative Analyses of Proanthocyanidin Oligomers and Polymers by UPLC-MS/MS. J Agric Food Chem. 2014;62:3390–3399. doi: 10.1021/jf500745y. [DOI] [PubMed] [Google Scholar]
- Faria A, Calhau C, DE Freitas V, Mateus N. Procyanidins as antioxidants and tumor cell growth modulators. J Agric Food Chem. 2006;54:2392–2397. doi: 10.1021/jf0526487. [DOI] [PubMed] [Google Scholar]
- Feliciano RP, Krueger CG, Shanmuganayagam D, et al. Deconvolution of matrix-assisted laser desorption/ionization time-of-flight mass spectrometry isotope patterns to determine ratios of A-type to B-type interflavan bonds in cranberry proanthocyanidins. Food Chem. 2012;135:1485–1493. doi: 10.1016/j.foodchem.2012.05.102. [DOI] [PubMed] [Google Scholar]
- Fenn JB. Electrospray ionization mass spectrometry: how it all began. J Biomol Tech. 2002;13:101–118. [PMC free article] [PubMed] [Google Scholar]
- Fine AM. Oligomeric proanthocyanidin (OPCs) Altern Med Rev. 2003;8:442–450. [PubMed] [Google Scholar]
- Friedrich W, Eberhardt A, Galensa R. Investigation of proanthocyanidins by HPLC with electrospray ionization mass spectrometry. Eur Food Res Technol. 2000;211:56–64. [Google Scholar]
- Ge Y-W, Zhu S, Kazuma K, et al. Molecular ion index assisted comprehensive profiling of B-type oligomeric proanthocyanidins in rhubarb by high performance liquid chromatography-tandem mass spectrometry. Anal Bioanal Chem. 2016;408:3555–3570. doi: 10.1007/s00216-016-9433-z. [DOI] [PubMed] [Google Scholar]
- Gentile C, Allegra M, Angileri F, et al. Polymeric proanthocyanidins from sicilian pistachio (Pistacia vera L.) nut extract inhibit lipopolysaccharide-induced inflammatory response in RAW 264.7 cells. Eur J Nutr. 2012;51:353–363. doi: 10.1007/s00394-011-0220-5. [DOI] [PubMed] [Google Scholar]
- Gossé F, Guyot S, Roussi S, et al. Chemopreventive properties of apple procyanidins on human colon cancer-derived metastatic SW620 cells and in a rat model of colon carcinogenesis. Carcinogenesis. 2005;26:1291–1295. doi: 10.1093/carcin/bgi074. [DOI] [PubMed] [Google Scholar]
- Gu L, Kelm MA, Hammerstone JF, et al. Concentrations of proanthocyanidins in common foods and estimations of normal consumption. J Nutr. 2004;134:613–617. doi: 10.1093/jn/134.3.613. [DOI] [PubMed] [Google Scholar]
- Gu L, Kelm MA, Hammerstone JF, et al. Liquid chromatographic/electrospray ionization mass spectrometric studies of proanthocyanidins in foods. J Mass Spectrom. 2003;38:1272–1280. doi: 10.1002/jms.541. [DOI] [PubMed] [Google Scholar]
- Gu L, Kelm M, Hammerstone JF, et al. Fractionation of polymeric procyanidins from lowbush blueberry and quantification of procyanidins in selected foods with an optimized normal-phase HPLC-MS fluorescent detection method. J Agric Food Chem. 2002;50:4852–4860. doi: 10.1021/jf020214v. [DOI] [PubMed] [Google Scholar]
- Hammerstone JF, Lazarus SA, Mitchell AE, et al. Identification of procyanidins in cocoa (Theobroma cacao) and chocolate using high-performance liquid chromatography/mass spectrometry. J Agric Food Chem. 1999;47:490–496. doi: 10.1021/jf980760h. [DOI] [PubMed] [Google Scholar]
- Hammerstone JF, Lazarus SA, Schmitz HH. Procyanidin content and variation in some commonly consumed foods. J Nutr. 2000;130:2086S–2092S. doi: 10.1093/jn/130.8.2086S. [DOI] [PubMed] [Google Scholar]
- Han X, Shen T, Lou H. Dietary polyphenols and their biological significance. Int J Mol Sci. 2007;8:950–988. [Google Scholar]
- Hayasaka Y, Waters EJ, Cheynier V, et al. Characterization of proanthocyanidins in grape seeds using electrospray mass spectrometry. Rapid Commun Mass Spectrom. 2003;17:9–16. doi: 10.1002/rcm.869. [DOI] [PubMed] [Google Scholar]
- Hellenbrand N, Sendker J, Lechtenberg M, et al. Isolation and quantification of oligomeric and polymeric procyanidins in leaves and flowers of hawthorn (Crataegus spp.) Fitoterapia. 2015;104:14–22. doi: 10.1016/j.fitote.2015.04.010. [DOI] [PubMed] [Google Scholar]
- Hellström J, Sinkkonen J, Karonen M, Mattila P. Isolation and structure elucidation of procyanidin oligomers from saskatoon berries (Amelanchier alnifolia) J Agric Food Chem. 2007;55:157–164. doi: 10.1021/jf062441t. [DOI] [PubMed] [Google Scholar]
- Hellström JK, Törrönen AR, Mattila PH. Proanthocyanidins in common food products of plant origin. J Agric Food Chem. 2009;57:7899–7906. doi: 10.1021/jf901434d. [DOI] [PubMed] [Google Scholar]
- Hemström P, Irgum K. Hydrophilic interaction chromatography. J Sep Sci. 2006;29:1784–1821. doi: 10.1002/jssc.200600199. [DOI] [PubMed] [Google Scholar]
- Hiraoka K. Fundamentals of mass spectrometry. Springer; New York Heidelberg Dordrecht London, New York, NY: 2013. [Google Scholar]
- Hurst WJ, Stanley B, Glinski JA, et al. Characterization of primary standards for use in the HPLC analysis of the procyanidin content of cocoa and chocolate containing products. Molecules. 2009;14:4136–4146. doi: 10.3390/molecules14104136. [DOI] [PMC free article] [PubMed] [Google Scholar]
- Ito C, Oki T, Yoshida T, et al. Characterisation of proanthocyanidins from black soybeans: isolation and characterisation of proanthocyanidin oligomers from black soybean seed coats. Food Chem. 2013;141:2507–2512. doi: 10.1016/j.foodchem.2013.05.039. [DOI] [PubMed] [Google Scholar]
- Jakobek L. Interactions of polyphenols with carbohydrates, lipids and proteins. Food Chem. 2015;175:556–567. doi: 10.1016/j.foodchem.2014.12.013. [DOI] [PubMed] [Google Scholar]
- Kamimural A, Takahashi T, Waranabe Y. Investigation of topical application of procyanidin B-2 from apple to identify its potential use as a hair growing agent. Phytomedicine. 2000;7:529–536. doi: 10.1016/S0944-7113(00)80040-9. [DOI] [PubMed] [Google Scholar]
- Karas M. Matrix-assisted laser desorption ionization MS: a progress report. Biochem Soc Trans. 1996;24:897–900. doi: 10.1042/bst0240897. [DOI] [PubMed] [Google Scholar]
- Karas M, Bachmann D, Bahr U, Hillenkamp F. Matrix- assisted ultraviolet laser desorption of non-volatile compounds. Int J mass Spectrom ion Process. 1987;78:53–68. [Google Scholar]
- Karonen M, Liimatainen J, Sinkkonen J. Birch inner bark procyanidins can be resolved with enhanced sensitivity by hydrophilic interaction HPLC-MS. J Sep Sci. 2011;34:3158–3165. doi: 10.1002/jssc.201100569. [DOI] [PubMed] [Google Scholar]
- Karonen M, Loponen J, Ossipov V, Pihlaja K. Analysis of procyanidins in pine bark with reversed-phase and normal-phase high-performance liquid chromatography-electrospray ionization mass spectrometry. Anal Chim Acta. 2004;522:105–112. [Google Scholar]
- Khan ML, Haslam E, Williamson MP. Structure and conformation of the procyanidin B-2 dimer. Mag Res Chem. 1997;35:854–858. [Google Scholar]
- Kimmel EM, Jerome M, Holderness J, et al. Oligomeric procyanidins stimulate innate antiviral immunity in dengue virus infected human PBMCs. Antiviral Res. 2011;90:80–86. doi: 10.1016/j.antiviral.2011.02.011. [DOI] [PMC free article] [PubMed] [Google Scholar]
- Kind T, Fiehn O. Advances in structure elucidation of small molecules using mass spectrometry. Bioanal Rev. 2010;2:23–60. doi: 10.1007/s12566-010-0015-9. [DOI] [PMC free article] [PubMed] [Google Scholar]
- Krueger CG, Vestling MM, Reed JD. Matrix-assisted laser desorption/ionization time-of-flight mass spectrometry of heteropolyflavan-3-ols and glucosylated heteropoly flavans in Sorghum [Sorghum bicolor (L.) Moench] J Agric Food Chem. 2003;51:538–543. doi: 10.1021/jf020746b. [DOI] [PubMed] [Google Scholar]
- Kumar PR, Dinesh SR, Rini R. LCMS- a review and a recent update. J Pharm Pharm Sci. 2016;5:377–391. [Google Scholar]
- Li H-J, Deinzer ML. Beer in Health and Disease Prevention. Elsevier Inc; 2009. Proanthocyanidins in hops; pp. 333–348. [Google Scholar]
- Li S, Xiao J, Chen L, et al. Identification of A-series oligomeric procyanidins from pericarp of Litchi chinensis by FT-ICR-MS and LC-MS. Food Chem. 2012;135:31–38. [Google Scholar]
- Li W, Liu J, Guan R, et al. Chemical characterization of procyanidins from Spatholobus suberectus and their antioxidative and anticancer activities. J Funct Foods. 2015;12:468–477. [Google Scholar]
- Malien-Aubert C, Dangles O, Amiot MJ. Influence of procyanidins on the color stability of oenin solutions. J Agric Food Chem. 2002;50:3299–3305. doi: 10.1021/jf011392b. [DOI] [PubMed] [Google Scholar]
- Mann M, Kelleher NL. Precision proteomics: the case for high resolution and high mass accuracy. PNAS. 2008;105:18132–18138. doi: 10.1073/pnas.0800788105. [DOI] [PMC free article] [PubMed] [Google Scholar]
- Martin MA, Goya L, Ramos S. Potential for preventive effects of cocoa and cocoa polyphenols in cancer. Food Chem Toxicol. 2013;56:336–351. doi: 10.1016/j.fct.2013.02.020. [DOI] [PubMed] [Google Scholar]
- Mateos-Martín ML, Fuguet E, Quero C, et al. New identification of proanthocyanidins in cinnamon (Cinnamomum zeylanicum L.) using MALDI-TOF/TOF mass spectrometry. Anal Bioanal Chem. 2012;402:1327–1336. doi: 10.1007/s00216-011-5557-3. [DOI] [PubMed] [Google Scholar]
- Miller JM. Chromatogarphy: concepts and contrasts. 2. John Wiley & Sons, Inc; Hoboken, New Jersey: 2005. [Google Scholar]
- Monagas M, Quintanilla-López JE, Gómez-Cordovés C, et al. MALDI-TOF MS analysis of plant proanthocyanidins. J Pharm Biomed Anal. 2010;51:358–372. doi: 10.1016/j.jpba.2009.03.035. [DOI] [PubMed] [Google Scholar]
- Montagut G, Bladé C, Blay M, et al. Effects of a grapeseed procyanidin extract (GSPE) on insulin resistance. J Nutr Biochem. 2010;21:961–967. doi: 10.1016/j.jnutbio.2009.08.001. [DOI] [PubMed] [Google Scholar]
- Morris GA. Modern NMR techniques for structure elucidation. Magn Reson Chem. 1986;24:371–403. [Google Scholar]
- Nguyen HP, Schug KA. The advantages of ESI-MS detection in conjunction with HILIC mode separations: fundamentals and applications. J Sep Sci. 2008;31:1465–1480. doi: 10.1002/jssc.200700630. [DOI] [PubMed] [Google Scholar]
- Niu S, Zhang W, Chait BT. Direct comparison of infrared and ultraviolet wavelength matrix-assisted laser desorption/ionization mass spectrometry of proteins. J Am Soc Mass Spectrom. 1998;9:1–7. doi: 10.1016/S1044-0305(97)00236-5. [DOI] [PubMed] [Google Scholar]
- Ohnishi-Kameyama M, Yanagida A, Kanda T, Nagata T. Identification of catechin oligomers from apple (Malus pumila cv. Fuji) in matrix-assisted laser desorption/ionization time-of-flight mass spectrometry and fast-atom bombardment mass spectrometry. Rapid Commun Mass Spectrom. 1997;11:31–36. doi: 10.1002/(SICI)1097-0231(19970115)11:1<31::AID-RCM784>3.0.CO;2-T. [DOI] [PubMed] [Google Scholar]
- Oliveira J, Alhinho Da Silva M, Teixeira N, et al. Screening of anthocyanins and anthocyanin-derived pigments in red wine grape pomace using LC-DAD/MS and MALDI-TOF techniques. J Agric Food Chem. 2015;63:7636–7644. doi: 10.1021/acs.jafc.5b00256. [DOI] [PubMed] [Google Scholar]
- Ortega N, Romero MP, Macià A, et al. Comparative study of UPLC-MS/MS and HPLC-MS/MS to determine procyanidins and alkaloids in cocoa samples. J Food Compos Anal. 2010;23:298–305. [Google Scholar]
- Patras MA, Milev BP, Vrancken G, Kuhnert N. Identification of novel cocoa flavonoids from raw fermented cocoa beans by HPLC-MSn. Food Res Int. 2014;63:353–359. doi: 10.1016/j.foodres.2014.07.012. [DOI] [PubMed] [Google Scholar]
- Peng Z, Hayasaka Y, Iland PG, et al. Quantitative analysis of polymeric procyanidins (tannins) from grape (vitis vinifera) seeds by reverse phase high- performance liquid chromatography. J Agric Food Chem. 2001;49:26–31. doi: 10.1021/jf000670o. [DOI] [PubMed] [Google Scholar]
- Pérez-Jiménez J, Torres JL. Analysis of proanthocyanidins in almond blanch water by HPLC–ESI–QqQ–MS/MS and MALDI–TOF/TOF MS. Food Res Int. 2012;49:798–806. [Google Scholar]
- Rastogi S, Arora V, Bhalla V. Pycnogenol: the hercules of antioxidants. Indian J Drugs. 2015;3:5–10. [Google Scholar]
- Rigaud J, Escribano-Bailon MT, Prieur C, et al. Normal-phase high-performance liquid chromatographic separation of procyanidins from cacao beans and grape seeds. J Chromatogr A. 1993;654:255–260. [Google Scholar]
- Sarnoski PJ, Johnson JV, Reed KA, et al. Separation and characterisation of proanthocyanidins in virginia type peanut skins by LC-MSn. Food Chem. 2012;131:927–939. [Google Scholar]
- Self R, Eagles J, Galletti GC, et al. Fast atom bombardment mass spectrometry of polyphenols (syn. vegetable tannins) Biol Mass Spectrom. 1986;13:449–468. [Google Scholar]
- Shi J, Yu J, Pohorly JE, Kakuda Y. Polyphenolics in grape seeds—biochemistry and functionality. J Med Food. 2003;6:291–299. doi: 10.1089/109662003772519831. [DOI] [PubMed] [Google Scholar]
- Shoji T, Masumoto S, Moriichi N, et al. Apple (Malus pumila) procyanidins fractionated according to the degree of polymerization using normal-phase chromatography and characterized by HPLC-ESI/MS and MALDI-TOF/MS. J Chromatogr A. 2006;1102:206–213. doi: 10.1016/j.chroma.2005.10.065. [DOI] [PubMed] [Google Scholar]
- Silva Elipe MV. Advantages and disadvantages of nuclear magnetic resonance spectroscopy as a hyphenated technique. Anal Chim Acta. 2003;497:1–25. [Google Scholar]
- Sivakumaran S, Rumball W, Lane GA, et al. Variation of proanthocyanidins in lotus species. J Chem Ecol. 2006;32:1797–1816. doi: 10.1007/s10886-006-9110-3. [DOI] [PubMed] [Google Scholar]
- Spencer P, Sivakumaran S, Fraser K, et al. Isolation and characterisation of procyanidins from Rumex obtusifolius. Phytochem Anal. 2007;18:193–203. doi: 10.1002/pca.967. [DOI] [PubMed] [Google Scholar]
- Stringano E, Cramer R, Hayes W, et al. Deciphering the complexity of sainfoin (Onobrychis viciifolia) proanthocyanidins by MALDI-TOF mass spectrometry with a judicious choice of isotope patterns and matrixes. Anal Chem. 2011;83:4147–4153. doi: 10.1021/ac2003856. [DOI] [PubMed] [Google Scholar]
- Sui Y, Zheng Y, Li X, et al. Characterization and preparation of oligomeric procyanidins from Litchi chinensis pericarp. Fitoterapia. 2016;112:168–174. doi: 10.1016/j.fitote.2016.06.001. [DOI] [PubMed] [Google Scholar]
- Sultana T, Stecher G, Mayer R, et al. Quality Assessment and Quantitative Analysis of Flavonoids from Tea Samples of Different Origins by HPLC-DAD-ESI-MS. J Agric Food Chem. 2008;56:3444–3453. doi: 10.1021/jf703625r. [DOI] [PubMed] [Google Scholar]
- Tanaka K, Waki H, Ido Y, et al. Protein and polymer analyses up to m/z 100 000 by laser ionization time-of-flight mass spectrometry. Rapid Commun Mass Spectrom. 1988;2:151–153. [Google Scholar]
- Tarascou I, Barathieu K, André Y, et al. An improved synthesis of procyanidin dimers: regio- and stereocontrol of the interflavan bond. European J Org Chem. 2006;23:5367–5377. [Google Scholar]
- Tatsuno T, Jinno M, Arima Y, et al. Anti-inflammatory and anti-melanogenic proanthocyanidin oligomers from peanut skin. Biol Pharm Bull. 2012;35:909–916. doi: 10.1248/bpb.35.909. [DOI] [PubMed] [Google Scholar]
- Tsao R. Chemistry and biochemistry of dietary polyphenols. Nutrients. 2010;2:1231–1246. doi: 10.3390/nu2121231. [DOI] [PMC free article] [PubMed] [Google Scholar]
- Tsao R, McCallum J. Fruit and vegetable phytochemicals. Wiley-Blackwell; Ames, Iowa: 2010. [Google Scholar]
- U.S. Department of Agriculture. USDA database for the proanthocyanidin content of selected foods. 2004:1–33. [Google Scholar]
- Vázquez-Agell M, Urpi-Sarda M, Sacanella E, et al. Cocoa consumption reduces NF-kB activation in peripheral blood mononuclear cells in humans. Nutr Metab Cardiovasc Dis. 2013;23:257–263. doi: 10.1016/j.numecd.2011.03.015. [DOI] [PubMed] [Google Scholar]
- Vivas N, Nonier M-F, de Gaulejac NV, et al. Differentiation of proanthocyanidin tannins from seeds, skins and stems of grapes (Vitis vinifera) and heartwood of Quebracho (Schinopsis balansae) by matrix-assisted laser desorption/ionization time-of-flight mass spectrometry and thioacidolysis/liquid c. Anal Chim Acta. 2004;513:247–256. [Google Scholar]
- Wang C, He H, Zhang J, et al. High performance liquid chromatography (HPLC) fingerprints and primary structure identification of corn peptides by HPLC-diode array detection and HPLC-electrospray ionization tandem mass spectrometry. J Food Drug Anal. 2016;24:95–104. doi: 10.1016/j.jfda.2015.05.005. [DOI] [PMC free article] [PubMed] [Google Scholar]
- Wang J, Kalt W, Sporns P. Comparison between HPLC and MALDI-TOF MS analysis of anthocyanins in highbush blueberries. J Agric Food Chem. 2000;48:3330–3335. doi: 10.1021/jf000101g. [DOI] [PubMed] [Google Scholar]
- Wang Y, Chung S-J, Song WO, Chun OK. Estimation of daily proanthocyanidin intake and major food sources in the U.S. diet. J Nutr. 2011;141:447–452. doi: 10.3945/jn.110.133900. [DOI] [PubMed] [Google Scholar]
- Wollgast J, Pallaroni L, Agazzi M-E, Anklam E. Analysis of procyanidins in chocolate by reversed-phase high- performance liquid chromatography with electrospray ionisation mass spectrometric and tandem mass spectrometric detection. J Chromatogr A. 2001;926:211–220. doi: 10.1016/s0021-9673(01)00994-3. [DOI] [PubMed] [Google Scholar]
- Wysocki VH, Resing KA, Zhang Q, Cheng G. Mass spectrometry of peptides and proteins. Methods. 2005;35:211–222. doi: 10.1016/j.ymeth.2004.08.013. [DOI] [PubMed] [Google Scholar]
- Xie D-Y, Dixon RA. Proanthocyanidin biosynthesis - still more questions than answers? Phytochemistry. 2005;66:2127–2144. doi: 10.1016/j.phytochem.2005.01.008. [DOI] [PubMed] [Google Scholar]
- Yanagida A, Murao H, Ohnishi-Kameyama M, et al. Retention behavior of oligomeric proanthocyanidins in hydrophilic interaction chromatography. J Chromatogr A. 2007;1143:153–161. doi: 10.1016/j.chroma.2007.01.004. [DOI] [PubMed] [Google Scholar]
- Zhang H, Cheng Y, Luo X, Duan Y. Protective effect of procyanidins extracted from the lotus seedpod on immune function injury induced by extremely low frequency electromagnetic field. Biomed Pharmacother. 2016;82:364–372. doi: 10.1016/j.biopha.2016.05.021. [DOI] [PubMed] [Google Scholar]


