Abstract
The expression of ATP‐binding cassette subfamily G member 2 (ABCG2) is related to tumorigenic cancer stem cells (CSC) in several cancers. However, the effects of ABCG2 on CSC‐related malignant characteristics in pancreatic ductal adenocarcinoma (PDAC) are not well elucidated. In this study, we compared the characteristics of low (ABCG2−) and high (ABCG2+)‐ABCG2‐expressing PDAC cells after cell sorting. In adherent culture condition, human PDAC cells, PANC‐1, contained approximately 10% ABCG2+ cell populations, and ABCG2+ cells displayed more and longer microvilli compared with ABCG2− cells. Unexpectedly, ABCG2+ cells did not show significant drug resistance against fluorouracil, gemcitabine and vincristine, and ABCG2− cells exhibited higher sphere formation ability and stemness marker expression than those of ABCG2+ cells. Cell growth and motility was greater in ABCG2− cells compared with ABCG2+ cells. In contrast, epithelial‐mesenchymal transition ability between ABCG2− and ABCG2+ cells was comparable. In 3D culture conditions, spheres derived from ABCG2− cells generated a large number of ABCG2+ cells, and the expression levels of stemness markers in these spheres were higher than spheres from ABCG2+ cells. Furthermore, spheres containing large populations of ABCG2+ cells exhibited high resistance against anti‐cancer drugs presumably depending on ABCG2. ABCG2+ cells in PDAC in adherent culture are not correlated with stemness and malignant behaviors, but ABCG2+ cells derived from ABCG2− cells after sphere formation have stemness characteristics and anti‐cancer drug resistance. These findings suggest that ABCG2− cells generate ABCG2+ cells and the malignant potential of ABCG2+ cells in PDAC varies depending on their environments.
Keywords: ABCG2, cancer stem cell, pancreatic cancer, sphere formation, stemness
1. INTRODUCTION
Pancreatic cancer is the 4th leading cause of cancer death in Japan and the third leading cause of cancer death in the USA. The overall survival rate for patients with pancreatic cancer is 8%.1, 2 By the year 2030, pancreatic cancer is expected to become the second leading cause of cancer‐related deaths in the USA, trailing only lung cancer.3 Pancreatic ductal adenocarcinoma (PDAC) is a major histological subtype, comprising 90% of all pancreatic cancer cases. Surgical treatment offers the only possible cure for PDAC; however, 80% of PDAC patients are inoperable at diagnosis. Even after surgery, the 5‐year survival rate is 15%‐20%, owing to the high metastatic rate and local recurrence.4 Currently, chemotherapies or chemoradiotherapies are able to reduce tumor size and improve patients’ prognosis, but these treatments do not fully eradicate PDAC cells in the patients.
A cancer stem cell (CSC) is defined as “a cell within a tumor that possesses the capacity to self‐renew and to cause the heterogeneous lineages of cancer cells that comprise the tumor” (Clarke et al, p. 9340).5 CSC constitute a small proportion of cancer cells and possess high tumorigenic potential in vivo.6 The “stem cell theory” of cancer implies that CSC are responsible for tumor initiation, growth, and even metastasis.7 CSC are also resistant to chemotherapy and radiation and are believed to be responsible for tumor recurrence after completion of adjuvant therapy. CSC chiefly remain in the G0 phase of the cell cycle and are less sensitive to radiation and chemotherapy than proliferating cells.6 Furthermore, CSC possess an effective efflux pathway for anti‐cancer drugs. Thus, researchers regard CSC as a new potential cancer therapeutic target.8, 9
Because CSC efflux chemotherapy drugs efficiently, side population (SP) cells that rapidly efflux DNA‐binding fluorescent dyes are used to select the CSC by flow cytometry. ATP‐binding cassette, subfamily G, member 2 (ABCG2), which is widely expressed in various stem cell populations, is highly expressed in SP cells and is responsible for the maintenance of the SP phenotype.10
In Taylor et al,11 the detailed structure of human ABCG2 was determined by cryo‐electron microscopy. As an important multidrug resistance transporter, ABCG2 has the capability to efflux various chemotherapy drugs and contribute to the drug resistance of cancer cells.12 An SP phenotype and chemoresistance strongly imply that there is a close relationship between ABCG2 expression and CSC maintenance. The conserved expression of ABCG2 in stem cells from both normal tissues and tumor tissues again indicates an important role in stem cell biology.13, 14 SP cells were examined in several types of cancer cells. ABCG2 expression showed that it is related with SP phenotypes enriched with tumorigenic CSC.15, 16 In hepatocellular carcinoma, ABCG2 expression was shown to be correlated with CSC characteristics involving malignant behaviors.17 However, the effects and significance of ABCG2 expression for CSC‐related malignant characteristics in PDAC are not well elucidated.
To clarify the characteristic of ABCG2 in PDAC cells, we compared low ABCG2‐expressing (ABCG2−) and high ABCG2‐expressing (ABCG2+) cells in human pancreatic cancer cell line PANC‐1 after cell sorting. In this study, we show that ABCG2+ PDAC cells have different biological characteristics compared with ABCG2− PDAC cells; ABCG2+ cells can be generated from ABCG2− cells and the malignant potential of ABCG2+ PDAC cells is different for adherent and 3D culture conditions.
2. MATERIALS AND METHODS
2.1. Cell culture
The human PDAC cell line PANC‐1 was obtained from the Cell Resource Center for Biomedical Research, Institute of Development, Aging and Cancer, Tohoku University (Sendai, Japan). The cells were grown in growth medium (RPMI 1640 medium containing 10% FBS) at 37°C under a humidified 5% CO2 atmosphere. For epithelial‐mesenchymal transition (EMT) induction, the cells were cultured in growth medium with 20 ng/mL TGF‐β1 for 48 hours (Peprotech, Rocky Hill, NJ, USA).
2.2. FACS analysis and cell sorting
Cells were harvested and dissociated single cells were incubated with FITC‐conjugated anti‐human ABCG2 antibody (Biolegend, San Diego, CA, USA) or FITC‐conjugated isotype control (Biolegend) diluted in FACS buffer (0.5% [w/v] BSA and 0.1% [w/v] sodium azide in PBS) for 30 minutes on ice. After washing, cells were suspended in cell sorting buffer (25 mmol/L HEPES pH 7.0, 1 mmol/L EDTA, 1% BSA in PBS). Cell sorting and analysis were performed using a FACSAria Cell Sorter (Becton Dickinson, Franklin Lakes, NJ, USA). For the dye efflux assay, the sorted cells were incubated with 20 μmol/L Vybrant DyeCycle Violet Stain (Thermo Fisher Scientific, MA, USA). Mean fluorescence intensities were calculated by subtracting the intensities of the controls.
2.3. Transmission electron microscopy
Cells were fixed with 2.5% glutaraldehyde in 0.1‐M phosphate buffer (pH 7.4). Next, the cells were postfixed for 1 hour with 2% OsO4 dissolved in distilled water, dehydrated in a graded series of ethanol solutions, and embedded in Epon. Ultrathin sections were made on an ultramicrotome and stained with uranyl acetate and lead citrate for examination under a transmission electron microscope (H‐7500, Hitachi). Quantification of PDAC cells showing microvilli on their cell surface was performed as follows. Individual cells were cropped from the original images and cropped images were processed with the Bandpass Filter to enhance edges using Fiji software (RRID:SCR_002285). Pre‐processed images were automatically classified with IMACEL‐Classifier (RRID:SCR_015868). Image features were extracted using lpx296 (CARTA)18 and HLAC (Higher‐order Local AutoCorrelation) and then classified to microvilli‐cell‐class and non‐microvilli‐cell‐class by random forest. To train IMACEL‐Classifiers, training and validation images were manually collected; 81 images are used for training (31 images and 50 images for microvilli‐cell‐class and non‐microvilli‐cell‐class, respectively) and 42 images are used for validation (15 images and 27 images for microvilli‐cell‐class and non‐microvilli‐cell‐class, respectively). The accuracies of microvilli‐cell‐class and non‐microvilli‐cell‐class were 73% and 85%, respectively. Fifty‐four images from ABCG2+ fraction and 55 images from ABCG2− fraction were classified using this classification model. ABCG2− cells were defined as cells within the range of the FITC‐conjugated isotype control. ABCG2+ cells were defined as the cells on the right side that did not overlap the histogram of ABCG2− cells.
2.4. Quantitative RT‐PCR
Total RNA was isolated from cells using the RNeasy Plus Mini Kit (QIAGEN, Hilden, Germany) and subsequently reverse‐transcribed using the ReverTra Ace qPCR RT Kit (Toyobo, Osaka, Japan). Real‐time PCR was performed using the Power Sybr Green Kit (Applied Biosystems, Foster City, CA, USA) and the StepOnePlus Real‐Time PCR System (Applied Biosystems). Primer sets for real‐time PCR are listed in Table 1.
Table 1.
List of primer sets for real‐time PCR
| Gene | Forward primer | Reverse primer |
|---|---|---|
| ABCG2 | TGGCTGTCATGGCTTCAGTACT | CATTATGCTGCAAAGCCGTAAA |
| ALDH1 | GAGCCCTTGCATTGTGTTAGC | CCATGGTGTGCAAATTCAACAG |
| SOX2 | TGCGAGCGCTGCACAT | TCATGAGCGTCTTGGTTTTCC |
| OCT4 | GGAGGAAGCTGACAACAATGAAA | GGCCTGCACGAGGGTTT |
| NESTIN | TCCTGCTGTAGATGCAGAGATCAG | ACCCTGTGTCTGGAGCAGAGA |
| CD24 | TCCAACTAATGCCACCACCAA | GACCACGAAGAGACTGGCTGTT |
| CD44v9 | AGCAGAGTAATTCTCAGAGCTT | TGCTTGATGTCAGAGTAGAAGT |
| E‐CADHERIN | CCAGTGAACAACGATGGCATT | TGCTGCTTGGCCTCAAAAT |
| N‐CADHERIN | TGGGAATCCGACGAATGG | GCAGATCGGACCGGATACTG |
| SNAIL | CCCCAATCGGAAGCCTAACT | GCTGGAAGGTAAACTCTGGATTAGA |
| VIMENTIN | TCCAAACTTTTCCTCCCTGAAC | GGGTATCAACCAGAGGGAGTGA |
| β‐ACTIN | GGTCATCACCATTGGCAATGAG | TACAGGTCTTTGCGGATGTCC |
2.5. Cell proliferation assays
Cells were cultured in growth medium at a density of 5 × 10³ in 96‐well plates followed by incubation for 72 hours. The cells were then incubated with WST‐8 cell counting reagent (Wako Pure Chemical Industries Osaka, Japan) for 2 hours. Optical density was measured using a plate reader (Bio‐Rad Laboratories, Hercules, CA, USA) at 450 nm. For examination of proliferation in spheres, ATP assays using CellTiter‐Glo 2.0 Assay (Promega, Madison, USA) were performed according to the company's protocol.
2.6. Anti‐drug resistance assays
Cells (3.0 × 10³ cells/well) were plated in 96‐well culture plates with growth medium. Each anti‐cancer drug was administered at the indicated concentration after 1 day, and then the cell growth rates were measured using WST‐8 assay after 3 days. For comparison of drug resistance between adherent cells and spheres, ATP assays using CellTiter‐Glo 2.0 Assay were performed 4 days after treatment with anti‐cancer drugs. Verapamil hydrochloride (50 μg/mL; Chem Scene, NJ, USA) was used for inhibition of transporters. Cytotoxicity was calculated according the company's protocol.
2.7. Sphere‐forming assays
To form spheres, cells (1.0 × 10³ cells/well) were plated in 24‐well ultra‐low attachment plates (Corning, Kennebunk, ME) or 96‐well ultra‐low attachment plates (Thermo Fisher Scientific) with growth medium. After 7 days, the spheres were photographed using a phase contrast microscope (Eclipse TS‐100, NIKON). Spheres were then aspirated using micropipettes and put into microcentrifuge tubes for further experiments.
2.8. Wound healing/cell scratch assay
Cells were seeded at a density of 7 × 10³ cells on each side of an Ibidi Cultur‐Insert (Ibidi GmbH, Martinsried, Germany), with a 500‐μm separation between each side of the well, and allowed to grow for 23 hours in growth medium. After removal of the insert, cells were incubated in the same medium. Cells were photographed using phase contrast microscopy at insert removal (0 hour) and following 23 hours of incubation.
2.9. Boyden chamber assay
Cell culture inserts (8‐μm pore size and 6 mm in diameter) were used according to the manufacturer's instructions. Cells at 5 × 10⁴ cells/500 μL were placed onto the upper component of the inserts. After 12 hours, the number of cells that had migrated through the membrane to the lower surface of the filter were fixed and stained with a Diff‐Quick Staining Kit (Polysciences, Warrington, PA, USA). Then, the cells were counted under a light microscope.
2.10. Immunocytochemical staining
Cells were fixed with 4% (w/v) paraformaldehyde and washed. Subsequently, cells were permeabilized with 0.2% [v/v] Triton X‐100 and blocked with PBS containing 1% (w/v) BSA and 5% (v/v) normal goat serum. After washing, cells were incubated with anti‐N‐cadherin (Becton Dickinson) at 4°C overnight. After washing, cells were stained with an Alexa Fluor 488‐conjugated secondary antibody (Molecular Probes, Eugene, OR, USA) and then counterstained with DAPI. Immunofluorescence images were acquired using a confocal laser scanning microscope (Leica Microsystems, Wetzlar, Germany).
2.11. Statistical analysis
Quantitative data are presented as the means ± SD. Differences between 2 groups were analyzed by 2‐tailed Student's t test. Differences were considered significant when P < .05. Computations were performed using Microsoft Excel 2010 (Microsoft Corporation, Redmond, WA, USA).
3. RESULTS
3.1. Sorting of ABCG2+ and ABCG2− pancreatic ductal adenocarcinoma cells in adherent culture condition
In the adherent culture condition, human PDAC cells, PANC‐1, showed the presence of approximately 10% ABCG2+ cell populations (Figure 1A). To investigate the functional properties of ABCG2+ and ABCG2− cells, we sorted PANC‐1 cells based on ABCG2 expression level. FACS‐reanalysis of sorted cells showed that the percentages of ABCG2+ cells in sorted cells from ABCG2 negative or positive populations were approximately 0.2% (low ABCG2‐expressing, ABCG2− cells) or approximately 80% (high ABCG2‐expressing, ABCG2+ cells), respectively (Figure 1B). Furthermore, quantitative RT‐PCR analysis of ABCG2 mRNA showed that ABCG2+ cells expressed 5‐fold higher ABCG2 mRNA levels than ABCG2− cells (Figure 1C). These results confirm that ABCG2+ and ABCG2− cells were well isolated. There are no remarkable morphological differences between ABCG2+ and ABCG2− cells using phase contrast microscopy (data not shown). However, ABCG2+ cells showed a large number of long microvilli on the surface compared with ABCG2− cells by transmission electron microscopy analysis (Figure 1D). To quantify the rate of microvilli‐expressing cells, classification by machine learning was performed. As shown in Figure 1E, a higher percentage of ABCG2+ cells were categorized into microvilli‐expressing cells.
Figure 1.
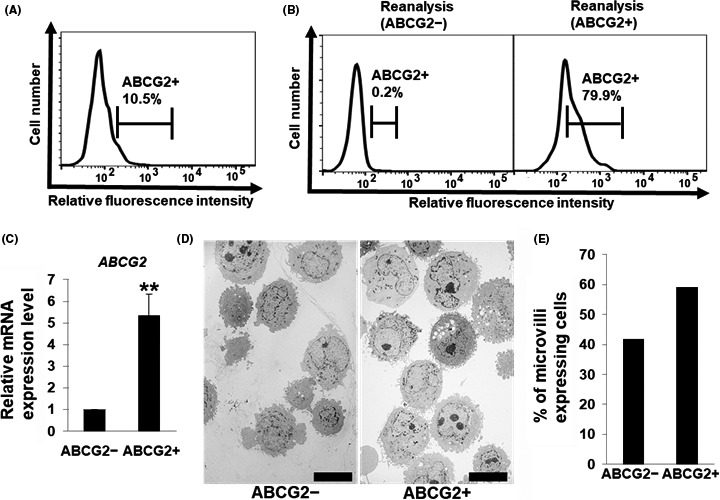
Sorting of ABCG2+ and ABCG2− pancreatic ductal adenocarcinoma cells derived from adherent culture conditions. A, Levels of ATP‐binding cassette subfamily G member 2 (ABCG2) in PANC‐1 cells were analyzed by flow cytometry. Representative results are shown. The gate represents ABCG2 positive cells. B, Levels of ABCG2 in PANC‐1 cells after sorting were re‐analyzed by flow cytometry. Representative results are shown. The gate represents ABCG2 positive cells. C, Quantitative RT‐PCR analysis of ABCG2 was performed using cDNA derived from ABCG2− and ABCG2+ cells. The results are shown after normalization to the values obtained for ABCG2− cells (value = 1). Results are presented as means ± SD from 3 independent experiments; **P < .05. D, Transmission electron microscopic images of ABCG2− and ABCG2+ cells. Scale bar = 10 μm. E, Quantification of microvilli‐expressing cells in ABCG2− and ABCG2+ cells
3.2. Drug resistance of ABCG2+ pancreatic ductal adenocarcinoma cells in adherent culture condition
We compared the ability of drug resistance between ABCG2+ and ABCG2− cells. At first, we examined the function of the efflux pump in ABCG2+ cells. FACS analysis showed that the efflux of dye in ABCG2+ cells was significantly higher than that in ABCG2− cells (Figure 2A), indicating that the efflux pump was functional in ABCG2+ cells. Then, we examined drug resistance of ABCG2+ and ABCG2− cells against the commonly used anti‐pancreatic cancer drugs such as fluorouracil (5‐FU) and gemcitabine. Survival rates of cells after addition of 5‐FU were around 25% and gemcitabine administration showed approximately 55% survival of the cells. Unexpectedly, there were no significant differences in the survival rate between ABCG2+ and ABCG2− cells after treatment with these anti‐cancer drugs (Figure 2B,C). There is a report that ABCG2 contributes to resistance against vincristine, a component of standard CHOP therapy, in PDAC cells.16 Therefore, we examined vincristine resistance in ABCG2+ cells. As shown in Figure 2D, ABCG2+ cells did not show resistance against vincristine. These results indicate that ABCG2+ cells in adherent culture conditions have a functional efflux pump against fluorescent dye; however, the ability of drug resistance is not active in these cells.
Figure 2.
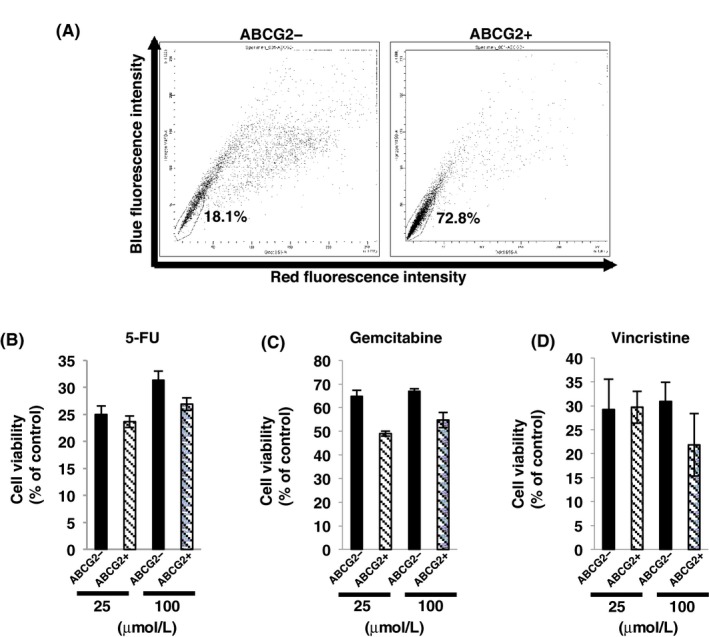
Drug resistance of ABCG2+ pancreatic ductal denocarcinoma cells derived from adherent culture condition. A, Efflux of the dye in ABCG2− and ABCG2+ cells was analyzed by flow cytometry as described in the Materials and Methods, and ABCG2+ cells showed high percentage of side population cells. B‐D, Dose (25 or 100 μmol/L) response of ABCG2− and ABCG2+ cells to fluorouracil (5‐FU) (B), gemcitabine (C) and vincristine (D) was determined using the WST‐8 assay
3.3. Stemness analysis of ABCG2+ pancreatic ductal adenocarcinoma cells in adherent culture conditions
Side population cells, including ABCG2 positive cells, are reported to have characteristics of stemness.15, 16 To clarify the stemness of ABCG2+ PDAC cells, we compared stemness between ABCG2+ and ABCG2− cells by sphere formation and stemness marker analysis. Unexpectedly, sphere‐forming assays showed that ABCG2− cells exhibited more sphere formation than that in ABCG2+ cells (Figure 3A). Furthermore, quantitative RT‐PCR analysis showed that expression levels of 5 out of 6 examined stemness markers (ALDH1, SOX2, OCT4, CD44v9 and NESTIN) were higher in ABCG2− cells than those in ABCG2+ cells (Figure 3B). These results indicate that ABCG2+ cells do not have stem cell characteristics compared with ABCG2− cells in adherent culture conditions.
Figure 3.
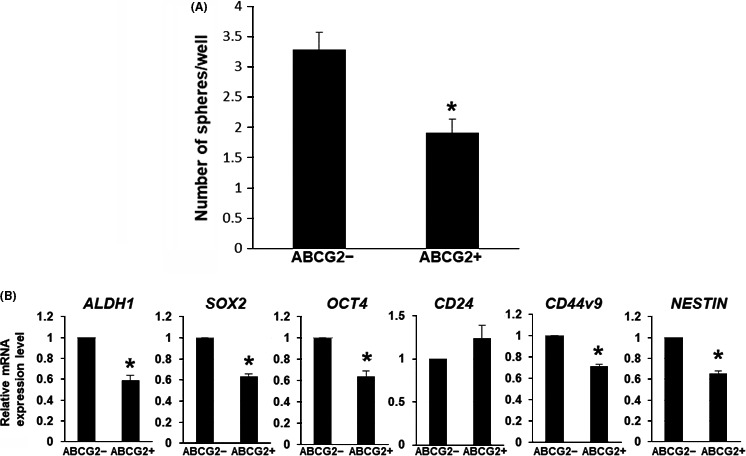
Stemness analysis of ABCG2+ pancreatic ductal adenocarcinoma cells derived from adherent culture condition. A, Sphere‐forming assays showed larger number of the spheres in ABCG2− cells. *P < .01. B, Quantitative RT‐PCR analysis of stemness markers was performed using cDNA derived from ABCG2− and ABCG2+ cells. The results are shown after normalization to the values obtained for ABCG2− cells (value = 1). Results are presented as means ± SD from 3 independent experiments; *P < .01
3.4. Cell growth and motility of ABCG2+ pancreatic ductal adenocarcinoma cells in adherent culture conditions
We compared pancreatic cancer cell behaviors between ABCG2− and ABCG2+ cells. Cell growth rates in ABCG2− cells were significantly higher than that in ABCG2+ cells (Figure 4A). Next, we examined cell motility. In Boyden chamber assays, a larger number of ABCG2− cells migrated through the pores of the membrane compared with ABCG2+ cells (Figure 4B). Furthermore, ABCG2− cells moved a greater distance in comparison with ABCG2+ cells in a cell scratch assay (Figure 4C). These results indicate that ABCG2+ cells do not show malignant behaviors compared with ABCG2− cells in adherent culture conditions.
Figure 4.
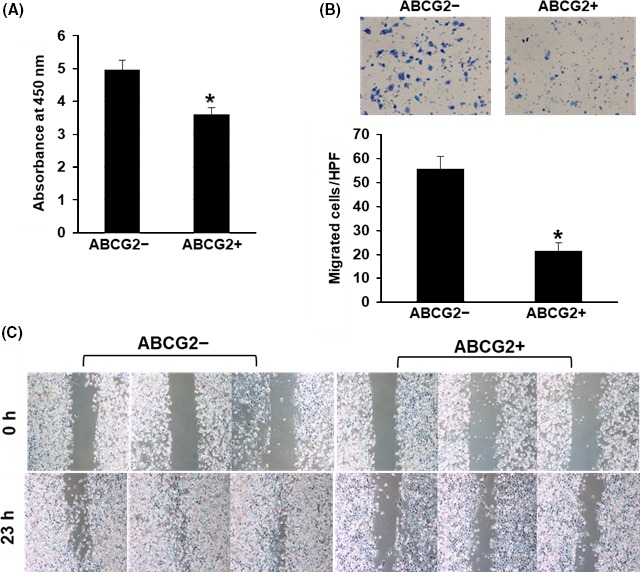
Cell growth and behaviors of ABCG2+ pancreatic ductal adenocarcinoma cells derived from adherent culture condition. A, Cell growth rate was higher in ABCG2− cells. *P < .01. B, ABCG2− cells showed higher migration ability than ABCG2+ cells on the Boyden chamber assay. *P < .01. C, Wound healing/cell scratch assay showed faster cell movement in ABCG2− cells
3.5. Epithelial‐mesenchymal transition ability of ABCG2+ pancreatic ductal adenocarcinoma cells in adherent culture conditions
Epithelial‐mesenchymal transition is known to be associated with stemness and malignant behaviors in cancer.19, 20 Thus, we compared EMT induction via TGF‐β1 between ABCG2− and ABCG2+ cells. Morphological observation and immunostaining of the EMT marker, N‐CADHERIN, showed that both ABCG2− and ABCG2+ cells exhibited a spindle‐like cell shape accompanying increased expression in N‐CADHERIN (Figure 5A). Furthermore, quantitative RT‐PCR analysis of EMT markers showed that the decrease in E‐CADHERIN and increase in other EMT markers are comparable in both cell types (Figure 5B), indicating that there are no differences in ability of EMT induction between ABCG2− and ABCG2+ cells in adherent culture conditions.
Figure 5.
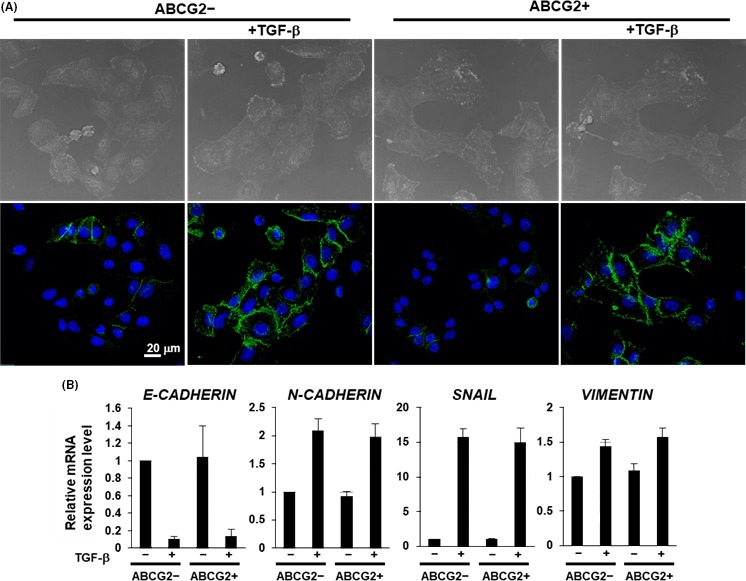
Epithelial‐mesenchymal transition (EMT) ability of ABCG2+ pancreatic ductal adenocarcinoma cells derived from adherent culture condition. A, Immunocytochemical staining was performed in ABCG2− and ABCG2+ cells 48 h after culture with or without TGF‐β1 treatment. Representative images are shown (N‐cadherin, green). B, Quantitative RT‐PCR analysis of EMT markers was performed using cDNA derived from ABCG2− and ABCG2+ cells 48 h after adherent culture with or without TGF‐β1 treatment. The results are shown after normalization to the values obtained for ABCG2− cells without TGF‐β1 treatment (value = 1). Results are presented as means ± SD from 3 independent experiments
3.6. Comparison of stemness between spheres from ABCG2− and ABCG2+ pancreatic ductal adenocarcinoma cells
In several types of cancer cells, freshly isolated ABCG2− cells express higher levels of stemness markers than ABCG2+ cells, resulting in conversion into tumor initiating ABCG2+ cells.15 Furthermore, ABCG2 is known to be crucially related with stemness in areas such as cell proliferation and self‐renewal.21, 22 Sphere formation is a characteristic of stemness. We found that spheres from unsorted PDAC cells exhibited a predominant increase in stemness markers, including ABCG2 (Figure S1). Then, we hypothesized that ABCG2− cells in adherent culture can generate ABCG2+ cells possessing stemness in spheres when cultured in ultra‐low attachment plates. To clarify this hypothesis, we first examined the expression level of ABCG2 in the spheres derived from ABCG2− or ABCG2+ cells. Here, we used 96‐well ultra‐low attachment plates for clear morphological observation in 1 colony. Seven days after sphere formation in 3D culture conditions, ABCG2− cells formed a sphere that included a core‐like structure (Figure 6A left), similar to spheres from unsorted cells (Figure S1A). In contrast, ABCG2+ cells formed a sphere with loose adhesion, gappy and not including a core‐like structure (Figure 6A right). Seven days after re‐culture of sorted cells in adherent culture, ABCG2− cells produced the same levels of ABCG2+ cells (11.1%) to the unsorted cells (10.5%), while ABCG2+ cells were present at comparatively high levels (38.7%), suggesting that the generation of ABCG2− cells from ABCG2+ cells is low (Figure S2A). In contrast, FACS analysis showed that ABCG2 was expressed in the majority (72.1%) of spheres derived from ABCG2− cells, similar to the spheres from unsorted cells (Figures 6B and S1B), suggesting that rapid and high‐level conversion from ABCG2− cells into ABCG2+ cells was induced by the 3D culture conditions. Spheres derived from ABCG2+ cells showed that ABCG2 expression was highly maintained (88.5%) (Figure 6B). Next, we examined stemness of spheres obtained from ABCG2− and ABCG2+ cells. Quantitative RT‐PCR analysis of stemness markers showed that spheres from ABCG2− cells exhibited a predominant increase in all examined markers, similar to the spheres from unsorted cells (Figures 6C, S1C). In contrast, re‐culture of ABCG2− cells in adherent culture did not induce an increase in stemness markers (Figure S2B). These results suggest that adherent cultured ABCG2− cells can convert into ABCG2+ cells possessing stemness in a 3D culture conditions. In contrast, spheres from ABCG2+ cells exhibited a significant increase in only 2 stemness markers, CD24 and CD44v9 (Figure 6C). This result suggests that the conversion ability into cells possessing stemness is weak in adherent cultured ABCG2+ cells. Taken together, these results indicate that ABCG2+ cells derived from ABCG2− cells by 3D culture possess more stemness and are potentially more malignant than ABCG2+ cells in an adherent culture condition.
Figure 6.
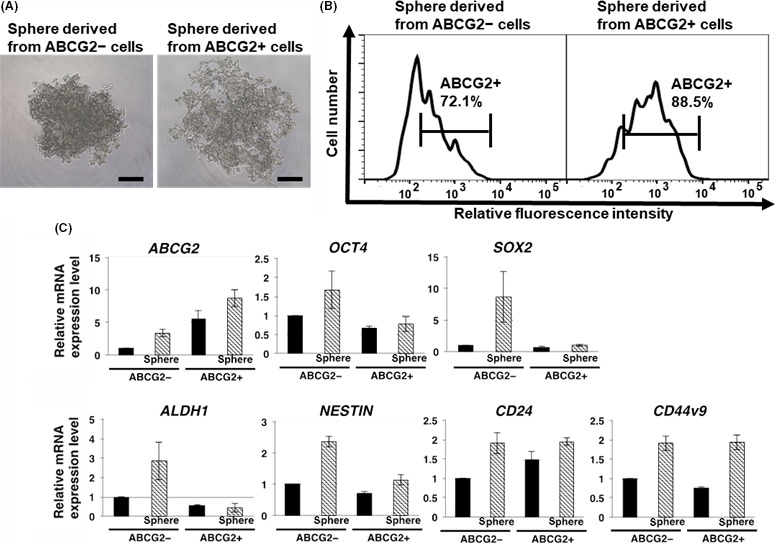
Comparison of stemness in spheres derived from ABCG2− and ABCG2+ adherent cells. A, ABCG2− cells formed a solid sphere including core‐like structure, while ABCG2+ cells formed a sphere with loose adhesion without core‐like structure. Phase contrast images. Scale bar = 250 μm. B, Levels of ABCG2 in ABCG2− and ABCG2+ cells after sphere formation as described in the Materials and Methods were analyzed by flow cytometry. Spheres from ABCG2− adherent cells showed high percentage of ABCG2+ cells. Representative results are shown. The gate represents ABCG2 positive cells. C, Quantitative RT‐PCR analysis showed that the spheres from ABCG2− adherent cells exhibited marked increase in all cancer stem cells (CSC) markers examined. The results are shown after normalization to the values obtained for ABCG2− adherent cells before sphere formation (value = 1). Results are presented as means ± SD from 3 independent experiments
3.7. Drug resistance in spheres from ABCG2− and ABCG2+ pancreatic ductal adenocarcinoma cells
The cell growth in spheres can be examined by ATP assay using the CellTiter‐Glo 2.0 Assay, which is useful for detection of ATP activity in sphere cells. The number of viable cells in culture can be determined based on quantitation of the ATP present. We first examined cell number in spheres from ABCG2− and ABCG2+ cells. These ATP assays showed that growth rates in spheres from ABCG2− cells was significantly higher compared to ABCG2+ cells (Figure 7A), indicating that ABCG2− cells have more ability to proliferate in 3D culture conditions than ABCG2+ cells. We next examined the capacity for drug resistance in sphere cells. As shown in Figure 7B‐D, ABCG2+ cells in adherent culture showed sensitivity against anti‐cancer drugs as similar to the results using WST‐8 (Figure 2B‐D). In contrast, sphere cells expressing high levels of ABCG2 derived from ABCG2− or ABCG2+ cells by 3D culture showed higher survival rates than the cells in adherent culture (Figure 7B‐D). Treatment of verapamil, an inhibitor of transporters, lowered the survival rates, particularly in vincristine‐treated cells, suggesting that ABCG2 highly expressed in spheres contributes to anti‐cancer drug resistance. These results suggest that ABCG2+ cells in 3D culture have a functional efflux pump against anti‐cancer drugs.
Figure 7.
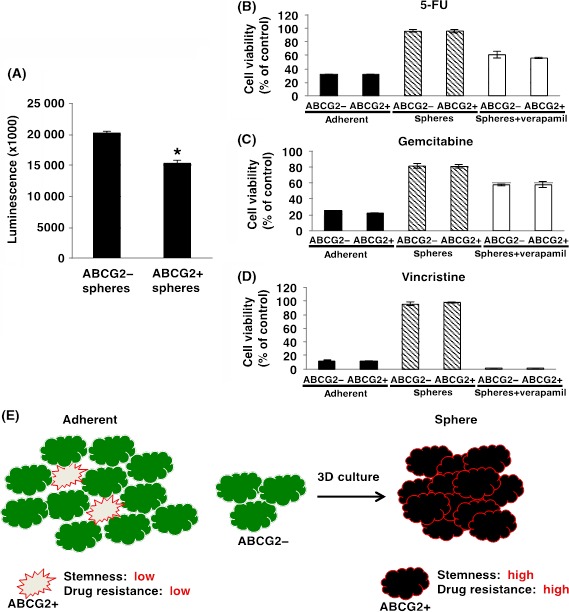
Drug resistance in spheres derived from ABCG2− and ABCG2+ adherent cells. A, Cell proliferation assays were performed in spheres from ABCG2− and ABCG2+ cells as described in the Materials and Methods. Cell growth rate was higher in spheres from ABCG2− cells. Values of means ± SD were obtained from triplicate measurements and significant values are indicated; *P < .01. Representative results are shown from 3 independent experiments. B‐D, Drug resistance of ABCG2− and ABCG2+ cells‐derived adherent cells and spheres against 100 μmol/L fluorouracil (5‐FU) (B), 100 μmol/L gemcitabine (C) and 100 μmol/L vincristine (D) with or without 50 μg/mL verapamil was determined using the ATP assay. Values of means ± SD were obtained from triplicate measurements. Representative results are shown from 3 independent experiments. E, Hypothetical model of effectiveness of culture conditions on ABCG2− and ABCG2+ pancreatic ductal adenocarcinoma cells
4. DISCUSSION
To date, correlations between ABCG2 expression and CSC phenotypes including malignancy have been examined in several types of cancer, but the reports show controversial results. One report demonstrated that freshly isolated ABCG2− cells in glioma, breast, prostate and colon cancer cells exhibit higher malignancy and stemness than ABCG2+ cells, and that ABCG2− cells can convert into tumor initiating ABCG2+ cells.15 In contrast, ABCG2 expression was shown to be correlated with CSC characteristics involving malignant behaviors in hepatocellular carcinoma and proposed that ABCG2 is a potential CSC marker for hepatocellular carcinoma.17 In PDAC cells, ABCG2 expression was suggested to be correlated with malignant CSC phenotypes.23 In our recent study using low‐vacuum scanning and transmission electron microscopy, we found that the spheres of PANC‐1 cells contain a different type of cell that displayed a smooth cell surface or microvilli formation on the cell surface in low‐attachment plates.24 Normal pancreatic ductal cells have microvilli, suggesting that PANC‐1 cells with microvilli are a mature type of cell. In this study, we found that ABCG2+ cells showed more matured cell morphology presenting microvilli on their cell surface than ABCG2− cells in adherent culture conditions. Furthermore, we showed that ABCG2+ cells derived from ABCG2− cells acquire stemness and anti‐cancer drug resistance after sphere formation.
In several cancer cell lines, it is known that SP cells exhibit CSC phenotypes, including malignant behavior.25 Nevertheless, in this study, we demonstrated that efflux ability via ABCG2 is not necessarily correlated with malignant CSC phenotypes in PDAC. That is to say, in SP cells from adherent culture conditions, there are different types of cells, including low malignant CSC phenotypes such as ABCG2+ cells. The SP cells have been reported to be very heterogeneous.26, 27, 28 This may be due to SP cells consisting of the cells that have effective efflux pumps and/or uptake pathways for certain drugs. Therefore, the SP cells detected in cancer cells might contain several subsets of cells, one of which expresses ABCG2, thus explaining the increased ABCG2 expression in the SP cells. Here, we show that ABCG2+ cells likely have malignant CSC phenotypes after sphere formation in 3D culture conditions. In BxPC3 cells, another PDAC cell line, it has been shown that sphere formation induces malignant CSC phenotypes, such as tumor formation and metastasis,16 suggesting that the 3D culture condition might promote conversion of non‐SP to SP cells. In previous reports, the conversion from non‐CSC to CSC was described for human melanoma and breast cancer.29, 30 Thus, we propose that CSC phenotypes including malignancy in PDAC are not clear in adherent culture but may be clarified after 3D culture. To clarify the correlation between efflux ability via ABCG2 and CSC phenotypes including malignancy, further studies are required in comparison with adherent culture and 3D culture conditions.
In this study, ABCG2+ cells in adherent culture condition did not exhibit drug resistance against 5‐FU, gemcitabine and vincristine. Bhagwandin et al16 demonstrate PDAC cells to efflux vincristine. In that report, PANC‐1 cells in adherent culture and BxPC3 cells in spheres showed anti‐cancer drug resistance. We speculate that the conditions in ABCG2+ cells, such as sphere‐derived cells, may be important for the efflux activity against anti‐cancer drugs. Furthermore, activation of the anti‐apoptotic molecules BCL2 and BCL‐XL,31, 32, 33 and expression of transmembrane importers for ant‐cancer drugs34, 35, 36 may be dependent on conditions in ABCG2+ cells. These factors may explain the contradiction that ABCG2+ cells in adherent culture have functional efflux pumps but do not have anti‐cancer drug resistance. Notably, cell populations containing a high percentage of ABCG2+ cells produced in 3D culture condition exhibited a high resistance against anti‐cancer drugs, and sensitivity was observed by verapamil treatment, particularly in vincristine‐treated cells, suggesting that ABCG2 is functional in spheres (Figure 7B‐D). Thus, further studies are important to clarify the potential of the ABCG2 transporter in anti‐cancer drug efflux dependent on cellular conditions such as adherent and 3D culture. Previous reports have shown that 3D culture conditions induce cancer cells to develop CSC phenotypes such as high expression of CSC markers and anti‐cancer drug resistance in some cancer cells.37, 38, 39 In the same fashion, PDAC cells converted into ABCG2+ cells possessing stemness and anti‐cancer drug resistance by 3D culture conditions in this study. Therefore, it is important to clarify the mechanisms of conversion into the malignant ABCG2+ cells to develop new therapeutic strategies targeting ABCG2+ cells. Further detailed studies are needed to compare ABCG2− cells and converted ABCG2+ cells in 3D culture using DNA microarray or mass spectrometry. Alternatively, analysis of stemness in pancreatic cancer using stable knockdown of ABCG2 may provide new additional information about the relationship between ABCG2 and stemness.
In conclusion, small populations of ABCG2+ cells in adherent culture exhibited low drug resistance, low stemness and low malignant behavior. However, 3D culture conditions can produce a majority of ABCG2+ cells possessing high stemness and anti‐cancer drug resistance from ABCG2− cells (Figure 7E). We have previously reported the different morphology and protein expression levels in glioma and pancreatic cancer in different culture conditions.40, 41 3D cell culture systems were expected to mimic in vivo environments.42 Therefore, ABCG2+ cells in pancreatic cancer have the potential of malignancy and elimination of ABCG2+ cells may represent a novel therapeutic option for pancreatic cancer. Further studies are required to clarify the characteristics of ABCG2+ cells in pancreatic cancer, and to develop agents that eliminate ABCG2+ cells for the treatment of pancreatic cancer. ABCG2 may serve as a biomarker and therapeutic targets of malignant CSC in PDAC.
CONFLICT OF INTEREST
The authors declare no conflict of interest.
Supporting information
ACKNOWLEDGMENTS
We thank Y Shimahara, K Sugawara and T Uesaka at LPixel for analyzing electron microscopic images using IMACEL‐Classifier.
Sasaki N, Ishiwata T, Hasegawa F, et al. Stemness and anti‐cancer drug resistance in ATP‐binding cassette subfamily G member 2 highly expressed pancreatic cancer is induced in 3D culture conditions. Cancer Sci. 2018;109:1135–1146. https://doi.org/10.1111/cas.13533
Funding information
JSPS KAKENHI Grant Numbers 16K10613 and 16K08263 (Grant‐in‐Aid for Scientific Research (C)); project of “Development of Cell Manufacturing and Processing Systems for Commercialization of Regenerative Medicine” from Japan Agency for Medical Research and Development; Daiwa Securities Health Foundation
Contributor Information
Toshiyuki Ishiwata, Email: tishiwat@tmig.or.jp.
Masashi Toyoda, Email: mtoyoda@tmig.or.jp.
REFERENCES
- 1. Siegel RL, Miller KD, Jemal A. Cancer statistics, 2017. CA Cancer J Clin. 2017;67:7‐30. [DOI] [PubMed] [Google Scholar]
- 2. Siegel RL, Miller KD, Jemal A. Cancer statistics, 2016. CA Cancer J Clin. 2016;66:7‐30. [DOI] [PubMed] [Google Scholar]
- 3. Rahib L, Smith BD, Aizenberg R, Rosenzweig AB, Fleshman JM, Matrisian LM. Projecting cancer incidence and deaths to 2030: the unexpected burden of thyroid, liver, and pancreas cancers in the United States. Cancer Res. 2014;74:2913‐2921. [DOI] [PubMed] [Google Scholar]
- 4. Jemal A, Siegel R, Ward E, et al. Cancer statistics, 2008. CA Cancer J Clin. 2008;58:71‐96. [DOI] [PubMed] [Google Scholar]
- 5. Clarke MF, Dick JE, Dirks PB, et al. Cancer stem cells–perspectives on current status and future directions: AACR Workshop on cancer stem cells. Cancer Res. 2006;66:9339‐9344. [DOI] [PubMed] [Google Scholar]
- 6. Lonardo E, Hermann PC, Heeschen C. Pancreatic cancer stem cells ‐ update and future perspectives. Mol Oncol. 2010;4:431‐442. [DOI] [PMC free article] [PubMed] [Google Scholar]
- 7. Reya T, Morrison SJ, Clarke MF, Weissman IL. Stem cells, cancer, and cancer stem cells. Nature. 2001;414:105‐111. [DOI] [PubMed] [Google Scholar]
- 8. Matsuda Y, Kure S, Ishiwata T. Nestin and other putative cancer stem cell markers in pancreatic cancer. Med Mol Morphol. 2012;45:59‐65. [DOI] [PubMed] [Google Scholar]
- 9. Ishiwata T. Cancer stem cells and epithelial‐mesenchymal transition: novel therapeutic targets for cancer. Pathol Int. 2016;66:601‐608. [DOI] [PubMed] [Google Scholar]
- 10. Zhou S, Schuetz JD, Bunting KD, et al. The ABC transporter Bcrp1/ABCG2 is expressed in a wide variety of stem cells and is a molecular determinant of the side‐population phenotype. Nat Med. 2001;9:1028‐1034. [DOI] [PubMed] [Google Scholar]
- 11. Taylor NMI, Manolaridis I, Jackson SM, Kowal J, Stahlberg H, Locher KP. Structure of the human multidrug transporter ABCG2. Nature. 2017;546:504‐509. [DOI] [PubMed] [Google Scholar]
- 12. Zhou S, Morris JJ, Barnes Y, Lan L, Schuetz JD, Sorrentino BP. Bcrp1 gene expression is required for normal numbers of side population stem cells in mice, and confers relative protection to mitoxantrone in hematopoietic cells in vivo. Proc Natl Acad Sci U S A. 2002;99:12339‐12344. [DOI] [PMC free article] [PubMed] [Google Scholar]
- 13. Jia Q, Zhang X, Deng T, Gao J. Positive correlation of Oct4 and ABCG2 to chemotherapeutic resistance in CD90(+)CD133(+) liver cancer stem cells. Cell Reprogram. 2013;15:143‐150. [DOI] [PubMed] [Google Scholar]
- 14. Jia Q, Zhang X, Deng T, Gao J. CD44+ CD133+ population exhibits cancer stem cell‐like characteristics in human gallbladder carcinoma. Cancer Biol Ther. 2010;10:1182‐1190. [DOI] [PubMed] [Google Scholar]
- 15. Patrawala L, Calhoun T, Schneider‐Broussard R, Zhou J, Claypool K, Tang DG. Side population is enriched in tumorigenic, stem‐like cancer cells, whereas ABCG2+ and ABCG2− cancer cells are similarly tumorigenic. Cancer Res. 2005;65:6207‐6219. [DOI] [PubMed] [Google Scholar]
- 16. Bhagwandin VJ, Bishop JM, Wright WE, Shay JW. The metastatic potential and chemoresistance of human pancreatic cancer stem cells. PLoS ONE. 2016;11:e0148807. [DOI] [PMC free article] [PubMed] [Google Scholar]
- 17. Zhang G, Wang Z, Luo W, Jiao H, Wu J, Jiang C. Expression of potential cancer stem cell marker ABCG2 is Associated with malignant behaviors of hepatocellular carcinoma. Gastroenterol Res Pract. 2013;2013:782581. [DOI] [PMC free article] [PubMed] [Google Scholar]
- 18. Kutsuna N, Higaki T, Matsunaga S, et al. Active learning framework with iterative clustering for bioimage classification. Nat Commun. 2012;3:1032. [DOI] [PMC free article] [PubMed] [Google Scholar]
- 19. Heldin CH, Vanlandewijck M, Moustakas A. Regulation of EMT by TGFβ in cancer. FEBS Lett. 2012;586:1959‐1970. [DOI] [PubMed] [Google Scholar]
- 20. Oshimori N, Oristian D, Fuchs E. TGF‐β promotes heterogeneity and drug resistance in squamous cell carcinoma. Cell. 2015;160:963‐976. [DOI] [PMC free article] [PubMed] [Google Scholar]
- 21. Wang XK, He JH, Xu JH, et al. Afatinib enhances the efficacy of conventional chemotherapeutic agents by eradicating cancer stem‐like cells. Cancer Res. 2014;74:4431‐4445. [DOI] [PubMed] [Google Scholar]
- 22. Wee B, Pietras A, Ozawa T, et al. ABCG2 regulates self‐renewal and stem cell marker expression but not tumorigenicity or radiation resistance of glioma cells. Sci Rep. 2016;6:25956. [DOI] [PMC free article] [PubMed] [Google Scholar]
- 23. Du Z, Qin R, Wei C, et al. Pancreatic cancer cells resistant to chemoradiotherapy rich in “stem‐cell‐like” tumor cells. Dig Dis Sci. 2011;56:741‐750. [DOI] [PubMed] [Google Scholar]
- 24. Ishiwata T, Hasegawa F, Michishita M, et al. Electron microscopic analysis of different cell types in human pancreatic cancer spheres. Oncol Lett. 2018;15:2485‐2490. [DOI] [PMC free article] [PubMed] [Google Scholar]
- 25. Wang YH, Li F, Luo B, et al. A side population of cells from a human pancreatic carcinoma cell line harbors cancer stem cell characteristics. Neoplasma. 2009;56:371‐378. [DOI] [PubMed] [Google Scholar]
- 26. Nadin BM, Goodell MA, Hirschi KK. Phenotype and hematopoietic potential of side population cells throughout embryonic development. Blood. 2003;102:2436‐2443. [DOI] [PubMed] [Google Scholar]
- 27. Uchida N, Dykstra B, Lyons K, Leung F, Kristiansen M, Eaves C. ABC transporter activities of murine hematopoietic stem cells vary according to their developmental and activation status. Blood. 2004;103:4487‐4495. [DOI] [PubMed] [Google Scholar]
- 28. Montanaro F, Liadaki K, Schienda J, Flint A, Gussoni E, Kunkel LM. Demystifying SP cell purification: viability, yield, and phenotype are defined by isolation parameters. Exp Cell Res. 2004;298:144‐154. [DOI] [PubMed] [Google Scholar]
- 29. Quintana E, Shackleton M, Foster HR, et al. Phenotypic heterogeneity among tumorigenic melanoma cells from patients that is reversible and not hierarchically organized. Cancer Cell. 2010;18:510‐523. [DOI] [PMC free article] [PubMed] [Google Scholar]
- 30. Iliopoulos D, Hirsch HA, Wang G, Struhl K. Inducible formation of breast cancer stem cells and their dynamic equilibrium with non‐stem cancer cells via IL6 secretion. Proc Natl Acad Sci U S A. 2011;108:1397‐1402. [DOI] [PMC free article] [PubMed] [Google Scholar]
- 31. Bold RJ, Chandra J, McConkey DJ. Gemcitabine‐induced programmed cell death (apoptosis) of human pancreatic carcinoma is determined by Bcl‐2 content. Ann Surg Oncol. 1999;6:279‐285. [DOI] [PubMed] [Google Scholar]
- 32. Xu Z, Friess H, Solioz M, et al. Bcl‐x(L) antisense oligonucleotides induce apoptosis and increase sensitivity of pancreatic cancer cells to gemcitabine. Int J Cancer. 2001;94:268‐274. [DOI] [PubMed] [Google Scholar]
- 33. Shi X, Liu S, Kleeff J, Friess H, Büchler MW. Acquired resistance of pancreatic cancer cells towards 5‐Fluorouracil and gemcitabine is associated with altered expression of apoptosis‐regulating genes. Oncology. 2002;62:354‐362. [DOI] [PubMed] [Google Scholar]
- 34. Griffiths M, Beaumont N, Yao SY, et al. Cloning of a human nucleoside transporter implicated in the cellular uptake of adenosine and chemotherapeutic drugs. Nat Med. 1997;3:89‐93. [DOI] [PubMed] [Google Scholar]
- 35. Giovannetti E, Del Tacca M, Mey V, et al. Transcription analysis of human equilibrative nucleoside transporter‐1 predicts survival in pancreas cancer patients treated with gemcitabine. Cancer Res. 2006;66:3928‐3935. [DOI] [PubMed] [Google Scholar]
- 36. Okazaki T, Javle M, Tanaka M, Abbruzzese JL, Li D. Single nucleotide polymorphisms of gemcitabine metabolic genes and pancreatic cancer survival and drug toxicity. Clin Cancer Res. 2010;16:320‐329. [DOI] [PMC free article] [PubMed] [Google Scholar]
- 37. Sun FF, Hu YH, Xiong LP, et al. Enhanced expression of stem cell markers and drug resistance in sphere‐forming non‐small cell lung cancer cells. Int J Clin Exp Pathol. 2015;8:6287‐6300. [PMC free article] [PubMed] [Google Scholar]
- 38. Ning X, Du Y, Ben Q, et al. Bulk pancreatic cancer cells can convert into cancer stem cells (CSCs) in vitro and 2 compounds can target these CSCs. Cell Cycle. 2016;15:403‐412. [DOI] [PMC free article] [PubMed] [Google Scholar]
- 39. Liu H, Wang H, Li C, et al. Spheres from cervical cancer cells display stemness and cancer drug resistance. Oncol Lett. 2016;12:2184‐2188. [DOI] [PMC free article] [PubMed] [Google Scholar]
- 40. Matsuda Y, Ishiwata T, Kawamoto Y, et al. Morphological and cytoskeletal changes of pancreatic cancer cells in three‐dimensional spheroidal culture. Med Mol Morphol. 2010;43:211‐217. [DOI] [PubMed] [Google Scholar]
- 41. Matsuda Y, Kawamoto Y, Teduka K, et al. Morphological and cytoskeletal alterations of nervous system tumor cells with different culturing methods. Int J Oncol. 2011;38:1253‐1258. [DOI] [PubMed] [Google Scholar]
- 42. Yamada KM, Cukierman E. Modeling tissue morphogenesis and cancer in 3D. Cell. 2007;130:601‐610. [DOI] [PubMed] [Google Scholar]
Associated Data
This section collects any data citations, data availability statements, or supplementary materials included in this article.
Supplementary Materials


