Abstract
Diagnosis of endometrial cancer is primarily based on symptoms and imaging, with early‐stage disease being difficult to diagnose. Therefore, development of potential diagnostic biomarkers is required. Metabolomics, a quantitative measurement of the dynamic metabolism in living systems, can be applied to determine metabolite profiles in different disease states. Here, serum metabolomics was performed in 46 early stage endometrial cancer patients and 46 healthy volunteers. In addition, the effect of identified metabolites on tumor cell behavior (invasion, migration, proliferation, apoptosis and autophagy) was examined in endometrial cancer cell lines. Compared with controls, phenylalanine, indoleacrylic acid (IAA), phosphocholine and lyso‐platelet‐activating factor‐16 (lyso‐PAF) were differentially detected in patients. Functional analyses demonstrated that IAA, PAF and phenylalanine all dose‐dependently inhibited tumor cell invasion and migration, and suppressed cell proliferation. PAF also induced tumor cell apoptosis and autophagy, while phenylalanine had no effect on apoptosis or autophagy. IAA triggered apoptosis and had a biphasic effect on autophagy: inhibiting autophagy with doses <1 mmol/L but inducing at 1 mmol/L. Interestingly, the alterations in proliferation, apoptosis and autophagy caused by 1 mmol/L IAA, were all reversed by the concomitant treatment of tryptophan (100 μmol/L). Phosphocholine inhibited tumor cell invasion and migration, and promoted cell proliferation and autophagy, all in a dose‐dependent manner. Phosphocholine also protected cells from TNF‐α‐induced apoptosis. In conclusion, 4 serum metabolites were identified by serum metabolomics in endometrial cancer patients and functional analyses suggested that they may play roles in modulation of tumor cell behavior, although their exact mode of action still needs to be determined.
Keywords: endometrial cancer, indoleacrylic acid, phenylalanine, phosphocholine, platelet‐activating factor‐16
1. INTRODUCTION
Endometrial cancer (EC) is the most common invasive neoplasm of the female genital tract in developed countries and the 2nd most common in developing countries after cervical cancer. It is the 4th most common malignancy in women worldwide.1 Currently the diagnosis of endometrial cancer is primarily from clinical symptoms, and results of imaging, cytology and histopathology tests. Abnormal uterine bleeding, present in approximately 75%‐90% of patients, is the key symptom associated with endometrial cancer, but in premenopausal women the degree of irregular bleeding is low and often ignored.2 Transvaginal ultrasound examination can image the size and shape of the uterine cavity, endometrial thickness, polyps and neoplasm invasiveness, but the cut‐off level of endometrial thickness in abnormal bleeding in premenopausal women is still controversial and unclear for malignancy diagnosis.3 The “gold‐standard” for diagnosis of EC is histological assessment of curettage and endometrial biopsy, but 60% of endometrial intraepithelial neoplasia can be misdiagnosed because of an inability to detect tiny local foci.4, 5, 6 Therefore, early and accurate diagnostic methodology, specific to different stages of endometrial cancer, is required.
Metabolomics, a noninvasive diagnostic technology that focuses on the metabolite profiles involved in disease perturbations and provides a characteristic fingerprint in disease, has been applied to clinical studies of many diseases, including different cancers.7, 8, 9, 10, 11 It is regarded to be a sensitive, accurate and high‐throughput platform for cancer diagnosis, prognostic evaluation and clinical trials, and ultra‐high performance liquid chromatography quadrupole time‐of‐flight mass spectrometry (UPLC‐Q‐TOF/MS) technology has been widely used for metabolite profiling in various clinical samples (eg, in serum and urine). In 2012, differential production of varied metabolites (amino acids and lipids) was detected by Hasim et al12 in the plasma of patients with cervical carcinoma and precancerous lesions. Eight metabolites were indentified by Fan et al13 in the plasma of ovarian epithelial cancer patients that were significantly differentially expressed compared with healthy volunteers. Shao et al6 identified 5 potential EC biomarkers from the urine of 25 EC patients and 10 endometrial hyperplasia patients, including porphobilinogen, acetylcysteine, N‐acetylserine, urocanic acid and isobutyrylglycine. However, they did not investigate the potential biological function of the detected metabolites; it is, therefore, difficult to determine their potential mechanism in tumor metabolism or whether they may be used to determine EC stage in patients. In addition, it is perhaps more accurate to analyze metabolites in serum than in urine because tumor metabolites are delivered from cancer foci to peripheral blood and, therefore, serum metabolites may indicate modulation of tumor behavior and microenvironment.
In the present study, serum metabolite profiling was performed in endometrial cancer patients and healthy female volunteers. The potential role of the differentially expressed metabolites in cellular migration, invasion, proliferation, apoptosis and autophagy, using Ishikawa and AN3 CA endometrial cancer cell lines, was investigated.
2. METHODS
2.1. Patient population
Forty‐six endometrial cancer patients without other chronic disease or medication history in the past 6 months, diagnosed with type I endometrioid endometrial carcinoma by pathology based on FIGO staging guidelines for carcinoma of corpus uteri, were recruited from January to December 2013 in the Department of Obstetrics and Gynecology of the Second Affiliated Hospital of Harbin Medical University, China. Forty‐six healthy female volunteers without diabetes, hypertension or medication history in the past 6 months were recruited from January to December 2013 in the Physical Examination Center of the same hospital. Age and body mass index (BMI) were compared between patients and volunteers, showing no statistical significant difference (P > .05) (Table 1). The stage and grade of endometrial cancer are presented according to the FIGO 2009 Surgical Staging System for Endometrial Cancer (Table 1). Informed consent was obtained from all patients and volunteers involved in this study in accordance with the Declaration of Helsinki and Good Clinical Practice guidelines. Ethical approval was obtained from the Local Ethics Committee of the Faculty of Medical Sciences, Harbin Medical University and the Ethics Committee of Guangzhou Women and Children's Medical Center.
Table 1.
Ages and body mass index (BMI) of endometrial cancer patients and healthy volunteers, and the stage and the grade of endometrial cancer
| Endometrial cancer patients | Healthy volunteers | P‐value | ||
|---|---|---|---|---|
| n | 46 | 46 | ||
| Age, years, mean ± SD | 54 ± 8 | 57 ± 10 | >.05 | |
| BMI Kg/m2, mean ± SD | 26.9 ± 5.1 | 25.8 ± 3.1 | >.05 | |
| FIGO stage | ||||
| n (%) | ||||
| Ia | 27 (59) | |||
| IIb | 19 (41) | |||
| Grade, n (%) | ||||
| 1 | 20 (44) | |||
| 2 | 13 (28) | |||
| 3 | 13 (28) | |||
2.2. Sample preparation
A 5‐mL fasting venous blood sample was collected from each woman enrolled in the study and serum was separated by centrifugation at 1500 g for 10 minutes and stored at −80°C until processing for metabolomics. All the samples were thawed at 4°C prior to analysis and 0.3 mL serum per sample was drawn, mixed with 0.9 mL methanol, vortexed for 2 minutes, and centrifuged at 18 188 g at 4°C for 10 minutes. The supernatant was collected, dried under nitrogen flow, dissolved in a 0.3‐mL mixture of acetonitrile and water (3:1), vortexed for 2 minutes, and centrifuged at 18 188 g at 4°C for 10 minutes. The supernatant was collected for metabolomic profiling.
2.3. Ultra‐high performance liquid chromatography quadrupole time‐of‐flight mass spectrometry analysis and data processing and analysis
Ultra‐high performance liquid chromatography analysis was performed in a Water Acquity UPLC system (Waters, Shanghai, China); 5 μL supernatant was injected into an Acquity UPLC BEH C18 (1.7 μm, 2.1 mm × 100 mm; Waters) through an autosampler at 4°C. The gradient system consisted of 0.1% methanoic acid (HPLC pure, Kemiou, Tianjin, China) dissolved in ultrapure water in mobile phase A, and acetonitrile (HPLC pure, Honeywell Burdick & Jackson, Shanghai, China) in mobile phase B. The column temperature was set at 35°C and the flow rate was 0.35 mL/min. Linear gradient elution was applied according to the elution programs in positive and negative ion modes.
Mass spectrometry was performed on a Waters Micromass Q/TOF Mass Spectrometer, equipped with electronic spray ionization (ESI) and data acquisition in centroid mode. Detection was programmed in both positive and negative ion modes. Positive ion mode: capillary voltage 3000 V, ESI source temperature 110°C, desolvation gas flow 600 L/h, drying gas temperature 320°C, cone gas flow 50 L/h and cone voltage 35 V. Negative ion mode: capillary voltage 2800 V, ESI source temperature 110°C, desolvation gas flow 600 L/h, drying gas temperature 320°C, cone gas flow 50 L/h and cone voltage 35 V. Lock spray interface was applied and leucine‐enkephalin was used as the calibrant (200 pg/mL) for data collection in 10‐second scanning. In positive ion mode, lock spray [M+H]+ = 556.2771; while in negative ion mode, lock spray [M‐H]− = 554.2615, for the assurance of accuracy and reproducibility of the mass‐to‐charge ratio (m/z).
2.4. Data processing and analysis
The metabolomics data were exported through MarkerLynx‐V4.1 software (Waters), including retention time (RT), value of m/z and area of the peak. The statistical analyses, including principal component analysis (PCA), partial least squares discriminant analysis (PLS‐DA) and orthogonal partial least squares discriminant analysis (OPLS‐DA), were performed using EZinfo software (Umetrics, Umeå, Sweden) and VIP value and independent t tests were examined by SPSS 19.0 software. The reference databases used to determine chemical structure were: HMDB (http://www.hmdb.ca), Metlin (http://metlin.scripps.edu) and PubChem (https://pubchem.ncbi.nlm.nih.gov).
2.5. Measurement of phenylalanine, indoleacrylic acid, phosphocholine and platelet‐activating factor‐16 in serum
After protein precipitation with acetonitrile, the concentration of phenylalanine and IAA in the sera of EC patients and volunteers were analyzed by HPLC (Waters). Phenylalanine was detected by its native fluorescence at 210 nm, while IAA was measured by UV absorption at 323 nm. Phosphocholine concentration was determined by liquid chromatography‐tandem mass spectrometry (Waters); 5 μL supernatant was injected into a HILIC column (1.7 μm, 2.1 mm × 50 mm; Waters) through an autosampler at 4°C. The gradient system consisted of ultrapure water/acetonitrile (1:1, v/v) in mobile phase. The column temperature was set at 35°C and the flow rate was 0.2 mL/min. Detection was programmed as: capillary voltage 1000 V, ESI source temperature 120°C, desolvation gas flow 500 L/h, desolvation gas temperature 350°C, cone gas flow 50 L/h, and cone voltage 31 V. Platelet‐activating factor‐16 (PAF) was examined by human PAF ELISA Kit (Abbexa, Cambridge, UK) according to the manufacturer's instructions.
2.6. Cell lines and reagents
Endometrial cancer cell lines, Ishikawa and AN3 CA (Genechem, Shanghai, China), were cultured in DMEM/F12 and DMEM medium, respectively, supplemented with 10% FBS and antibiotics (penicillin 100 U/mL, streptomycin 0.1 mg/mL and amphotericin B 0.25 μg/mL) and maintained at 37°C in a humidified incubator with 5% CO2. The cell lines were authenticated by DNA typing and tested for mycoplasma at the Shanghai Institute for Biological Sciences, Chinese Academy of Science (Shanghai, China). DL‐Phenylalanine, IAA and phosphocholine were purchased from Sigma‐Aldrich (Sigma‐Aldrich, Shanghai, China), PAF was purchased from Merck (Merck Chemicals GmbH, Darmstadt, Germany) and TNF‐α was bought from PEPROTECH (Rocky Hill, NJ, USA); all of these were dissolved in DMEM/F12 or DMEM medium without FBS for use in in vitro experiments.
2.7. Cell migration assay
Cell migration was examined by wound healing assays. Cells were plated at 3 × 10⁵cells/well in 6‐well plates and grown to confluence in 24 hours. After serum starving overnight, a scrape was made through the confluent monolayer with a 200‐μL pipette tip, followed by 3 washes with PBS and chemical treatment for 24 hours. The wounded areas were photographed at 0, 1 and 24 hours after scratching. Chemical treatments included phenylalanine (0.001, 0.01, 0.1, 1 and 10 mmol/L), IAA (0.1, 1, 10, 100 and 1000 μmol/L); phosphocholine (0.01, 0.1, 1, 10 and 100 mmol/L) and PAF (0.01, 0.1, 1, 10 and 100 μmol/L).
2.8. Cell invasion assay
Cell invasion was examined by Matrigel‐coated transwell assays. Cells were plated at 1.5 × 10⁵cells/well and cultured without serum in the top chamber (12‐well, 8‐μm pore filters) coated with Matrigel (Corning, Shanghai, China). In the bottom chamber was placed complete medium with the chemical treatments. After 24 hours, the cells remaining at the upper surface were completely removed by cotton bud. The invaded cells on the bottom of the transwell were fixed by formaldehyde, stained with 0.05% crystal violet, photographed and counted microscopically. Chemical treatments included phenylalanine (0.001, 0.01, 0.1, 1 and 10 mmol/L), IAA (0.1, 1, 10, 100 and 1000 μmol/L), phosphocholine (0.01, 0.1, 1, 10 and 100 mmol/L) and PAF (0.01, 0.1, 1, 10 and 100 μmol/L).
2.9. Cell proliferation assay
Cell proliferation was examined by CellTrace carboxyfluorescein succinimidyl ester (CFSE) staining assay and analyzed by flow cytometry. Cells were stained according to the manufacturer's instructions (Invitrogen, Carlsbad, CA, USA), plated at 3 × 10⁵cells/well in 6‐well plates and cultured overnight, followed by chemical treatment and flow cytometer analysis with 492 nm excitation and 517 emission on a BD FACSCanto Plus (Becton Dickinson and Company, MD, USA). Chemical treatment included phenylalanine (0.001, 0.01, 0.1, 1 and 10 mmol/L), IAA (0.1, 1, 10, 100 and 1000 μmol/L), tryptophan (100 μmol/L) + IAA (1000 μmol/L), phosphocholine (0.01, 0.1, 1, 10 and 100 mmol/L) and PAF (0.01, 0.1, 1, 10 and 100 μmol/L).
2.10. Cell survival assay
Cell survival was examined by alamarBlue staining assay. Cells were plated at 1 × 10⁴cells/well in 96‐well plates, cultured overnight, exposed to the chemicals and analyzed by spectrophotometry at wavelengths of 570 and 600 nm according to the manufacturer's instructions (Bio‐Rad, Hercules, USA). Chemical treatment included phenylalanine (0.001, 0.01, 0.1, 1 and 10 mmol/L), IAA (0.1, 1, 10, 100 and 1000 μmol/L), tryptophan (100 μmol/L) + IAA (1000 μmol/L), phosphocholine (0.01, 0.1, 1, 10 and 100 mmol/L) and PAF (0.01, 0.1, 1, 10 and 100 μmol/L).
2.11. Cell apoptosis assay
Cell apoptosis was examined by Annexin‐V/propidium iodide (PI) staining assay and analyzed by flow cytometry. Cells were plated at 3 × 10⁵cells/well in 6‐well plates, cultured overnight, treated by the chemicals, stained according to the manufacturer's instructions (BioLegend, San Diego, CA, USA) and analyzed by flow cytometer (Ex/Em = 488 nm/525 nm for Annexin‐V detection and Ex/Em = 488 nm/610 nm for PI detection). Chemical treatment included phenylalanine (0.001, 0.01, 0.1, 1 and 10 mmol/L), IAA (0.1, 1, 10, 100 and 1000 μmol/L), tryptophan (100 μmol/L) + IAA (1000 μmol/L), phosphocholine (0.01, 0.1, 1, 10 and 100 mmol/L) + TNF‐α (10 ng/mL) and PAF (0.01, 0.1, 1, 10 and 100 μmol/L).
2.12. Cell autophagy assay
Cell autophagy was examined by monodansylcadaverine (MDC) staining assay and analyzed by flow cytometry. Cells were plated at 3 × 10⁵cells/well in 6‐well plates, cultured overnight, treated by the chemicals, incubated with MDC (Sigma) at the final concentration of 0.05 mmol/L at 37°C for 1 hours and analyzed for autophagy ratio by flow cytometer with 380‐nm excitation and 525‐nm emission. Chemical treatment included phenylalanine (0.001, 0.01, 0.1, 1 and 10 mmol/L), IAA (0.1, 1, 10, 100 and 1000 μmol/L), tryptophan (100 μmol/L) + IAA (1000 μmol/L), phosphocholine (0.01, 0.1, 1, 10 and 100 mmol/L) and PAF (0.01, 0.1, 1, 10 and 100 μmol/L).
2.13. Western blot assay
Cell lysates, after protein determination by Bio‐Rad protein assay, were submitted to 12% SDS‐PAGE for protein separation, which were then transferred onto a PVDF membrane. After blocking at room temperature for 2 hours, the membrane was incubated at 4°C overnight with specific antibodies, including E‐cadherin (1:1000 dilution), vimentin (1:200 dilution), caspase‐3 (1:200 dilution), LC3 (1:200 dilution) and β‐actin (1:50 000 dilution). All antibodies were purchased from AbCam (Cambridge, UK). The target proteins were detected by enhanced chemiluminescence and visualized by cooled CCD camera following the manufacturer's instructions.
2.14. Statistics
Each independent experiment was performed in triplicate and repeated 3 times for metabolite functional analysis. Data are presented as mean ± SD. Data were analyzed by 1‐way ANOVA followed by Tukey's post‐hoc test (GraphPad Prism 6, GraphPad, La Jolla, USA). P < .05 was considered statistically significant.
3. RESULTS
3.1. Serum metabolomic profiling
All the serum samples were analyzed on the UPLC‐Q‐TOF/MS platform and serum metabolites in patients and volunteers were well separated in both positive and negative ion modes (Figure 1A,B) (linear elution programs can be seen in Tables S1 and S2). The raw data were collected in positive and negative ion mode, respectively (Tables S3 and S4), and a score plot was formed for each serum metabolite, showing its productive difference in different samples between the 2 groups (Figure 1C,D) through statistical analyses using PLS‐DA analysis and OPLS‐DA analysis (R 2 Y = 0.896281/Q 2 = 0.751064 in positive ion mode; R 2 Y = 0.92297/Q 2 = 0.621053 in negative ion mode). In total, there were 7646 variables in positive ion mode and 2579 variables in negative ion mode detected and subjected to statistical analysis (Figure 2A,C). To avoid the overfitting of supervised PLS‐DA models, a cross‐validation procedure and testing with 100 random permutations was performed in positive and negative ion modes (Figure 2B,D), using SIMCA‐P software (version 11.5; Umetrics AB, Umeå, Sweden).
Figure 1.
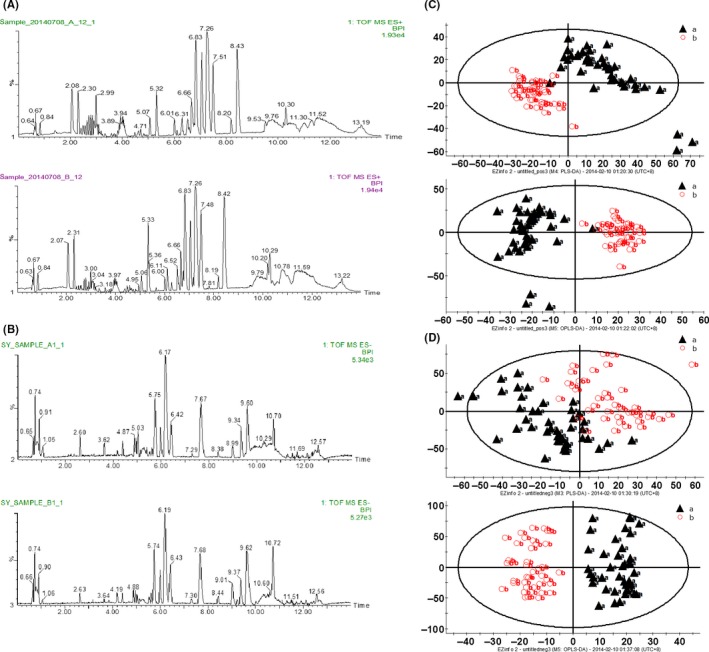
Serum metabolomics analysis. ultra‐high performance liquid chromatography quadrupole time‐of‐flight mass spectrometry (UPLC‐Q‐TOF/MS) based peak intensity chromatogram of serum in electronic spray ionization (ESI) positive ion mode (A) and negative ion mode (B). In each mode, A, endometrial cancer serum; B, healthy volunteer serum; BPI, based peak intensity chromatogram. Serum metabolic‐profiling analysis of endometrial cancer patients (“a”: black triangles) and healthy volunteers (“b”: red circles) in positive ion mode (C) and negative ion mode (D). Patients, n = 46; healthy volunteers, n = 46
Figure 2.
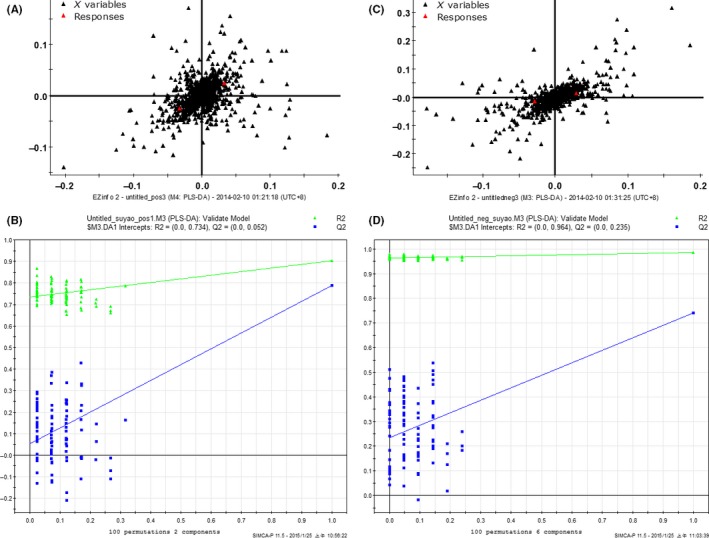
Variables were detected in positive (A) and negative ion mode (C). Cross‐validation examinations were performed in positive (B) and negative ion mode (D) for evaluation of the efficacy of the PLS‐DA model
The serum metabolite profile in each sample was therefore created. All the discriminative metabolites identified by their differential profiling were ranked by their respective value of variable importance in projection (VIP) and independent t test in positive and negative ion modes, and screened with the significance threshold defined by VIP > 1.5 and P < .05 (Tables S5 and S6). The metabolites which presented the most different profiling between patient and volunteer groups were screened, and their potential chemical structures determined through m/z comparisons in different databases. The 4 serum metabolites that may be involved in tumor metabolism were selected for further functional investigation: phenylalanine, indoleacrylic acid (IAA), phosphocholine and lyso‐platelet‐activating factor‐16 (lyso‐PAF) (Table 2).
Table 2.
Identification of differentially abundant metabolites in the serum of endometrial cancer patientsa
| Number | Retention time | Actual mass | Exact mass | Molecule composition | Identityb | Fold changec | P value | Ion mode for detection |
|---|---|---|---|---|---|---|---|---|
| 1 | 1.99 | 166.1000 | 166.0946 | C9H11NO2 | DL‐Phenylalanine | 1.45 | .000 | Positive |
| 2 | 2.25 | 188.0745 | 188.0785 | C11H9NO2 | Indoleacrylic acid | 1.21 | .000 | Positive |
| 3 | 7.01 | 184.0804 | 184.0816 | C5H14NO4P | Phosphocholine | 1.32 | .000 | Positive |
| 4 | 7.46 | 482.3630 | 482.3645 | C24H52NO6P | Lyso‐platelet‐activating factor‐16 | 1.73 | .000 | Positive |
Patients, n = 46; healthy volunteers, n = 46.
Compound identity was confirmed through comparison with the standards in the databases referred to in the Methods.
Value >1 indicates upregulation of the metabolite in the serum of endometrial cancer patients compared with healthy control serum.
3.2. Confirmation of differential production of the serum metabolites between patients and healthy volunteers
The serum concentration of the metabolites, including phenylalanine (Figure 3A), IAA (Figure 3B), phosphocholine (Figure 3C) and PAF (Figure 3D), were determined to confirm their differential distribution between the EC patient and control groups. The concentration of all 4 metabolites was significantly higher in the serum of EC patients compared with healthy volunteers.
Figure 3.
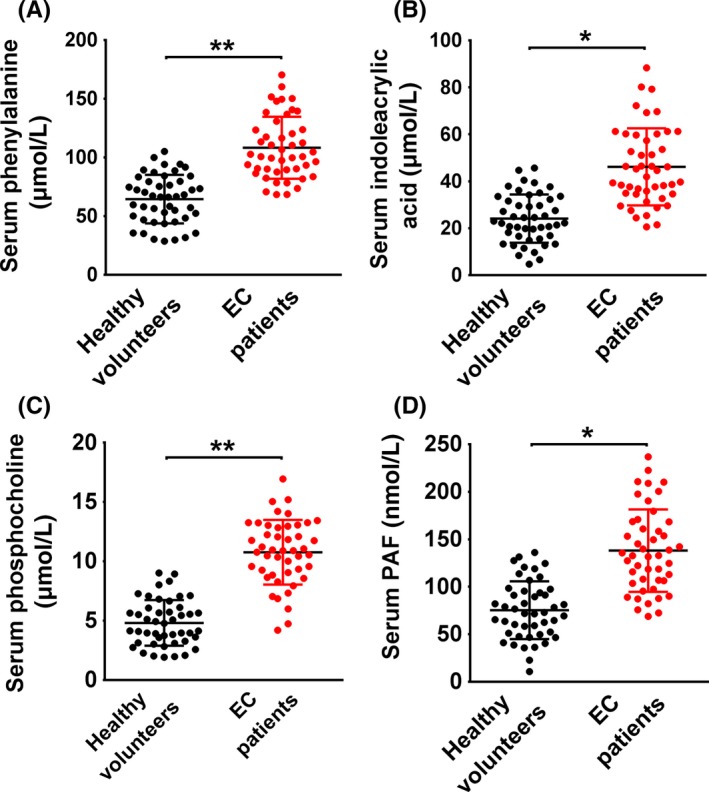
Measurement of the serum concentration of phenylalanine, indoleacrylic acid, phosphocholine and platelet‐activating factor‐16 in endometrial cancer patients and healthy volunteers. *P < .05, **P < .01. EC, endometrial cancer
3.3. Effect of the metabolites on biological behavior of tumor cells
To examine the biological function of the metabolites in endometrial cancer, Ishikawa and AN3 CA cell lines, which are classified as type I and II endometrial cancers, respectively,14, 15 were used as tumor models of early‐stage and advanced‐stage cancer in a range of in vitro tests, including cell invasion (Figure 4A), migration (Figure 4B), proliferation (Figure 5), apoptosis (Figure 6) and autophagy (Figure 7). (Data for the AN3 CA cell line are shown in Figures [Link], [Link], [Link], [Link]). The effect of each metabolite is summarized as follows.
Figure 4.
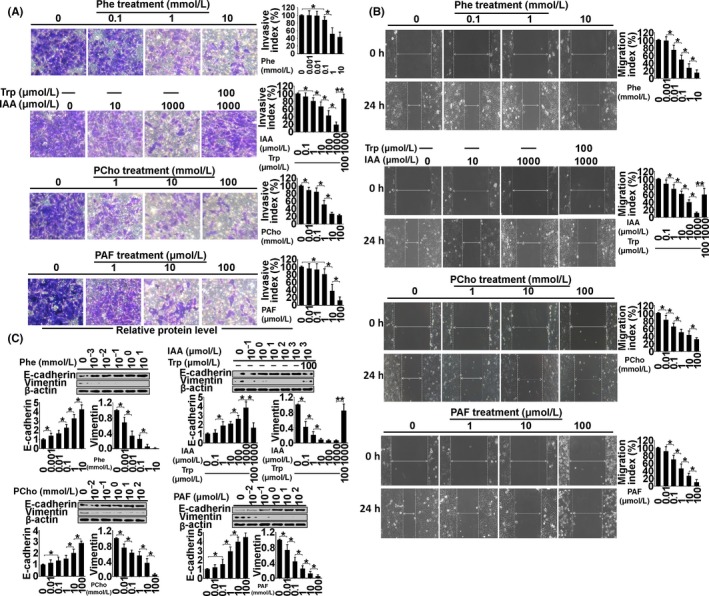
Examination of invasion (A), migration (B) and expression of E‐cadherin and vimentin (C) in Ishikawa cells treated with phenylalanine (Phe), indoleacrylic acid (IAA), phosphocholine (PCho) and platelet‐activating factor‐16 (PAF) for 48 hours. *P < .05, **P < .01
Figure 5.
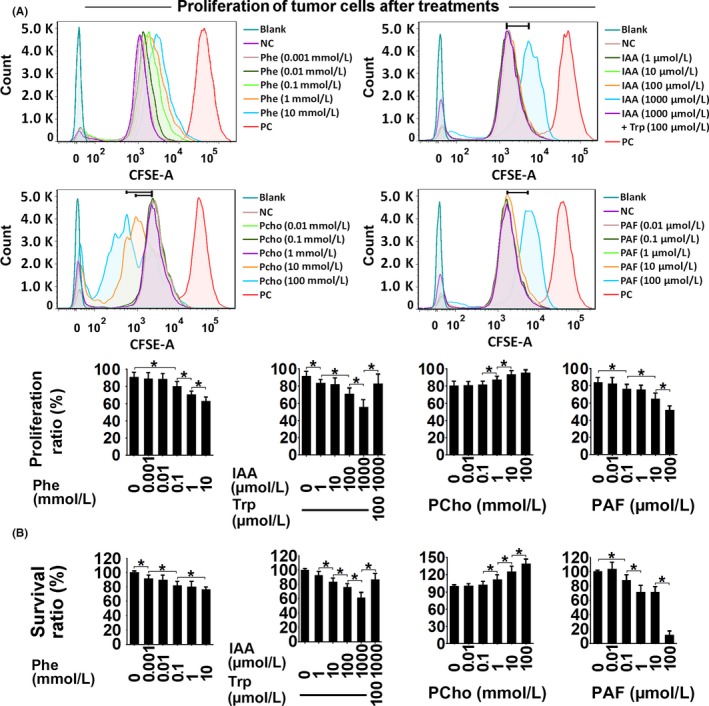
Proliferation (CFSE staining) (A) and survival ratio (alamarBlue staining) (B) in Ishikawa cells treated with phenylalanine (Phe), indoleacrylic acid (IAA), phosphocholine (PCho) and platelet‐activating factor‐16 (PAF) for 48 hours. *P < .05. NC, negative control; PC, positive control
Figure 6.
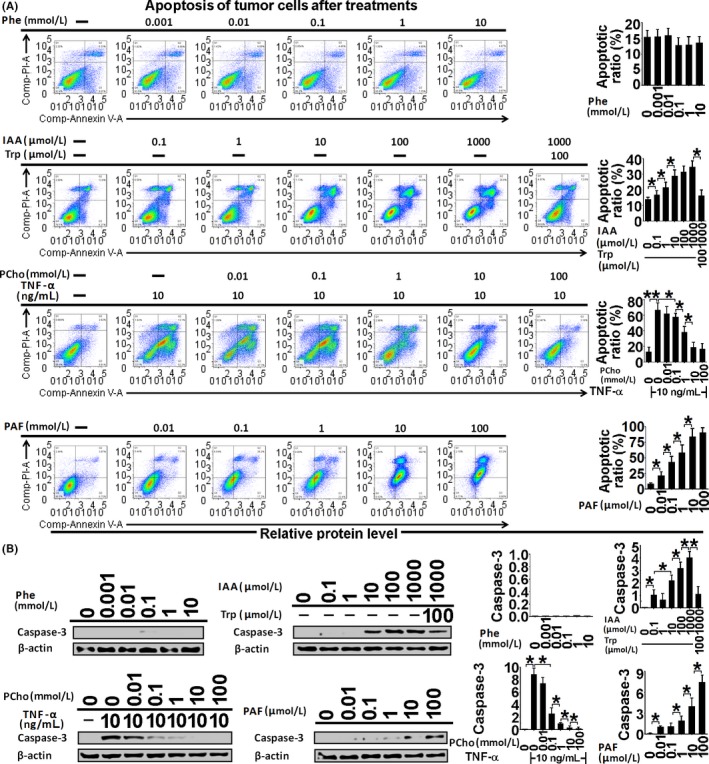
Apoptosis assessment by Annexin‐V/PI staining (A) and active caspase‐3 immunoblotting (B) in Ishikawa cells treated with phenylalanine (Phe), indoleacrylic acid (IAA), phosphocholine (PCho) and platelet‐activating factor‐16 (PAF) for 48 hours. *P < .05, **P < .01
Figure 7.
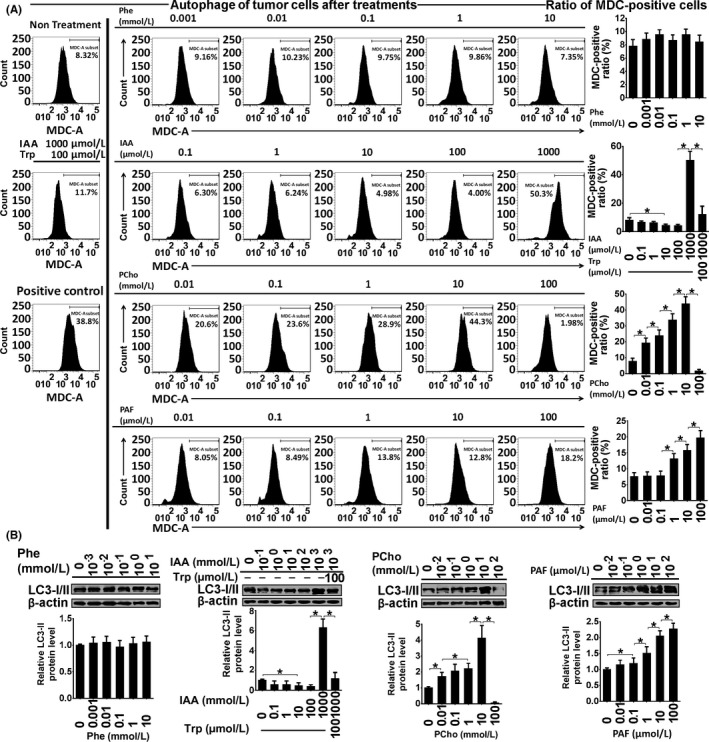
Autophagy assessment by monodansylcadaverine (MDC) staining (A) and LC3‐I/II immunoblotting (B) in Ishikawa cells treated with phenylalanine (Phe), indoleacrylic acid (IAA), phosphocholine (PCho) and platelet‐activating factor‐16 (PAF) for 48 hours. *P < .05
Indoleacrylic acid inhibited Ishikawa and AN3 CA cell invasion, migration and proliferation, and induced mesenchymal‐epithelial transition (MET) and apoptosis (Figures 4, 5, 6). The effect of IAA on autophagy appeared to be biphasic; IAA (dose <1 mmol/L) inhibited autophagy and a dose of 1 mmol/L induced it (1 mmol/L 49.3% vs 7.8% in the negative control) (Figure 7). The alterations in proliferation, apoptosis and autophagy elicited by 1 mmol/L IAA were all reversed by the concomitant treatment of tryptophan (100 μmol/L), suggesting that tryptophan deficiency might be involved in IAA biological action in tumor cells.
Phosphocholine inhibited cancer cell invasion and migration, and induced MET, proliferation and autophagy (Figures 4, 5 and 7). However, the 100 mmol/L dose attenuated the autophagy ratio to below the control level. In addition, phosphocholine protected tumor cells from TNF‐α‐induced apoptosis (Figure 6).
Phenylalanine and PAF both inhibited cell invasion, migration and proliferation, and induced MET in the cancer cell lines (Figures 4 and 5). PAF induced cancer cell apoptosis and autophagy, but phenylalanine had no effect on apoptosis or autophagy (Figures 6 and 7).
4. DISCUSSION
Strategies for early diagnosis and personalized treatment options for endometrial cancer are limited. Current diagnosis relies on clinical symptoms, imaging and histopathology of biopsies. Identification of novel biomarkers that are present in early‐stage disease is critical for development of new diagnostic tests for endometrial cancer. In recent five years, it has become evident that serum metabolites are altered in different diseases states, such as altered serum metabolomic profiles in early breast cancer patients,8 and serum proton NMR metabolomic fingerprints associated with hepatocellular carcinoma,11 etc. Therefore, we sought to determine whether there was a differential profile of serum metabolites present in early‐stage endometrial cancer that may be used as potential diagnostic tools in the future. Therefore, in this study serum metabolomics was performed in early‐stage endometrial cancer patients and healthy volunteers using UPLC‐Q‐TOF/MS technology; 4 metabolites, phenylalanine, IAA, phosphocholine and lyso‐PAF, were differentially expressed between EC patients and controls, and further investigated for their potential function in tumor cell biology.
The concentration of IAA was increased to 46 μmol/L in EC patient sera, compared with the mean physiological concentration of 24 μmol/L. With doses ranging from 0.1 to 1000 μmol/L in vitro, IAA altered cellular function, including proliferation, migration, invasion, autophagy and apoptosis, in Ishikawa and AN3 CA cells. Because IAA is a product from tryptophan metabolism, we hypothesized that IAA might impair cellular function by interfering with tryptophan metabolism in tumor cells. We demonstrated that 100 μmol/L tryptophan reversed IAA‐induced alterations in cellular proliferation, migration, invasion and autophagy, and protected cells from IAA‐induced apoptosis, which might indicate that “tryptophan starvation” may be the mechanism by which IAA impacts tumor cell biology.
Tryptophan starvation mediated through indoleamine 2,3‐dioxygenase (IDO) or tryptophan 2,3‐dioxygenase (TDO)‐catabolized kynurenine pathway, has been shown to be an important mechanism of peripheral immune tolerance and contributes to tumor escape from immune cell detection.16, 17, 18, 19, 20 In the tumor microenvironment, effector T‐cells (Teff) are susceptible to IDO‐mediated tryptophan deprivation, resulting in anergy and apoptosis of Teff. IDO is induced in a variety of cell types such as myeloid‐lineage cells, endothelial cells and cancer cells exposed to inflammatory stimuli.21 In contrast, kynurenine, an IDO‐catabolized tryptophan metabolite, binds to aryl hydrocarbon receptor and promotes the expression of pro‐inflammatory target genes, finally facilitating the generation of regulator T cells (Treg), which affect cytotoxic Teff.17 Indeed, the kynurenin/tryptophan (Kyn/Trp) ratio has been identified as a good index of tryptophan catabolism and is used in the evaluation of efficacy for some cancer therapies.22, 23, 24 In this study, IAA impaired tumor cell function in vitro because of a limitation of tryptophan in culture medium, while in patients tumor cells are supplemented continuously with tryptophan from the microenvironment via the microcirculation. Nevertheless, tryptophan might be deprived in the proximity of cancer foci where T‐cells may be limited. It has been reported that IDO1 is expressed in mucosal cells in endometrium;25, 26 therefore, IAA‐induced tryptophan starvation may contribute to immunotolerance in endometrial cancer patients.
In the current study the physiological concentration of PAF and phenylalanine was approximately 75 nmol/L and 64 μmol/L, respectively. In vitro 10 nmol/L to 100 μmol/L PAF and 1 μmol/L to 10 mmol/L phenylalanine impaired tumor cell proliferation, invasion and migration. In addition, PAF altered autophagy and induced apoptosis, while phenylalanine showed no effect. Compared with IAA‐induced autophagy, which, appeared to be associated with tryptophan limitation, 10 mmol/L phenylalanine only inhibited cell proliferation without any effect on autophagy or apoptosis. Phenylalanine is an essential amino and it is possible that excessive phenylalanine may protect cells from nutrition starvation and autophagy, compared to IAA or PAF.
Phenylalanine and IAA upregulation in peripheral blood are often the consequence of chronic immune activation, inflammation and oxidative stress in cancer patients.27, 28, 29, 30 Platelet‐activating factor has been shown to play a role in UV radiation‐induced dermal immunotolerance, which suppresses delayed type hypersensitivity (DTH), a T‐cell mediated immune reaction.31 During DTH suppression, PAF can induce secretion of interleukin‐10 by mast cells in murine skin, which inhibits the production of T‐cell‐dependent antibodies and attenuates the function of T follicular helper cells.31 In the present study, IAA, PAF and phenylalanine showed their potential impact on the behavior of tumor cells in vitro, but it is not clear whether they also play a role in immunomodulation of cancer foci in endometrial cancer patients.
Another metabolite detected in endometrial cancer patients in this study is phosphocholine, whose physiological concentration was around 4.8 μmol/L. In patient sera phosphocholine levels rose to 10.8 μmol/L. In this study, phosphocholine was administrated in vitro from 10 μmol/L, which induced MET in endometrial cancer cells by impeding cell invasion and migration, promoted proliferation, autophagy and protected from TNF‐α‐induced apoptosis. However, a 100‐mmol/L dose suppressed the autophagy ratio to below control levels. Alterations of choline phospholipid metabolism caused by overexpression of choline kinase‐α and a hyperactivated deacylation have been shown in endometrial cancer samples.32 Moreover, choline kinase‐α activation together with the levels of total choline and phosphocholine are augmented during breast cancer development.33 An increased ratio of phosphocholine/glycerophosphocholine is correlated with malignant transformation in breast and ovarian cancers.34, 35, 36 These studies highlight the role of phosphocholine in the development of malignant tumors.
Physiologically, phosphocholine is a substrate for the synthesis of lysophosphatidic acid (LPA) which is a bioactive phospholipid with a potent regulatory effect on cellular proliferation, migration, invasion and survival, as well as changes in morphology and differentiation.37, 38, 39 Moreover, it has been shown that phospholipase D2 and A2 (enzymes responsible for LPA synthesis) as well as LPA receptors 1 and 2 are all overexpressed in cancerous endometrium of type‐1 endometrial cancer patients;40 therefore, it is possible that phosphocholine could be a potential regulator for malignancy development, such as metastasis. In addition, phosphocholine is also overproduced in grade III endometrioid endometrial cancer patients,32 indicating its role during the development of endometrial cancer.
In conclusion, serum metabolomics was performed in stage I endometrioid endometrial cancer patients and healthy volunteers. For the first time, 4 metabolites were selected from the differentially expressed metabolites for functional analyses, and they had differing effects on tumor cell behavior. However, the role of IAA, PAF and phenylalanine in immunomodulation of endometrial cancer, as well as the effect of phosphocholine and LPA synthesis on endometrial cancer metastasis, requires further study. Their potential application for early and accurate diagnosis of endometrial cancer still needs to be determined.
CONFLICT OF INTEREST
The authors have no potential conflicts of interest.
Supporting information
ACKNOWLEDGMENTS
The authors thank Professor Ying Li from the Department of Nutrition and Food Safety, School of Public Health, Harbin Medical University for the technical support for UPLC‐Q‐TOF/MS analysis.
Shi K, Wang Q, Su Y, et al. Identification and functional analyses of differentially expressed metabolites in early stage endometrial carcinoma. Cancer Sci. 2018;109:1032–1043. https://doi.org/10.1111/cas.13532
Funding information
Guangzhou City Science and Technology Plan (project number: 201607010381); Guangdong Province Science and Technology Plan (project number: 2015‐110‐19)
Shi and Wang equally contributed to this study.
REFERENCES
- 1. Tzur T, Kessous R, Weintraub AY. Current strategies in the diagnosis of endometrial cancer. Arch Gynecol Obstet. 2017;296:5‐14. [DOI] [PubMed] [Google Scholar]
- 2. Haidopoulos D, Simou M, Akrivos N, et al. Risk factors in women 40 years of age and younger with endometrial carcinoma. Acta Obstet Gynecol Scand. 2010;89:1326‐1330. [DOI] [PubMed] [Google Scholar]
- 3. Ozdemir S, Celik C, Gezginç K, Kıreşi D, Esen H. Evaluation of endometrial thickness with transvaginal ultrasonography and histopathology in premenopausal women with abnormal vaginal bleeding. Arch Gynecol Obstet. 2010;282:395‐399. [DOI] [PubMed] [Google Scholar]
- 4. Sanam M, Majid MM. Comparison the diagnostic value of dilatation and curettage versus endometrial biopsy by Pipelle—A clinical trial. Asian Pac J Cancer Prev. 2015;16:4971‐4975. [DOI] [PubMed] [Google Scholar]
- 5. Abdelazim IA, Abdelrazak KM, Elbiaa AA, Al‐Kadi M, Yehia AH. Accuracy of endometrial sampling compared to conventional dilatation and curettage in women with abnormal uterine bleeding. Arch Gynecol Obstet. 2015;291:1121‐1126. [DOI] [PubMed] [Google Scholar]
- 6. Shao X, Wang K, Liu X, et al. Screening and verifying endometrial carcinoma diagnostic biomarkers based on a urine metabolomic profiling study using UPLC‐Q‐TOF/MS. Clin Chim Acta. 2016;463:200‐206. [DOI] [PubMed] [Google Scholar]
- 7. Bachmayr‐Heyda A, Aust S, Auer K, et al. Integrative systemic and local metabolomics with impact on survival in high‐grade serous ovarian cancer. Clin Cancer Res. 2017;23:2081‐2092. [DOI] [PubMed] [Google Scholar]
- 8. Hart CD, Vignoli A, Tenori L, et al. Serum metabolomic profiles identify ER‐positive early breast cancer patients at increased risk of disease recurrence in a multicenter population. Clin Cancer Res. 2017;23:1422‐1431. [DOI] [PMC free article] [PubMed] [Google Scholar]
- 9. Wen S, Li Z, Feng J, Bai J, Lin X, Huang H. Metabonomic changes from pancreatic intraepithelial neoplasia to pancreatic ductal adenocarcinoma in tissues from rats. Cancer Sci. 2016;107:836‐845. [DOI] [PMC free article] [PubMed] [Google Scholar]
- 10. Qiu Y, Cai G, Zhou B, et al. A distinct metabolic signature of human colorectal cancer with prognostic potential. Clin Cancer Res. 2014;20:2136‐2146. [DOI] [PMC free article] [PubMed] [Google Scholar]
- 11. Nahon P, Amathieu R, Triba MN, et al. Identification of serum proton NMR metabolomic fingerprints associated with hepatocellular carcinoma in patients with alcoholic cirrhosis. Clin Cancer Res. 2012;18:6714‐6722. [DOI] [PubMed] [Google Scholar]
- 12. Hasim A, Ali M, Mamtimin B, Ma JQ, Li QZ, Abudula A. Metabonomic signature analysis of cervical carcinoma and precancerous lesions in women by (1)H NMR spectroscopy. Exp Ther Med. 2012;3:945‐951. [DOI] [PMC free article] [PubMed] [Google Scholar]
- 13. Fan L, Zhang W, Yin M, et al. Identification of metabolic biomarkers to diagnose epithelial ovarian cancer using a UPLC/QTOF/MS platform. Acta Oncol. 2012;51:473‐479. [DOI] [PubMed] [Google Scholar]
- 14. Singh M, Spoelstra NS, Jean A, et al. ZEB1 expression in type I vs type II endometrial cancers: a marker of aggressive disease. Mod Pathol. 2008;21:912‐923. [DOI] [PubMed] [Google Scholar]
- 15. Jiang F, Liu T, He Y, et al. MiR‐125b promotes proliferation and migration of type II endometrial carcinoma cells through targeting TP53INP1 tumor suppressor in vitro and in vivo. BMC Cancer. 2011;11:425. [DOI] [PMC free article] [PubMed] [Google Scholar]
- 16. Tanizaki Y, Kobayashi A, Toujima S, et al. Indoleamine 2,3‐dioxygenase promotes peritoneal metastasis of ovarian cancer by inducing an immunosuppressive environment. Cancer Sci. 2014;105:966‐973. [DOI] [PMC free article] [PubMed] [Google Scholar]
- 17. Takamatsu M, Hirata A, Ohtaki H, et al. Inhibition of indoleamine 2,3‐dioxygenase 1 expression alters immune response in colon tumor microenvironment in mice. Cancer Sci. 2015;106:1008‐1015. [DOI] [PMC free article] [PubMed] [Google Scholar]
- 18. Masaki A, Ishida T, Maeda Y, et al. Clinical significance of tryptophan catabolism in Hodgkin lymphoma. Cancer Sci. 2018;109:74‐83. [DOI] [PMC free article] [PubMed] [Google Scholar]
- 19. Sikalidis AK. Amino acids and immune response: a role for cysteine, glutamine, phenylalanine, tryptophan and arginine in T‐cell function and cancer? Pathol Oncol Res. 2015;21:9‐17. [DOI] [PubMed] [Google Scholar]
- 20. van Baren N, Van den Eynde BJ. Tumoral immune resistance mediated by enzymes that degrade tryptophan. Cancer Immunol Res. 2015;3:978‐985. [DOI] [PubMed] [Google Scholar]
- 21. Godin‐Ethier J, Hanafi LA, Piccirillo CA, Lapointe R. Indoleamine 2,3‐dioxygenase expression in human cancers: clinical and immunologic perspectives. Clin Cancer Res. 2011;17:6985‐6991. [DOI] [PubMed] [Google Scholar]
- 22. Vacchelli E, Aranda F, Eggermont A, et al. Trial watch: IDO inhibitors in cancer therapy. Oncoimmunology. 2014;3:e957994. [DOI] [PMC free article] [PubMed] [Google Scholar]
- 23. Platten M, Wick W, Van den Eynde BJ. Tryptophan catabolism in cancer: beyond IDO and tryptophan depletion. Cancer Res. 2012;72:5435‐5440. [DOI] [PubMed] [Google Scholar]
- 24. Pilotte L, Larrieu P, Stroobant V, et al. Reversal of tumoral immune resistance by inhibition of tryptophan 2,3‐dioxygenase. Proc Natl Acad Sci USA. 2012;109:2497‐2502. [DOI] [PMC free article] [PubMed] [Google Scholar]
- 25. Théate I, van Baren N, Pilotte L, et al. Extensive profiling of the expression of the indoleamine 2,3‐dioxygenase 1 protein in normal and tumoral human tissues. Cancer Immunol Res. 2015;3:161‐172. [DOI] [PubMed] [Google Scholar]
- 26. Sedlmayr P, Blaschitz A, Wintersteiger R, et al. Localization of indoleamine 2,3‐dioxygenase in human female reproductive organs and the placenta. Mol Hum Reprod. 2002;8:385‐391. [DOI] [PubMed] [Google Scholar]
- 27. Murr C, Grammer TB, Meinitzer A, Kleber ME, März W, Fuchs D. Immune activation and inflammation in patients with cardiovascular disease are associated with higher phenylalanine to tyrosine ratios: The Ludwigshafen Risk and Cardiovascular Health Study. J Amino Acids. 2014;2014:783730. [DOI] [PMC free article] [PubMed] [Google Scholar]
- 28. Kun S, Molnár GA, Sélley E, et al. Insulin therapy of nondiabetic septic patients is predicted by para‐tyrosine/phenylalanine ratio and by hydroxyl radical‐derived products of phenylalanine. Oxid Med Cell Longev. 2015;2015:839748. [DOI] [PMC free article] [PubMed] [Google Scholar]
- 29. Saed GM, Diamond MP, Fletcher NM. Updates of the role of oxidative stress in the pathogenesis of ovarian cancer. Gynecol Oncol. 2017;145:595‐602. [DOI] [PubMed] [Google Scholar]
- 30. Marklová E. Where does indolylacrylic acid come from? Amino Acids. 1999;17:401‐413. [DOI] [PubMed] [Google Scholar]
- 31. Damiani E, Ullrich SE. Understanding the connection between platelet‐activating factor, a UV‐induced lipid mediator of inflammation, immune suppression and skin cancer. Prog Lipid Res. 2016;63:14‐27. [DOI] [PMC free article] [PubMed] [Google Scholar]
- 32. Trousil S, Lee P, Pinato DJ, et al. Alterations of choline phospholipid metabolism in endometrial cancer are caused by choline kinase alpha overexpression and a hyperactivated deacylation pathway. Cancer Res. 2014;74:6867‐6877. [DOI] [PubMed] [Google Scholar]
- 33. Cheng M, Rizwan A, Jiang L, Bhujwalla ZM, Glunde K. Molecular effects of doxorubicin on choline metabolism in breast cancer. Neoplasia. 2017;19:617‐627. [DOI] [PMC free article] [PubMed] [Google Scholar]
- 34. Glunde K, Jie C, Bhujwalla ZM. Molecular causes of the aberrant choline phospholipid metabolism in breast cancer. Cancer Res. 2004;64:4270‐4276. [DOI] [PubMed] [Google Scholar]
- 35. Aboagye EO, Bhujwalla ZM. Malignant transformation alters membrane choline phospholipid metabolism of human mammary epithelial cells. Cancer Res. 1999;59:80‐84. [PubMed] [Google Scholar]
- 36. Iorio E, Ricci A, Bagnoli M, et al. Activation of phosphatidylcholine cycle enzymes in human epithelial ovarian cancer cells. Cancer Res. 2010;70:2126‐2135. [DOI] [PMC free article] [PubMed] [Google Scholar]
- 37. Yu X, Zhang Y, Chen H. LPA receptor 1 mediates LPA‐induced ovarian cancer metastasis: an in vitro and in vivo study. BMC Cancer. 2016;16:846. [DOI] [PMC free article] [PubMed] [Google Scholar]
- 38. Jeong KJ, Park SY, Cho KH, et al. The Rho/ROCK pathway for lysophosphatidic acid‐induced proteolytic enzyme expression and ovarian cancer cell invasion. Oncogene. 2012;31:4279‐4289. [DOI] [PubMed] [Google Scholar]
- 39. Yoshikawa K, Tanabe E, Shibata A, et al. Involvement of oncogenic K‐ras on cell migration stimulated by lysophosphatidic acid receptor‐2 in pancreatic cancer cells. Exp Cell Res. 2013;319:105‐112. [DOI] [PubMed] [Google Scholar]
- 40. Wasniewski T, Woclawek‐Potocka I, Boruszewska D, Kowalczyk‐Zieba I, Sinderewicz E, Grycmacher K. The significance of the altered expression of lysophosphatidic acid receptors, autotaxin and phospholipase A2 as the potential biomarkers in type 1 endometrial cancer biology. Oncol Rep. 2015;34:2760‐2767. [DOI] [PubMed] [Google Scholar]
Associated Data
This section collects any data citations, data availability statements, or supplementary materials included in this article.
Supplementary Materials


