

Abstract
Interleukin‐35 (IL‐35) is implicated in tumorigenesis, but its exact impact on intrahepatic cholangiocarcinoma (ICC) is not clear. The aim of the present study was to explore the specific effect of IL‐35 on patient prognosis. Additionally, we formulated an effective prognostic nomogram for ICC patients after curative resection. Immunohistochemistry was applied to explore IL‐35 expression as well as IL‐35 receptor (IL‐35R) in 102 ICC patients. Results showed that IL‐35 was highly expressed in ICC tumor tissues and was positively associated with lymph node metastasis (LNM), TNM stage and vascular invasion and was an independent prognostic factor for patients' overall survival (OS) and recurrence‐free survival (RFS). High expression of IL‐35R (gp130 and IL‐12Rβ2) was also observed in ICC cancer tissues, but only gp130 was an independent prognostic factor for OS and RFS and was indispensable in IL‐35‐mediated ICC clinical prognosis. The nomogram comprising carcinoembryonic antigen, LNM, IL‐35 and gp130 expression achieved better predictive accuracy compared with TNM stage for OS. Our data support that high IL‐35 expression correlates with ICC aggressiveness and emerges as a valuable biomarker for evaluating ICC progression and prognosis in clinical work.
Keywords: gp130, IL‐12Rβ2, IL‐35, intrahepatic cholangiocarcinoma, nomogram
Abbreviations
- CEA
carcinoembryonic antigen
- CI
confidence interval
- C‐index
concordance index
- DCA
decision curve analysis
- EBI3
Epstein‐Barr virus (EBV)‐induced gene 3
- HR
hazard ratio
- ICC
intrahepatic cholangiocarcinoma
- IHC
immunohistochemistry
- IL‐35
interleukin‐35
- IL‐35R
IL‐35 receptor
- LNM
lymph node metastasis
- OS
overall survival
- RFS
recurrence‐free survival
- TMA
tissue microarray
1. INTRODUCTION
Intrahepatic cholangiocarcinoma is the second most common liver malignancy arising from the intrahepatic biliary tract,1 and accounts for 10% to 15% of primary liver cancer.2 As an uncommon disease, in recent years, the incidence of ICC is drastically increasing worldwide,3 but there is hardly any progress in the treatment of ICC for OS rate which is still around 22%‐40% after surgical resection.4, 5 To make matters worse, such a dismal situation manifests a major challenge as most ICC patients are not sensitive to conventional chemotherapy and radiotherapy.6, 7 In addition, early identification of ICC seems more difficult because of the early lymphatic metastasis and limited effective diagnoses.8 Therefore, new and specific prognostic biomarkers or scoring systems to stratify the prognosis in ICC patients are urgently needed.
In recent years, much research has confirmed that the tumor microenvironment serves an important role in tumor development.9 Tumor cells use multiple mechanisms to establish an immunosuppressive network for dampening antitumor immunity, predominately by the production of inhibitory immune molecules and induction of regulatory cells.10 IL‐35 is a newly identified cytokine, which belongs to the IL‐12 family and is predominantly produced by regulatory T cells (Treg).11, 12 IL‐35 is a heterodimeric cytokine composed of the P35 subunit of IL‐12 and the EBI3 subunit.13, 14 IL‐12Rβ2 and gp130 are reported as two subunits of IL‐35R15 and are critical for transmitting signals of IL‐35. Downstream signals of IL‐35 can go through a homodimer gp130:IL‐12Rβ2 or gp130:gp130 homodimer and/or IL‐12Rβ2:IL‐12Rβ2 homodimer. After binding with IL‐35R, IL‐35 signals are initiated by the activation of members of the STAT family, then conducted into the nucleus and transcription of target genes is initiated.15, 16 Similar to IL‐10 and transforming growth factor‐β, IL‐35 has been suggested to show potent immunosuppressive effects to repress the functionality of effector T cells.11, 12, 13 Recently, gene‐expression analysis was used to discover that IL‐35 has a broader tissue distribution.17 Likewise, accumulating evidence notes that IL‐35 is upregulated in several tumors, such as colorectal cancer,18 pancreatic cancer19 and hepatocellular carcinoma.20 High expression of IL‐35 contributes to promote tumor cell proliferation, inhibits apoptosis 21 and encourages tumor metastasis.19 Furthermore, elevated levels of P35 and EBI3 expression are detected in poorly differentiated colorectal patients18 and are associated with unfavorable prognosis in pancreatic patients.19 Therefore, further studies are required to concentrate on the specific immune function that IL‐35 exerts in diversified tumors. To the best of our knowledge, clinical correlation and prognostic significance of IL‐35 in ICC patients is currently lacking.
Nomograms are commonly used statistical tools to estimate prognosis of individuals and provide more individualized outcome predictions based on integrating diverse biological and clinical variables. As a result of the obvious superiority compared with a traditional staging system, nomograms have been applied to several tumors to establish models for predicting prognostic factors.22 Herein, we attempt to establish a nomogram integrating clinicopathological variables and IL‐35 expression for evaluating the predictive effect of IL‐35 in ICC patients.
2. MATERIALS AND METHODS
2.1. Tissue samples and clinical data collection
A total of 102 ICC patients who underwent curative resection were enrolled and retrospectively analyzed in the present study at Liver Cancer Institute, Zhongshan Hospital, Fudan University. We have followed the principles outlined in the Declaration of Helsinki for all human experimental investigations. Ethical approval was obtained from the Zhongshan Hospital Research Ethics Committee, and informed consent was obtained from each patient. Inclusion criteria for this study were as follows: (i) patients with no preoperative anticancer treatment; (ii) a definite pathological diagnosis of ICC; (iii) complete removal of tumor tissues; and (iv) complete clinicopathological data and follow‐up information. Conventional clinicopathological variables such as vascular invasion, lymphatic metastasis, and TNM stage were recorded in our study. Child‐Pugh scoring system was adopted for assessing liver function.23 Clinical classification of tumors was estimated in accordance with the American Joint Committee on Cancer (AJCC, Seventh Edition) TNM classification. World Health Organization classification was used to estimate histological grade of tumors, and ICC tissue specimens were classified as well (G1), moderately (G2), or poorly differentiated (G3).24 The interval between surgery and death was defined as OS and the interval between surgery and time of recurrence was defined as RFS.
2.2. Tissue microarray construction and immunohistochemistry
Tissue microarrays were constructed according to a previous research report.25 Two different tissue microarray blocks extracted from each case (3‐mm‐diameter each) were used for TMA construction.
Monoclonal rabbit antihuman antibodies P35, EBI3, gp130 and IL‐12Rβ2 (1:100 dilution) were purchased from Abcam (Cambridge, UK). IHC was used to detect the expression of P35, EBI3, gp130 and IL‐12Rβ2 in tissues of ICC, and surgical produces were carried out as described.26 Two experienced observers were responsible for sliced evaluation in a double blind method. Expression of IL‐35, EBI3 gp130 and IL‐12Rβ2 was evaluated by a semiquantitative scoring system.27 The final score was made by positively stained tumor cells (0, no positive tumor cells; 1, <10%; 2, 10%‐35%; 3, 35%‐75%; 4, >75%) multiplied by staining intensity (1, no staining; 2, weak; 3, moderate; 4, strong). Eventually, total scores ≥8 were defined as high expression and those <8 were defined as low expression. Representative images of positive and negative controls for IHC are shown in Figure S1.
2.3. Cell lines and cell culture
Human cholangiocarcinoma cell lines RBE, HUCCT‐1, HCCC9810 and normal bile duct cell HIBEpic (HBP) were obtained from the Chinese Academy of Sciences (Beijing, China). Cells were cultured in RPMI‐1640 with 10% FBS and 1% penicillin‐streptomycin (Hyclone, Logan, UT, USA), cultured in a 37°C incubator with 5% CO2.
2.4. Western blot
Protein (30 μg) was separated by 10% SDS‐PAGE electrophoresis, then transferred to PVDF (Millipore, Temecula, CA, USA), and the membranes were blocked in 5% BSA for 1 hour, then incubated with primary antibodies (P35, EBI3, gp130 and IL‐12Rβ2 (1:1000 dilution; Abcam) at 4°C overnight. β‐Actin (Kangcheng, Shanghai, China) was used as an internal control. After 12 hours, the membranes were incubated with secondary antibody (Kangcheng) for 1 hour at room temperature. Finally, the protein bands were detected by enhanced chemiluminescent (ECL) substrate and processed by Image, Lab software (Bio‐Rad, Mississauga, ON, Canada).
2.5. Statistical analysis
Statistical analyses were carried out with SPSS 20.0 (SPSS Inc., Chicago, IL, USA). Association between IL‐35 and clinicopathological characteristics was analyzed using chi‐squared test (χ2‐test) or Fisher's exact test. Survival curves were evaluated by Kaplan‐Meier analysis and compared by log‐rank test. Cox proportional hazards regression model was adopted for univariate and multivariate analysis. Variables significant on univariate analysis (defined as P < .05) were chosen as explanatory variables for the multivariate model. P < .05 was considered statistically significant. The rms package in R project (R version 3.0.2) was used to establish a nomogram based on the results of multivariate analysis.28 Predictive accuracy of the nomogram was measured by C‐index and calibration curve. The larger the C‐index, the more accurate the prognostic prediction.29 DCA, a novel evaluation method, assessed the clinical usefulness of the nomograms for the prediction of prognosis.30 This method used a different weight to the true‐ and false‐positive results for incorporating the clinical outcomes of the nomogram. This weight was varied for reflecting divergence in patient preferences or differences in the risks of a procedure. These preferences were expressed in terms of a threshold probability. The following formula was used to calculate the net benefit of DCA.
, where n is total patients, and pt is threshold probability of OS. A high net benefit calculated with favorable probability was the optimal nomogram model. This method and the interpretation of final results are described in detail in these two studies.30, 31
3. RESULTS
3.1. Patient clinicopathological profiles
A total of 102 patients were included in the present study (64 males and 38 females) and average age of the patients was 61.4 ± 9.7 years. Mean tumor size was (5.4 ± 2.7) cm, and 61 patients (59.9%) were noted with tumor size ≥5 cm. Twenty‐three (22.6%) patients had multiple tumor nodules, 43 (42.1%) patients had LNM, and 27 (26.4%) patients had vascular invasion. Fifty‐eight of 102 (56.9%) had poor differentiation. Based on the standard for TNM stage, 39 patients (38.2%) were in stage I + II, and 63 patients (61.8%) were in stage III + IV. Detailed characteristics of patients are presented in Table 1.
Table 1.
Correlations between IL‐35 and clinical parameters in 102 ICC patients
| Parameter | Total | IL35 expression | P‐value | |
|---|---|---|---|---|
| High | Low | |||
| Age (y) | ||||
| ≤61 | 53 | 36 | 17 | .779 |
| >61 | 49 | 32 | 17 | |
| Gender | ||||
| Female | 38 | 28 | 10 | .247 |
| Male | 64 | 40 | 24 | |
| Liver cirrhosis | ||||
| Yes | 17 | 12 | 5 | .707 |
| No | 85 | 56 | 29 | |
| Tumor encapsulation | ||||
| Complete | 12 | 7 | 5 | .514 |
| None | 90 | 61 | 29 | |
| Tumor differentiation | ||||
| Well to moderate | 44 | 29 | 15 | .888 |
| Poor | 58 | 39 | 19 | |
| Tumor number | ||||
| Single | 79 | 53 | 26 | .867 |
| Multiple | 23 | 15 | 8 | |
| Tumor size (cm) | ||||
| <5 | 41 | 27 | 14 | .886 |
| ≥5 | 61 | 41 | 20 | |
| Vascular invasion | ||||
| Yes | 27 | 13 | 14 | .017 |
| No | 75 | 55 | 20 | |
| Lymph node metastasis | ||||
| Yes | 43 | 34 | 9 | .023 |
| No | 59 | 34 | 25 | |
| TNM stage | ||||
| I + II | 39 | 20 | 19 | .010 |
| III + IV | 63 | 48 | 15 | |
| Child‐Pugh score (A vs B) | ||||
| A | 91 | 60 | 31 | .748a |
| B | 11 | 8 | 3 | |
| CEA (ng/mL) | ||||
| ≥5 | 38 | 24 | 14 | .562 |
| <5 | 64 | 44 | 20 | |
| gp130 | ||||
| High | 70 | 59 | 11 | .000 |
| Low | 32 | 9 | 23 | |
| IL‐12Rβ2 | ||||
| High | 70 | 55 | 15 | .000 |
| Low | 32 | 13 | 19 | |
Fisher's exact test.
CEA, carcinoembryonic antigen; ICC, intrahepatic cholangiocarcinoma; IL‐35, interleukin‐35. The bold values were considered to be significant differences.
3.2. Correlation between IL‐35 expression and clinicopathological features
With no specific antibodies for IL‐35, in the present study, we used perfect coexpression of two IL‐35 subunits EBI3 and P35 as a surrogate for IL‐35 level. ICC samples were viewed as “IL‐35 high” (both EBI3 and P35 IHC scores were ≥8). To explore the correlation between IL‐35 and ICC, we carried out IHC analysis of coexpression of P35 and EBI3 in both tumor tissues and matched paratumor specimens. P35 and EBI3 showed perfect colocalization and were primarily localized in the cytoplasm of ICC tissues. In addition, P35 and EBI3 expression was also identified in some nuclei (Figure 1). Expression level of both P35 and EBI3 in tumor tissues was similar to paratumor tissues. P35 and EBI3 were rarely expressed in infiltrating lymphocytes and endothelial cells in ICC tissues (Figures S2,S3).
Figure 1.

Interleukin (IL)‐35 expression in intrahepatic cholangiocarcinoma (ICC) tissues. Immunohistochemistry was used for analysis of the two subunit expression levels of IL‐35: P35 and Epstein‐Barr virus (EBV)‐induced gene 3 (EBI3). (A,B) Representative images are shown for strong, moderate, weak and negative expression of P35 and EBI3 in ICC tumor tissues. (Magnification ×20, ×400; scale bars, 1000 μm, 50 μm)
Staining intensities, namely negative, weak, moderate, strong of P35 and EBI3 were approximately 8.9%, 31.3%, 18.7%, 41.2% and 9.8%, 32.4%, 22.6%, 35.3%, respectively (Figure 2A). More importantly, extent of staining (r = .721, P < .0001, Pearson's correlation analysis) and final IHC scores (r = .697, P < .0001, Spearman's correlation analysis) of EBI3 was noted to be positively correlated to P35 in ICC specimens (Figure 2B,C).
Figure 2.

Correlation analysis between P35 and EBI3 expression in intrahepatic cholangiocarcinoma (ICC) tissues. (A) Distribution of immunohistochemistry (IHC) results of staining intensity of negative, weak, moderate, strong of P35 and Epstein‐Barr virus (EBV)‐induced gene 3 (EBI3) expression. (B,C) Distribution of IHC results for P35 and EBI3 expression. (B) Staining extent correlation analysis (r = .721, P < .0001, Pearson's correlation analysis). (C) Final IHC scores correlation analysis (r = .697, P < .0001, Spearman's correlation analysis). P35 expression was positively associated with EBI3 level in ICC tissues. (D) Both gp130 and interleukin (IL)‐12Rβ2 were highly expressed in ICC tumor tissues, and frequently coexpressed with P35 and EBI3. (Magnification ×20, ×400; scale bars, 1000 μm, 50 μm)
By using coexpression level of EBI3 and P35 as a proxy for IL‐35 level, the final high expression of IL‐35 was assessed as 66.7% (68 out of 102) in ICC tumor tissues. Considering the importance of IL‐35R in transmitting the signals of IL‐35, expression of IL‐35R (gp130 and IL‐12Rβ2) was also detected in ICC tissues. As our results showed, both gp130 and IL‐12Rβ2 were mainly expressed in the cytoplasm of ICC tissues, rarely expressed in infiltrating lymphocytes and endothelial cells, and even frequently coexpressed with P35 and EBI3, in accordance with recent research in pancreatic cancer19 (Figures 2D, S2,S3).
To assess the correlation of IL‐35 with ICC biology, associations between IL‐35 and clinicopathological features were analyzed. As shown in Table 1, high expression of IL‐35 was positively correlated with advanced TNM stage (P = .010, χ2‐test), regional LNM (P = .023, χ2‐test) and vascular invasion (P = .017, χ2‐test). However, no significant correlation was detected in terms of gender, age, liver cirrhosis, tumor size, Child‐Pugh score, or differentiation. Significant positive correlation between IL‐35 and IL‐35R expression was found (gp130; P < .001, χ2‐test), (IL‐12Rβ2; P < .001, χ2‐test). These findings suggested that the IL‐35 ligand was usually accompanied by IL‐35R and was consistent with the reported literature.15, 19
3.3. Prognosis of IL‐35 expression in ICC patients
Patients with high IL‐35 expression were proven to have significantly poorer OS (P < .001, χ2 = 12.495) and shorter RFS (P = .006, χ2 = 7.609) than those with low IL‐35 expression (Figure 3A,B). High expression of gp130 correlated with poor OS (P = .001, χ2 = 11.764) and short RFS (P = .007, χ2 = 7.153) (Figure 3C,D). However, IL‐12Rβ2 was not an independent prognostic factor for both OS (P = .312, χ2 = 1.020) and RFS (P = .725, χ2 = .124) (Figure 3E,F). To obtain further evaluation on the role of IL‐35 in ICC, we investigated the relationship between IL‐35 and prognosis by Cox proportional hazards model. Univariate analysis showed that IL‐35, gp130, tumor size, TNM stage, LNM, and CEA were independent prognostic factors for OS. Independent prognostic factors for RFS were IL‐35, gp30, TNM stage, and LNM (Table 2). Additionally, multivariate analyses indicated that IL‐35, gp130, LNM, and CEA were independent prognostic factors for OS, and that LNM was an independent prognostic factor for RFS (Table 3). Regrettably, the significant differences of IL‐35 and gp130 on RFS disappeared on multivariate analysis. IL‐35‐high and gp130‐high patients were nearly twofold more likely to suffer from poorer OS (HR, 2.141; 95% CI, 1.008‐4.544, P = .048; HR, 2.234; 95% CI, 1.026‐4.866, P = 0.043, respectively). The above findings prompted us to further examine the correlation between IL‐35 and its receptor (gp130 and IL‐12Rβ2) in ICC tissues. We therefore investigated the significance of combined IL‐35 expression and IL‐35R in patient prognosis. Patients were divided into four groups: both IL‐35 and gp130 were high; either IL‐35 or gp130 was high; both IL‐35 and gp130 were low; either IL‐35 or gp130 was low. The poorest OS and shortest RFS were found in ICC patients with a high IL‐35 level and high gp130 staining (Figure 4A). We continued carrying out subgroups to verify our results, showing again that raised IL‐35 and gp130 expression implied poorer OS and shorter RFS (Figure 4B). Similarly, the role of IL‐35 combined with IL‐12Rβ2 was also explored as gp130. Intriguingly, no significant differences in OS and RFS were observed when IL‐35 level was combined with IL‐12Rβ2 expression (Figure 4C). Our subgroup analysis further confirmed this result (Figure 4D). Collectively, these outcomes supported that IL‐35‐related poor prognosis in ICC was associated with gp130 only, but not with IL‐12Rβ2.
Figure 3.

Significance of interleukin (IL)‐35 and IL‐35 receptor (IL‐35R) expression in intrahepatic cholangiocarcinoma (ICC) patients. Kaplan‐Meier analysis of overall survival (OS; left) and recurrence‐free survival (RFS; right) of ICC patients, showing that both (A,B) IL‐35 and (C,D) gp130 were independent prognostic factors for OS and RFS, but (E,F) IL‐12Rβ2 was not
Table 2.
Univariate analyses of factors associated with OS and RFS
| Variable | OS | P‐value | RFS | P‐value |
|---|---|---|---|---|
| HR (95% CI) | HR (95% CI) | |||
| Age (y) | 1.250 (0.758‐2.601) | .382 | 1.218 (0.770‐1.928) | .400 |
| Gender | 0.809 (0.488‐1.342) | .413 | 0.810 (0.507‐1.294) | .378 |
| Liver cirrhosis | 0.837 (0.436‐1.607) | .594 | 0.785 (0.430‐1.431) | .429 |
| Tumor encapsulation | 0.548 (0.219‐1.366) | .197 | 0.642 (0.295‐1.401) | .266 |
| Tumor differentiation | 1.241 (0.751‐2.052) | .400 | 1.598 (0.994‐2.568) | .053 |
| Tumor number (multiple vs single) | 1.533 (0.886‐2.653) | .126 | 1.419 (0.841‐2.349) | .189 |
| Tumor size (≥ 5 cm vs <5 cm) | 1.798 (1.054‐3.068) | .031 | 1.404 (0.87‐2.266) | .164 |
| Vascular invasion | 1.163 (0.673‐2.011) | .588 | 1.387 (0.841‐2.288) | .200 |
| Lymph node metastasis | 3.069 (1.840‐5.120) | .000 | 1.969 (1.241‐3.124) | .004 |
| Child‐Pugh score (A vs B) | 1.394 (0.663‐2.930) | .381 | 1.324 (0.658‐2.665) | .431 |
| TNM stage | 3.008 (1.675‐5.402) | .000 | 1.889 (1.152‐3.097) | .012 |
| CEA (≥5 ng/mL vs <5 ng/mL) | 2.204 (1.337‐3.632) | .002 | 1.561 (0.980‐2.484) | .061 |
| IL35 expression (high vs low) | 2.868 (1.545‐5.324) | .001 | 1.999 (1.191‐3.356) | .009 |
| gp130 expression (high vs low) | 2.939 (1.528‐5.655) | .001 | 2.023 (1.174‐3.484) | .011 |
| IL‐12Rβ2 expression (high vs low) | 1.299 (0.775‐2.177) | .321 | 1.089 (0.668‐1.776) | .733 |
CEA, carcinoembryonic antigen; 95% CI, 95% confidence interval; HR, hazard ratio; IL, interleukin; OS, overall survival, RFS, recurrence‐free survival. The bold values were considered to be significant differences.
Table 3.
Multivariate analyses of factors associated with OS and RFS
| Variable | OS | P‐value | RFS | P‐value |
|---|---|---|---|---|
| HR (95% CI) | HR (95% CI) | |||
| Tumor size (≥5 cm vs <5 cm) | 1.326 (0.752‐2.339) | .329 | NA | |
| Lymph node metastasis | 2.440 (1.157‐5.147) | .019 | 2.538 (1.353‐4.761) | .004 |
| TNM stage | 1.173 (0.583‐2.362) | .654 | 1.505 (0.799‐2.835) | .206 |
| CEA (≥5 ng/mL vs <5 ng/mL) | 1.920 (1.142‐3.226) | .014 | NA | |
| IL‐35 expression (high vs low) | 2.141 (1.008 ‐4.544) | .048 | 1.570 (0.878‐2.806) | .128 |
| gp130 expression (high vs low) | 2.234 (1.026‐4.866) | .043 | 1.610 (0.891‐2.909) | .115 |
CEA, carcinoembryonic antigen; 95% CI, 95% confidence interval; HR, hazard ratio; IL, interleukin; NA, not applicable; OS, overall survival, RFS, recurrence‐free survival. The bold values were considered to be significant differences.
Figure 4.
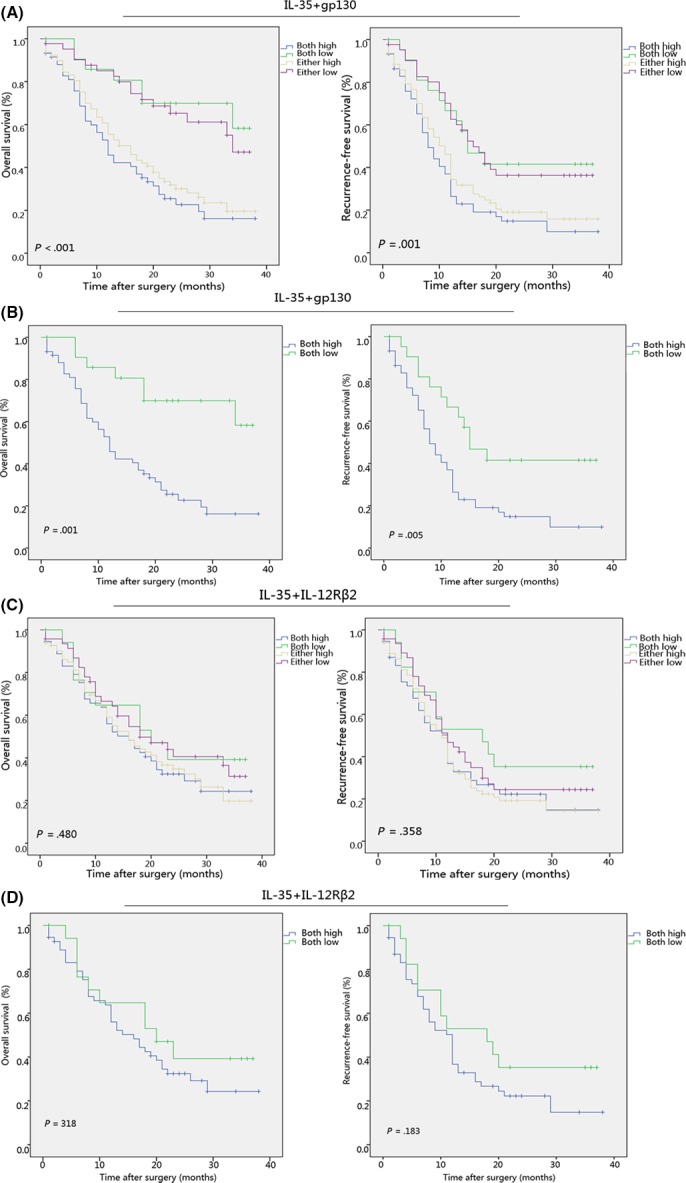
gp130 expression is essential for interleukin (IL)‐35‐associated poor prognosis of patients with intrahepatic cholangiocarcinoma (ICC). (A‐D) Kaplan‐Meier analysis of overall survival (OS; left) and recurrence‐free survival (RFS; right) of ICC patients showing a high IL‐35 level combined with high gp130 expression implied the poorest OS and RFS in ICC patients
To further investigate whether IL‐35 can discriminate between patients with different clinicopathological features, subgroup analyses were carried out. IL‐35 was identified to stratify OS regarding LNM, tumor differentiation, and TNM stage (Figure 5). Additionally, IL‐35 had the capability of stratifying RFS such as tumor with LNM, vascular invasion and some other clinicopathological features (Figure 6).
Figure 5.

Overall survival (OS) curves for the expression of interleukin (IL)‐35 among intrahepatic cholangiocarcinoma subgroups. Subgroup analysis indicated that significant differences in OS were found between IL‐35 high and IL‐35 low patients after categorization by clinicopathological variables
Figure 6.
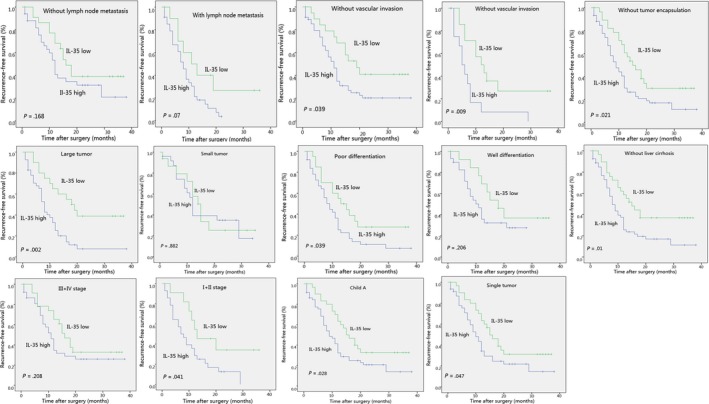
Recurrence‐free survival (RFS) curves for the expression of interleukin (IL)‐35 among intrahepatic cholangiocarcinoma subgroups. Subgroup analysis indicated that significant differences in RFS were found between IL‐35 high and IL‐35 low patients after categorization by clinicopathological variables
3.4. Prognostic nomogram for OS
Finally, we integrated all significant independent prognostic factors according to multivariate analysis (Table 3) to create a prognostic nomogram (Figure 7A). C‐index for OS prediction of the nomogram integrating CEA, lymph node metastasis, IL‐35 and gp130 expression was 0.72 (95% CI, 0.69‐0.75) and the C‐index for OS prediction of CEA, gp130, and IL‐35 was 0.595 (95% CI, 0.592‐0.598), 0.61 (95% CI, 0.607‐0.613), and 0.616 (95% CI, 0.613‐0.619), respectively. Calibration plot for the probabilities of OS at 1, 2, and 3 years after surgery fitted well between the prediction by nomogram and the actual observation. (Figure 7B‐D). Nomogram was reported to be a more accurate model than the conventional staging systems in predicting prognosis of cancers.28, 32, 33 In line with recent research, our nomogram showed a better predictive capability for prediction of OS compared to TNM stage, with a C‐index of 0.72 (95% CI, 0.69‐0.75) and 0.633 (95% CI, 0.630‐0.636), respectively. On decision curve analysis, the nomogram showed superior net benefit with a wider range of threshold probability for predicting 1‐, 2‐, and 3‐year OS relative to TNM stage (Figure 7E‐G). This suggested that if ICC patients had a high expression of IL‐35 and its receptor gp130, they should be classified as a high‐risk population for predicting a poorer OS. Measures to detect the expression of IL‐35 and gp130 early should be instituted.
Figure 7.
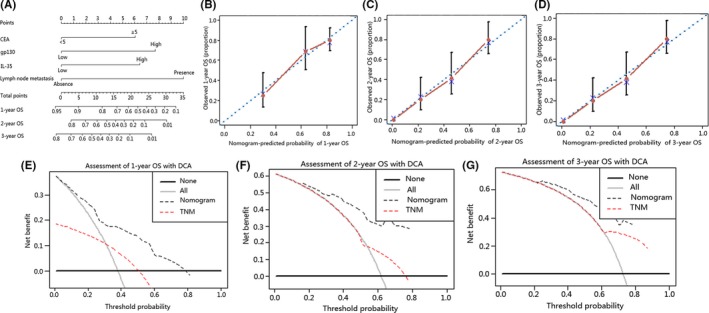
Intrahepatic cholangiocarcinoma (ICC) prognostic nomogram, calibration curve and decision curve analysis (DCA). (A) Nomogram predicting overall survival (OS) in patients with ICC. (To use the nomogram, an individual patient's value is located on each variable axis, and a line is drawn upwards to determine the number of points received for each variable value. The sum of these numbers is located on the Total Points axis, and a line is drawn downwards to the survival axes to determine the likelihood of 1‐, 2‐ and 3‐y OS.) Calibration curve for predicting OS at (B) 1 y, (C) 2 y and (D) 3 y. Nomogram‐predicted probability of overall survival is plotted on the x‐axis and actual overall survival is plotted on the y‐axis. DCA depict the clinical net benefit in pairwise comparisons across the different models. Nomogram is compared with the TNM stage in terms of (E) 1‐y, (F) 2‐y and (G) 3‐y OS. Dashed lines indicate the net benefit of the predictive models across a range of threshold probabilities (black: nomogram; red: TNM stage). Horizontal solid black line represents the assumptions that no patient will experience the event, and the solid grey line represents the assumption that all patients will experience the event. On DCA, the nomogram showed superior net benefit compared with TNM stage across a wider range of threshold probabilities. CEA, carcinoembryonic antigen
3.5. Expression of IL‐35 and IL‐35R in ICC cell lines
Western blot analysis showed that protein expression of P35, EBI3, gp130 and IL‐12Rβ2 was highly expressed in ICC cells compared with HBP cells (Figure S4). Our results suggested that the expression of IL‐35 and IL‐35R was upregulated in ICC cells.
4. DISCUSSION
Herein, we detected expression of IL‐35 in 102 ICC patients and conducted a series of prognostic analyses. We first used coexpression of two IL‐35 subunits EBI3 and P35 to serve as a proxy to determine IL‐35 level. As discovered, EBI3 and P35 were highly coexpressed in ICC tumor tissues, which was consistent with previous findings.34, 35, 36 In line with the related research on pancreatic cancer,19 raised expression of IL‐35R (gp130 and IL‐12Rβ2) was also observed in ICC tissues. Additionally, our western blot results in ICC cells supported these conclusions, namely that elevated expression of IL‐35 and IL‐35R was also detected in ICC cells compared with normal bile duct cells HBP.
Results of analyzing the relationship between IL‐35 and clinicopathological features suggested that IL‐35 overexpression was significantly associated with LNM, advanced TNM stage, and vascular invasion, thus suggesting a special function of IL‐35 in ICC metastasis and poor prognosis. More importantly, the close correlation between IL‐35 expression and IL‐35R (gp130 and IL‐12Rβ2) was uncovered in our research, which prompted us to suspect the significance of IL‐35 combined with IL‐35R in prediction of ICC outcome.
No matter whether in univariate or multivariate analysis, high IL‐35 level and gp130 expression more likely implied poorer OS; intriguingly, no significant correlation was observed between IL‐12Rβ2 and prognosis in ICC patients. IL‐35 expression was strengthened as an independent prognostic factor only along with gp130 receptor. We reasonably speculated that IL‐35 overexpression promoted ICC progression through an IL‐35 ligand‐gp130 receptor signaling pathway. With the desire to verify this hypothesis, we investigated the significance of combined IL‐35 expression and IL‐35R in patient prognosis. Our results confirmed that more remarkable disparity between different groups was observed when IL‐35 was combined with gp130. High IL‐35 expression and gp130 level illustrated the poorest OS and shortest RFS, but no significant positive correlation was observed when IL‐35 was combined with IL‐12Rβ2, which was identical to a recent study.19 This evidence was provocative in suggesting that although both subunits of IL‐35R were expressed in ICC, only gp130 was indispensable in IL‐35‐mediated ICC clinical prognosis.
Research has shown that nomograms can establish a more effective model in the prediction of prognosis of cancers compared with the traditional staging system, and the serological marker CEA has been viewed as independent risk factor for the prognosis of ICC.28 It is therefore logical to create a nomogram integrating CEA, lymph node metastasis, IL‐35 and gp130 expression to verify whether the predictive performance of a nomogram is better than traditional staging systems in ICC. Fortunately, our nomogram provided better predictive accuracy in the prediction of OS relative to TNM stage. Our results were supportive in suggesting that immune molecules (IL‐35, gp130) should be incorporated into the ICC prognostic system to improve discriminative ability.
Several limitations in the present study should be noted. First, the study was retrospective in nature and the patients were from a single institution in China. Second, as a result of the relatively small number of clinical patients included in this study, external validation was not carried out. Third, follow‐up time was relatively short, as only 3 years of OS and RFS were included in our study.
In conclusion, despite the acknowledged limitations, our results suggest that high IL‐35 level positively associates with ICC aggressiveness and can be viewed as a convenient novel prognostic factor for the prediction of survival and recurrence in ICC patients.
CONFLICT OF INTEREST
Authors declare no conflicts of interest for this article.
Supporting information
ACKNOWLEDGMENTS
This research was supported by grants from the National Natural Science Foundation of China (81173391, 81302102) and National Youth Foundation of China (81400768), National Key Sci‐Tech Special Project of China (2012ZX10002010‐001/002), National Research Programs of Science and Technology Commission Foundation (2017YFC0908101) and Basic Research Programs of Science and Technology Commission Foundation of Shanghai (13JC1401800, XBR2013074, 13CG04).
Zhang M, Gan W, Jing C, et al. Overexpression of interleukin‐35 in intrahepatic cholangiocarcinoma is a prognostic indicator after curative resection. Cancer Sci. 2018;109:1195–1206. https://doi.org/10.1111/cas.13535
Funding information
National Key Sci‐Tech Special Project of China (Grant/Award Number: ‘2012ZX10002010‐001/002‘), National Natural Science Foundation of China (Grant/Award Numbers: ‘81302102’ and ‘81173391‘), National Research Programs of Science and Technology Commission Foundation (Grant/Award Number: ‘2017YFC0908101‘), Basic Research Programs of Science and Technology Commission Foundation of Shanghai (Grant/Award Numbers: ‘13JC1401800’, ‘XBR2013074’, ‘13CG04‘), National Youth Foundation of China (Grant/Award Number: ‘81400768‘).
Zhang, Gan, Jing, and Zheng contributed equally to this work and should be considered as co‐first authors.
Contributor Information
Bo‐heng Zhang, Email: zhang.boheng@zs-hospital.sh.cn.
Shuang‐jian Qiu, Email: qiu.shuangjian@zs-hospital.sh.cn.
REFERENCES
- 1. Shaib Y, El‐Serag HB. The epidemiology of cholangiocarcinoma. Semin Liver Dis. 2004;24:115‐125. [DOI] [PubMed] [Google Scholar]
- 2. Bridgewater J, Galle PR, Khan SA, et al. Guidelines for the diagnosis and management of intrahepatic cholangiocarcinoma. J Hepatol. 2014;60:1268‐1289. [DOI] [PubMed] [Google Scholar]
- 3. Fabrega‐Foster K, Ghasabeh MA, Pawlik TM, et al. Multimodality imaging of intrahepatic cholangiocarcinoma. Hepatobiliary Surg Nutr. 2017;6:67‐78. [DOI] [PMC free article] [PubMed] [Google Scholar]
- 4. Mavros MN, Economopoulos KP, Alexiou VG, et al. Treatment and prognosis for patients with intrahepatic cholangiocarcinoma: systematic review and meta‐analysis. JAMA Surg. 2014;149:565‐574. [DOI] [PubMed] [Google Scholar]
- 5. Maithel SK, Gamblin TC, Kamel I, et al. Multidisciplinary approaches to intrahepatic cholangiocarcinoma. Cancer. 2013;119:3929‐3942. [DOI] [PubMed] [Google Scholar]
- 6. Morise Z, Sugioka A, Tokoro T, et al. Surgery and chemotherapy for intrahepatic cholangiocarcinoma. World J Hepatol. 2010;2:58‐64. [DOI] [PMC free article] [PubMed] [Google Scholar]
- 7. Skipworth JR, Keane MG, Pereira SP. Update on the management of cholangiocarcinoma. Dig Dis. 2014;32:570‐578. [DOI] [PMC free article] [PubMed] [Google Scholar]
- 8. Fabris L, Cadamuro M, Moserle L, et al. Nuclear expression of S100A4 calcium‐binding protein increases cholangiocarcinoma invasiveness and metastasization. Hepatology. 2011;54:890‐899. [DOI] [PMC free article] [PubMed] [Google Scholar]
- 9. Schreiber H, Rowley DA. Cancer. Awakening immunity. Science. 2010;330:761‐762. [DOI] [PubMed] [Google Scholar]
- 10. Croci DO, Fluck MFZ, Rico MJ, et al. Dynamic cross‐talk between tumor and immune cells in orchestrating the immunosuppressive network at the tumor microenvironment. Cancer Immunol Immunother. 2007;56:1687‐1700. [DOI] [PMC free article] [PubMed] [Google Scholar]
- 11. Collison LW, Chaturvedi V, Henderson AL, et al. IL‐35‐mediated induction of a potent regulatory T cell population. Nat Immunol. 2010;11:1093‐1101. [DOI] [PMC free article] [PubMed] [Google Scholar]
- 12. Chaturvedi V, Collison LW, Guy CS, et al. Cutting edge: human regulatory T cells require IL‐35 to mediate suppression and infectious tolerance. J Immunol. 2011;186:6661‐6666. [DOI] [PMC free article] [PubMed] [Google Scholar] [Retracted]
- 13. Collison LW, Workman CJ, Kuo TT, et al. The inhibitory cytokine IL‐35 contributes to regulatory T‐cell function. Nature. 2007;450:566‐569. [DOI] [PubMed] [Google Scholar]
- 14. Pylayeva‐Gupta Y, Das S, Handler JS, et al. IL35‐producing B cells promote the development of pancreatic neoplasia. Cancer Discov. 2016;6:247‐255. [DOI] [PMC free article] [PubMed] [Google Scholar]
- 15. Collison LW, Delgoffe GM, Guy CS, et al. The composition and signaling of the IL‐35 receptor are unconventional. Nat Immunol. 2012;13:290‐299. [DOI] [PMC free article] [PubMed] [Google Scholar]
- 16. Olson BM, Sullivan JA, Burlingham WJ. Interleukin 35: a key mediator of suppression and the propagation of infectious tolerance. Front Immunol. 2013;4:315. [DOI] [PMC free article] [PubMed] [Google Scholar]
- 17. Li X, Mai J, Virtue A, et al. IL‐35 is a novel responsive anti‐inflammatory cytokine–a new system of categorizing anti‐inflammatory cytokines. PLoS ONE. 2012;7:e33628. [DOI] [PMC free article] [PubMed] [Google Scholar]
- 18. Zeng JC, Zhang Z, Li TY, et al. Assessing the role of IL‐35 in colorectal cancer progression and prognosis. Int J Clin Exp Pathol. 2013;6:1806‐1816. [PMC free article] [PubMed] [Google Scholar]
- 19. Huang C, Li N, Li Z, et al. Tumour‐derived Interleukin 35 promotes pancreatic ductal adenocarcinoma cell extravasation and metastasis by inducing ICAM1 expression. Nat Commun. 2017;8:14035. [DOI] [PMC free article] [PubMed] [Google Scholar]
- 20. Fu YP, Yi Y, Cai XY, et al. Overexpression of interleukin‐35 associates with hepatocellular carcinoma aggressiveness and recurrence after curative resection. Br J Cancer. 2016;114:767‐776. [DOI] [PMC free article] [PubMed] [Google Scholar]
- 21. Nicholl MB, Ledgewood CL, Chen X, et al. IL‐35 promotes pancreas cancer growth through enhancement of proliferation and inhibition of apoptosis: evidence for a role as an autocrine growth factor. Cytokine. 2014;70:126‐133. [DOI] [PubMed] [Google Scholar]
- 22. International Bladder Cancer Nomogram Consortium ; Bochner BH, Kattan MW, Vora KC. Postoperative nomogram predicting risk of recurrence after radical cystectomy for bladder cancer. J Clin Oncol. 2006;24:3967‐3972. [DOI] [PubMed] [Google Scholar]
- 23. Huang XY, Ke AW, Shi GM, et al. Overexpression of CD151 as an adverse marker for intrahepatic cholangiocarcinoma patients. Cancer. 2010;116:5440‐5451. [DOI] [PubMed] [Google Scholar]
- 24. Wittekind C. Pitfalls in the classification of liver tumors. Der Pathologe. 2006;27:289‐293. [DOI] [PubMed] [Google Scholar]
- 25. Torhorst J, Bucher C, Kononen J, et al. Tissue microarrays for rapid linking of molecular changes to clinical endpoints. Am J Pathol. 2001;159:2249‐2256. [DOI] [PMC free article] [PubMed] [Google Scholar]
- 26. Gao Q, Wang XY, Qiu SJ, et al. Overexpression of PD‐L1 significantly associates with tumor aggressiveness and postoperative recurrence in human hepatocellular carcinoma. Clin Cancer Res. 2009;15:971‐979. [DOI] [PubMed] [Google Scholar]
- 27. Liu L, Lin C, Liang W, et al. TBL1XR1 promotes lymphangiogenesis and lymphatic metastasis in esophageal squamous cell carcinoma. Gut. 2015;64:26‐36. [DOI] [PubMed] [Google Scholar]
- 28. Wang Y, Li J, Xia Y, et al. Prognostic nomogram for intrahepatic cholangiocarcinoma after partial hepatectomy. J Clin Oncol. 2013;31:1188‐1195. [DOI] [PubMed] [Google Scholar]
- 29. Huitzil‐Melendez FD, Capanu M, O'Reilly EM, et al. Advanced hepatocellular carcinoma: which staging systems best predict prognosis? J Clin Oncol. 2010;28:2889‐2895. [DOI] [PMC free article] [PubMed] [Google Scholar]
- 30. Vickers AJ, Elkin EB. Decision curve analysis: a novel method for evaluating prediction models. Med Decis Making. 2006;26:565‐574. [DOI] [PMC free article] [PubMed] [Google Scholar]
- 31. Steyerberg EW, Vickers AJ. Decision curve analysis: a discussion. Med Decis Making. 2008;28:146‐149. [DOI] [PMC free article] [PubMed] [Google Scholar]
- 32. Sternberg CN. Are nomograms better than currently available stage groupings for bladder cancer? J Clin Oncol. 2006;24:3819‐3820. [DOI] [PubMed] [Google Scholar]
- 33. Touijer K, Scardino PT. Nomograms for staging, prognosis, and predicting treatment outcomes. Cancer. 2009;115:3107‐3111. [DOI] [PubMed] [Google Scholar]
- 34. Wang Z, Liu JQ, Liu Z, et al. Tumor‐derived IL‐35 promotes tumor growth by enhancing myeloid cell accumulation and angiogenesis. J Immunol. 2013;190:2415‐2423. [DOI] [PMC free article] [PubMed] [Google Scholar]
- 35. Qiu X, Wang X, Song Y, et al. Plasma Level of Interleukin‐35 as an Independent Prognostic Indicator in Hepatocellular Carcinoma. Dig Dis Sci. 2016;61:3513‐3521. [DOI] [PubMed] [Google Scholar]
- 36. Zhou C, Zhang J, Chen Y, et al. Interleukin‐35 as a predictor of prostate cancer in patients undergoing initial prostate biopsy. Onco Targets Ther. 2017;10:3485‐3491. [DOI] [PMC free article] [PubMed] [Google Scholar]
Associated Data
This section collects any data citations, data availability statements, or supplementary materials included in this article.
Supplementary Materials