

Abstract
Background
Gaucher disease is characterized by the activation of splenic and hepatic macrophages, accompanied by dramatically increased levels of angiotensin-converting enzyme (ACE). To evaluate the source of the elevated blood ACE, we performed complete ACE phenotyping using blood, spleen and liver samples from patients with Gaucher disease and controls.
Methods
ACE phenotyping included 1) immunohistochemical staining for ACE; 2) measuring ACE activity with two substrates (HHL and ZPHL); 3) calculating the ratio of the rates of substrate hydrolysis (ZPHL/HHL ratio); 4) assessing the conformational fingerprint of ACE by evaluating the pattern of binding of monoclonal antibodies to 16 different ACE epitopes.
Results
We show that in patients with Gaucher disease, the dramatically increased levels of ACE originate from activated splenic and/or hepatic macrophages (Gaucher cells), and that both its conformational fingerprint and kinetic characteristics (ZPHL/HHL ratio) differ from controls and from patients with sarcoid granulomas. Furthermore, normal spleen was found to produce high levels of endogenous ACE inhibitors and a novel, tightly-bound 10–30 kDa ACE effector which is deficient in Gaucher spleen.
Conclusions
The conformation of ACE is tissue-specific. In Gaucher disease, ACE produced by activated splenic macrophages differs from that in hepatic macrophages, as well as from macrophages and dendritic cells in sarcoid granulomas. The observed differences are likely due to altered ACE glycosylation or sialylation in these diseased organs. The conformational differences in ACE may serve as a specific biomarker for Gaucher disease.
Keywords: angiotensin I-converting enzyme, Gaucher disease, CD143, monoclonal antibodies, conformation, tissue specificity, ACE inhibitors
1. INTRODUCTION
The lysosomal storage disorder Gaucher disease (Mendelian Inheritance in Man, OMIM #230800) results from the recessively inherited deficiency of lysosomal glucocerebrosidase (GCase, EC 3.2.1.45), caused by mutations in the gene GBA1 (MIM# 606463) located on chromosome 1q21. The enzymatic deficiency causes accumulation of the substrates glucosylceramide and glucosylsphingosine, primarily in cells of the reticuloendothelial system. Histologically, the disorder is characterized by the presence of lipid-laden Gaucher macrophages (Gaucher cells) in the spleen, liver, and bone marrow. These cells are believed to be primarily responsible for the visceral, hematologic, and bone pathology in affected individuals [1–2].
There are both non-neuronopathic (type 1) and neuronopathic (types 2 and 3) forms of Gaucher disease. Patients present with vast phenotypic heterogeneity, ranging from asymptomatic adults to early lethality. Enzyme Replacement Therapy and Substrate Reduction Therapy are effective in reversing disease manifestations in non-neuronopathic Gaucher disease, although response to therapy differs between patients and even siblings. There are over 300 known mutations in GBA1, with certain relevant genotype-phenotype associations, but in many cases, genotype cannot be used to predict prognosis or the response to therapy [3]. Because of this variability in phenotypes, there is a great need for biomarkers that might correlate with prognosis [4].
Several blood biomarkers have been identified for the biochemical monitoring of Gaucher disease [5]. Three of those most commonly used to reflect disease activity are chitotriosidase [6], angiotensin I-converting enzyme and acid phosphatase – reviewed in [7]. Furthermore, studies in blood from patients with Gaucher disease also demonstrate more than 10-fold elevation in chemokines PARC/CCL18 [8] and macrophage inflammatory proteins (MIP)-1-α and MIP-1-β [9]. Most recently glucosylsphingosine was reported as a biomarker closely correlating with disease activity [10].
Of these markers, angiotensin I-converting enzyme (ACE, CD143, EC 3.4.15.1), a Zn2+ carboxydipeptidase with two catalytic centers [11], is a key regulator of blood pressure, and also participates in the development of vascular pathology and remodeling [12–13]. The somatic isoform of ACE is highly expressed as a type-I membrane glycoprotein in endothelial [14–15], epithelial and neuroepithelial cells [16–17], as well as in immune cells including macrophages and dendritic cells [18–19]. ACE is also known as CD143 [20–21].
In addition to membrane-bound ACE, a variable amount of soluble ACE lacking the transmembrane domain is present in blood and other biological fluids [22]. In a healthy individual, ACE found in blood originates primarily from the vast pulmonary microvasculature, which exhibits 100% ACE expression, compared to capillaries in the systemic circulation, which are 10–15% ACE-positive [15]. ACE enters the circulation via proteolytic treatment (shedding) from the endothelial cell surface by a yet unidentified ACE secretase [23]. In healthy individuals, the level of ACE in the blood is stable [24], whereas it is increased, 3–5-fold, in blood of subjects with sarcoidosis [25] or Gaucher disease [26–27], and it has been used as a clinical biomarker of disease severity [28–29].
A panel of 16 monoclonal antibodies (mAbs) has been developed that recognize different conformational epitopes on human ACE [30–32]. It has been shown that the pattern of mAb binding to ACE is a very sensitive marker of local ACE conformation. This pattern, known as the “conformational fingerprint of ACE”, reflects changes in the epitopes for the distinct mAbs, due to partial denaturation of the ACE globule, chemical modification, inhibitor binding, mutations, and different glycosylation/deglycosylation patterns [33–36]. Moreover, it was previously shown that this conformational fingerprint may detect conformationally changed ACE derived from different cell/tissue origins, including ACE from macrophages/dendritic cells [33], epithelial cells [35] or heart [37], versus ACE from lung endothelial cells. In disease states, such as sarcoidosis [33] or uremia [34], an altered ACE conformational fingerprint is observed.
Here we report alterations in the ACE conformation in plasma, spleen and liver of patients with Gaucher disease, demonstrating that the local ACE conformation is both tissue and disease specific, and may serve as biomarker of pathology. Based on our analyses of conformational fingerprints of tissue and plasma ACE under normal and disease conditions, we conclude that the excessive ACE seen in the blood of patients with Gaucher disease originates from both splenic and hepatic macrophages. Moreover, ACE phenotyping of blood and spleen samples revealed ACE effectors which bind to ACE and change its conformation and kinetic properties. One of these, a novel, tightly-bound ACE effector, preferentially found in the spleen, was absent in spleens from patients with Gaucher disease.
2. METHODS
2.1. Study participants
This non-interventional pilot study was approved by the Institutional Review Boards of the University of Illinois at Chicago (USA) and the Research Center of Medical Genetics (Moscow, Russia). All procedures were carried out in accordance with institutional guidelines with appropriate written informed consent. Heparinized or citrated plasma samples, spleen samples collected during splenectomy, and postmortem spleen, liver, kidney and lung samples were used to determine ACE activity and for immunochemical characterization of ACE. Anonymized samples from subjects collected with informed consent under a natural history protocol at the National Human Genome Research Institute of the National Institutes of Health (USA) were also included.
2.2. Immunohistochemistry
Paraffin-embedded spleen tissues from patients with Gaucher disease and controls were sectioned at 2 to 4 μm, mounted on super-plan slides (Superfrost, Menzel-Gläser, Braunschweig, Germany) and dried overnight at 37°C. Microwave treatment was performed in 0.01 M citrate buffer, pH 6.0, as previously described [38]. The mAbs to ACE (CD143), clone CG2 [30]) from BMA Biomedicals (Augst, Switzerland), and mAbs to macrophage marker, CD68, clone KP1 (Dako Cytomation, Hamburg, Germany), were used at concentrations of 5 μg/ml and 7.6 μg/ml, respectively, in Tris-HCl buffer, pH 7.4, and incubated on slides for 30 min at room temperature. Slides without the primary mAb served as negative controls. Immunohistochemistry was performed using the Dako Real™ Detection System with standardized reagents per the manufacturer’s protocol.
2.3. ACE activity assay
ACE activity in plasma, in spleen, liver or lung homogenates and in culture medium from ACE-expressing cells (as an example of recombinant human ACE) was measured using a fluorometric assay with two ACE substrates, 2 mM Z-Phe-His-Leu (ZPHL) or 5 mM Hip-His-Leu (HHL) [30]. Briefly, 20–40 μl aliquots of samples were added to 200 μl of ACE substrate and incubated for the appropriate time at 37°C. The His-Leu product was quantified by complexing with o-phtaldialdehyde.
2.4. Isolation and cultivation of ACE-expressing cells
A plasmid containing the full-length somatic ACE cDNA, but without a transmembrane anchor, WTΔ [39], kindly provided by Dr. F. Alhenc-Gelas (then INSERM Unit 352, Paris, France), was stably expressed in CHO cells (ATCC, Manassas, VA) using Plus Reagent (Invitrogen Corp., Carlsbad, CA) as described [40]. Culture medium (Ultra-CHO, Cambrex Bioscience Walkersville, Inc., Walkersville, MD) was collected as a source of soluble ACE.
2.5. ACE purification
Seminal fluid was kindly provided by Dr. V.V. Evdokimov (N.A. Lopatkin Research Institute of Urology and Interventional Radiology, Moscow, Russia) and used as a source of somatic ACE. ACE was purified by lisinopril affinity chromatography as in [41]. Purified ACE preparations were confirmed to be homogeneous by electrophoresis on 7.5 % SDS-PAGE gels. ACE purification from lung and spleen homogenates was performed similarly.
2.6 Immunological characterization of ACE (Plate immunoprecipitation assay)
Ninety-six-well plates (Corning, Corning, NY), coated with 16 anti-ACE mAbs via a goat anti-mouse IgG (Pierce, Rockford, IL) bridge, were incubated with the tested ACEs. Plate-bound ACE activity was measured with substrate for ACE (Z-Phe-His-Leu), added directly to the wells [33, 42].
2.7. Dialysis and filtration of human plasma and spleen and lung homogenates
Dialysis of the human spleen and lung homogenates and plasma was performed in 10 kDa dialysis cassettes (Pierce, Rockford, IL) against 50 mM phosphate buffer, pH 7.5, containing 150 mM NaCl and 1 μM ZnCl2, at 4°C. Filtration of the homogenates and plasma was performed on Vivaspin filtration membranes (GE Healthcare, Sartorius Corp., Bohemia, NY) with 3, 10, 30 and 100 kDa limits at 12 000g.
2.8. Statistical analysis
Data collected from the different patient groups were analyzed using the Mann-Whitney test with STATISTICA 6 (StatSoft, Inc., OK) in 3–4 independent experiments.
3. RESULTS AND DISCUSSION
3.1. Immunohistochemical detection of ACE in Gaucher spleen
We performed immunostaining of spleen samples from three patients with Gaucher disease and spleen from patients with unrelated diseases using anti-ACE mAb CG2 and anti-CD68 (macrophage marker) mAb KP1 (Fig. 1). Previously, large amounts of ACE were observed within the cytoplasm of splenic Gaucher cells by immunofluorescence, while levels in other cells were considered negligible [43]. Here, we found that ACE in normal spleen is present in endothelial cells of terminal trabecular arteries, central arterioles, marginal zone sinuses and arterioles of the red pulp, while negligible ACE expression was seen in immune cells Representative staining demonstrated that Gaucher cells express a huge amount of ACE, confirming previous results [43]. ACE in splenic Gaucher cells is seen in the cytoplasm and on the cell membrane. While immunostaining for the tissue macrophage-specific protein CD68 appeared homogenous in all Gaucher cells, immunostaining for ACE was heterogeneous, with either low, medium or high amounts of ACE (Fig. 1).
Figure 1. ACE expression in Gaucher spleen.
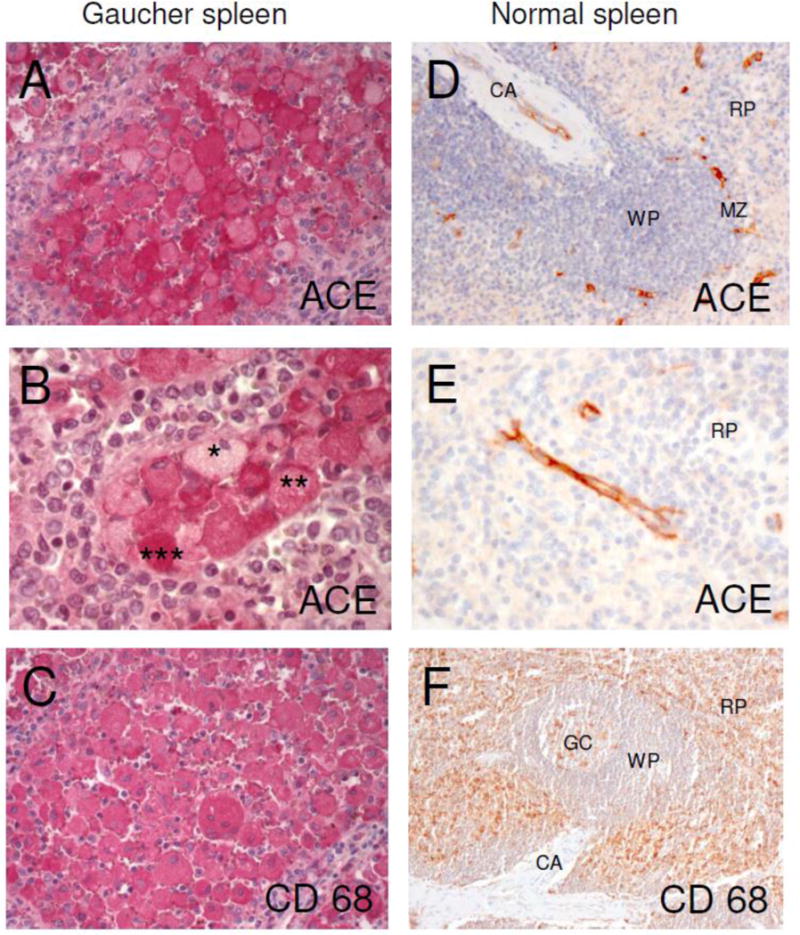
Serial sections of paraffin-embedded sections of Gaucher and control spleen were stained with mAb CG2 to human ACE and with mAb KP1 to human CD68. ACE expression and localization are shown in red.
A: ACE in splenic Gaucher cells. ACE is seen in the cytoplasm and on the cell membrane. mAb CG2, original magnification ×20.
B: ACE is expressed heterogeneously in splenic Gaucher cells. A few Gaucher cells show a low (*) amount of ACE, most cells present a moderate (**) amount of ACE and some Gaucher cells show very strong (***) ACE expression. mAb CG2, original magnification ×40.
C: Serial section of tissue shown in A. The macrophage marker CD68 is expressed homogenously in splenic Gaucher cells. mAb KP1, original magnification ×20.
D: ACE in control spleen is present only in endothelial cells of terminal trabecular arteries, central arterioles (CA), marginal zone (MZ) sinuses and arterioles of the red pulp. mAb CG2, original magnification ×20.
E: ACE in endothelial cells of arterioles of the red pulp (RP) in control spleen. mAb CG2, original magnification ×40.
F: CD68 in control spleen is predominantly found in macrophages of the red pulp (RP). A few macrophages are stained within the germinal center (GC) of the white pulp (WP). CA, central arteriole. mAb KP1, original magnification ×10.
3.2. ACE phenotype in Gaucher plasma
ACE activity in heparinized plasma was determined using two synthetic substrates-Hip-His-Leu (HHL) and Z-Phe-His-Leu (ZPHL). We found that in two independent cohorts (collected in 2008 and in 2016) ACE activity in plasma of patients with Gaucher disease (totally from 19 patients-mostly type I), was dramatically increased compared to the ACE activity in plasma of 25 unrelated patients from the pulmonology clinic. Fig. 2A demonstrates that ACE activity in plasma in a representative cohort of 10 patients with Gaucher disease was 3–10 fold higher (mean-5-fold) than the mean value for 7 unrelated control individuals (30.3 ± 5.2 mU/ml with ZPHL as a substrate), in agreement with previous observations [26–27]. ACE activity in plasma from both patient groups was fully inhibited by the ACE inhibitor enalaprilat (not shown). Thus, this activity could not be attributed to the action of other peptidases. Of note, the ACE activity in plasma from two patients undergoing enzyme replacement therapy was lower (increased only about 2-fold, data not shown). In addition to measuring ACE activity, we quantified the amount of ACE immunoreactive protein (using precipitation of ACE by mAbs), and found that ACE levels were also dramatically increased in the plasma from patients with Gaucher disease (not shown).
Figure 2. ACE activity in Gaucher plasma.
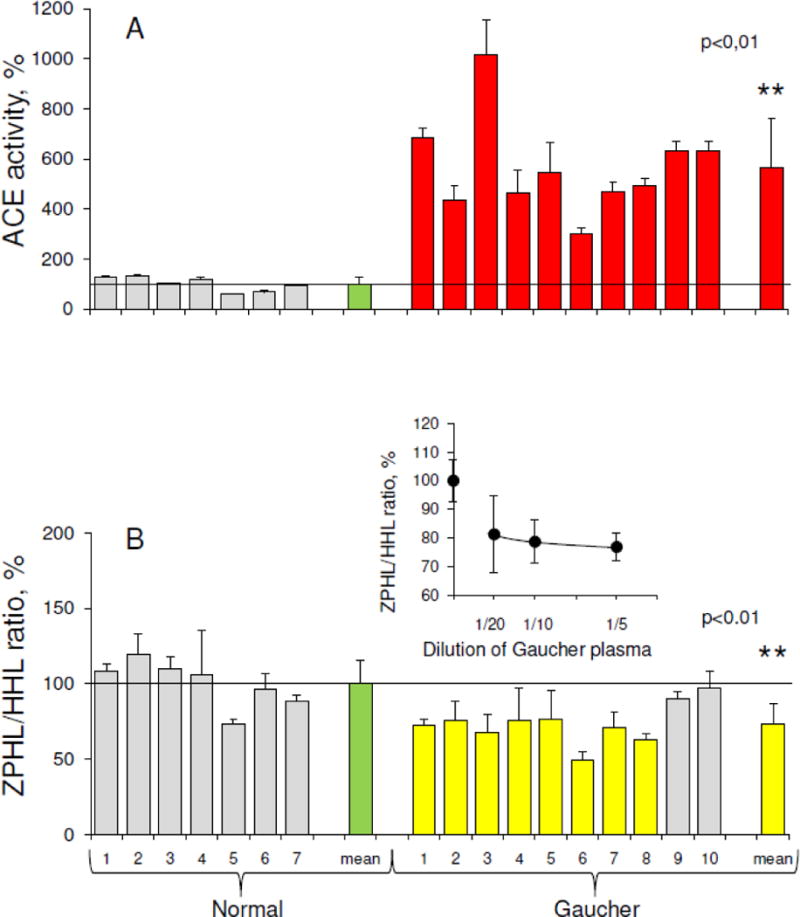
ACE activity in 10 plasma samples from patients with Gaucher disease (shown on right) and 7 unrelated controls (left) was quantified using a spectrofluorometric assay with HHL (5 mM) and ZPHL (2 mM) as substrates.
A. Data is expressed as % of individual ACE activity from mean value for normal patients (30.3 mU/ml with ZPHL). Bars highlighted in red are samples with ACE activity 2-fold higher than mean for healthy controls (shown in green).
B. Ratio of the rate of the hydrolysis of two substrates (ZPHL/HHL ratio) in the tested samples. Data is expressed as % of individual ZPHL/HHL ratio from mean control value (green). Bars highlighted in yellow are samples with ZPHL/HHL ratios 20% less than mean. ** p<0.01 indicates significantly different ZPHL/HHL ratio in the disease and in normal conditions.
Insert. ZPHL/HHL ratio for Gaucher plasma ACE (mean of 3) at different plasma dilutions presented as % of corresponding value for control samples (mean of 5).
Fig. 2B shows the ratio of the rates of the hydrolysis of the two ACE substrates, ZPHL and HHL. The two domains of ACE hydrolyze a range of natural and synthetic substrates, but with different efficiencies [44–47]. The substrates, ZPHL and HHL, are used to determine ACE activity in laboratories worldwide, mostly at fixed concentrations of 2 mM and 5 mM, respectively, at pH 8.3. ACE domains hydrolyze the substrates under these conditions at different rates. HHL is hydrolyzed faster (9-fold) by the C domain of ACE [44], whereas ZPHL is hydrolyzed at similar rates by both domains [30]. As a result, the ratio of the rates of hydrolysis of these two substrates (ZPHL/HHL ratio) is characteristic of a specific ACE form: somatic two-domain human ACE has a ratio of about 1–1.5, N domain about 5–7, and C domain about 0.6–0.8 [48]. The ZPHL/HHL ratio has primarily been used to detect blood levels of common ACE inhibitors taken as drugs [48]. However, this ratio can also be used to detect ACE mutations influencing ACE activity [49], as well as inactivation or inhibition of a specific domain, for an increase in this ratio might reflect inactivation/inhibition of the C domain, while a decrease might indicate the inactivation/inhibition of the N domain [48].
The ZPHL/HHL ratio is a rather uniform parameter for native ACE in normal plasma, and is characterized by very low inter-individual variability with standard deviations (SD) of only about 3–5% [34,48], while ACE activity determined with a single substrate in control populations varies 3–4-fold, with SDs of ~30% [24,42]. We did not identify any patients with exogenous ACE inhibitors in blood, as the ZPHL/HHL ratios for individual patients were not increased. However, the ZPHL/HHL ratio was significantly lower (p<0.01) in plasma of most patients with Gaucher disease (Fig. 2B), indicating the putative presence of excessive amounts of endogenous ACE inhibitors binding preferably to the N domain of ACE. Alternatively, the lower ZPHL/HHL ratio for ACE in plasma of patients with Gaucher disease could be explained by the production of additional conformationally changed and kinetically different ACE by Gaucher cells. Thus, we determined the ZPHL/HHL ratio at different dilutions in plasma samples from three patients with Gaucher disease and five unrelated controls to determine whether this lower ratio is specific to ACE produced by Gaucher cells. With dilution, the ZPHL/HHL ratio for ACE in Gaucher plasma increased slightly more than that in control plasma (insert in Fig. 2B), indicating the contribution of ACE inhibitors in the plasma of patients with Gaucher disease. However, this ratio in Gaucher plasma was still lower than in control plasma, even at 20-fold dilution (insert in Fig. 2B), which may indicate that other factors impact ACE kinetics in health and disease.
Dialysis of both control and Gaucher plasma using a 10 kDa membrane resulted in an increase in ACE activity with both substrates, ZPHL and HHL. The activity towards ZPHL increased more, also increasing the ratio ZPHL/HHL, indicating that plasma inhibitors preferentially inhibit the ACE N domain (not shown). Filtration of both control and Gaucher plasma on filters with different pore sizes (Fig. 3) also increased ACE activity in both supernatants diluted to the initial volumes (Fig. 3A). The filtrates, collected from undiluted control and Gaucher plasma with 10 kDa and 100 kDa filters, both inhibited the activity of purified ACE, but the filtrate from Gaucher plasma had a greater inhibitory effect (Fig. 3B), confirming the higher content of endogenous inhibitors in plasma in these patients. Since the results using filters with different pore sizes did not differ, the molecular mass of these ACE inhibitors in plasma is likely less than 10 kDa. Thus, in patients with Gaucher disease, there is not only increased ACE activity in blood, but also increased levels of endogenous, easily-dissociating, low-molecular weight (LMW) ACE inhibitors.
Figure 3. Effect of filtrations of Gaucher and normal plasma on ACE activity.
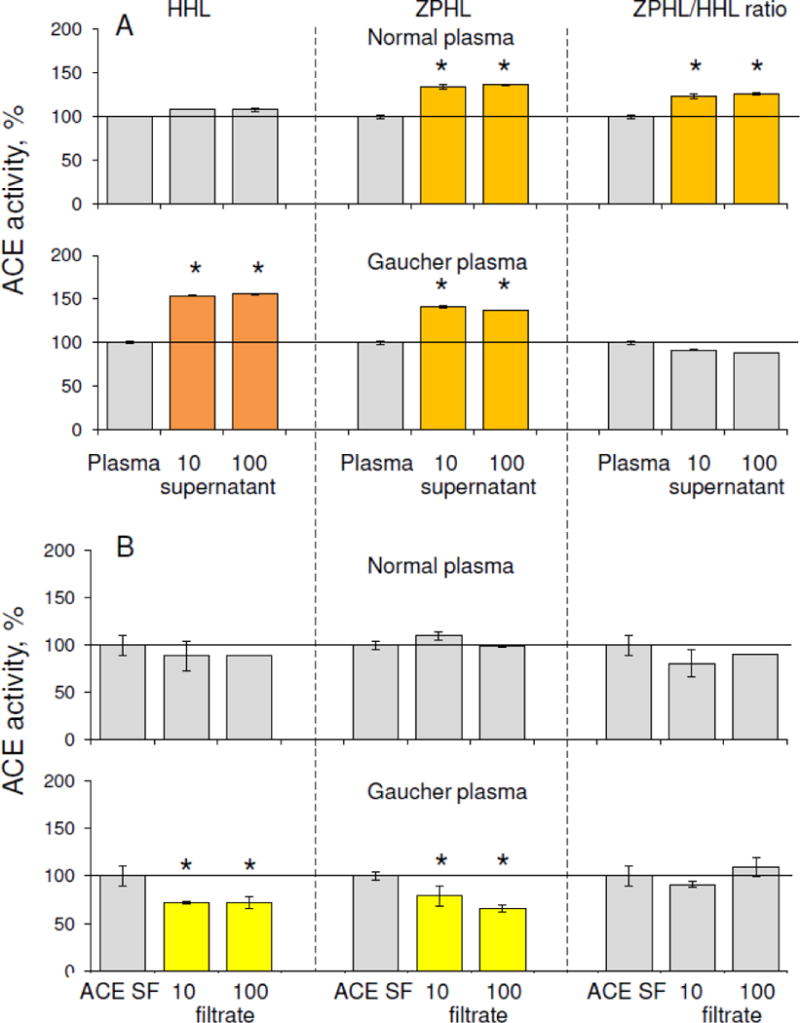
A. ACE activity was measured in plasma from Gaucher patients versus normal plasma with two substrates, ZPHL and HHL, after filtration with 10 and 100 kDa pore filters. Data are expressed as % from control. Each value is a mean of several (2–3) experiments in duplicates. Orange indicates ACE activity > 20% higher than the mean, dark orange indicates > 50% higher than the mean.
B. ACE activity of ACE purified from seminal fluid (ACE SF) was measured after incubation with 95% of filtrates (10 and 100 kDa limits) of control and Gaucher plasma.
Bars in yellow are samples with ACE activity 20% less than mean. Each value is a mean of several (2–3) experiments in duplicates.
* p<0.05 indicates significantly different ACE activity in supernatants obtained as a result of filtration of Gaucher and normal plasma or different activity of pure ACE in the presence of filtrates of Gaucher and normal plasma.
In order to characterize the conformation of plasma ACE in patients with Gaucher disease, we performed conformational fingerprinting of ACE in plasma from ten patients with Gaucher disease and seven controls using a panel of mAbs directed against 16 different epitopes located on the N and C domains of catalytically active human ACE [33]. We previously demonstrated that the pattern of precipitation of ACE activity by this set of mAbs (“conformational fingerprint of ACE”) provides a sensitive tool for the detection of changes in the local conformation of ACE, due to denaturation, inhibition [33–34], mutations [36, 49 and references herein], or cell/tissue of origin [32–33, 35, 37].
We used diluted plasma samples to estimate the binding of mAbs to ACE in order to eliminate putative effects of endogenous ACE inhibitors/effectors [36] on ACE in control and Gaucher plasma. We found that the binding of two mAbs, 3G8 and 6A12, each with epitopes on the N domain of ACE [50–51], and mAb 3F11, with an epitope on the C domain [31], differed significantly in the Gaucher samples, as shown in Fig. 4A. The differences in binding of mAbs 3G8, 6A12 and 3F11 is likely due to different ACE glycosylation at potential N glycosylation sites, Asn82 and/or Asn 25, Asn416 and Asn1162, within the epitopes for these mAbs, respectively [50, 51, 31]. This would result in differences in the local conformations of these epitopes on the surface of ACE produced by Gaucher cells in the spleen and/or liver and lung endothelial cells, which are the main source of ACE in blood under normal conditions, and, therefore, result in different mAbs binding.
Figure 4. Conformational fingerprint of ACE in plasma.
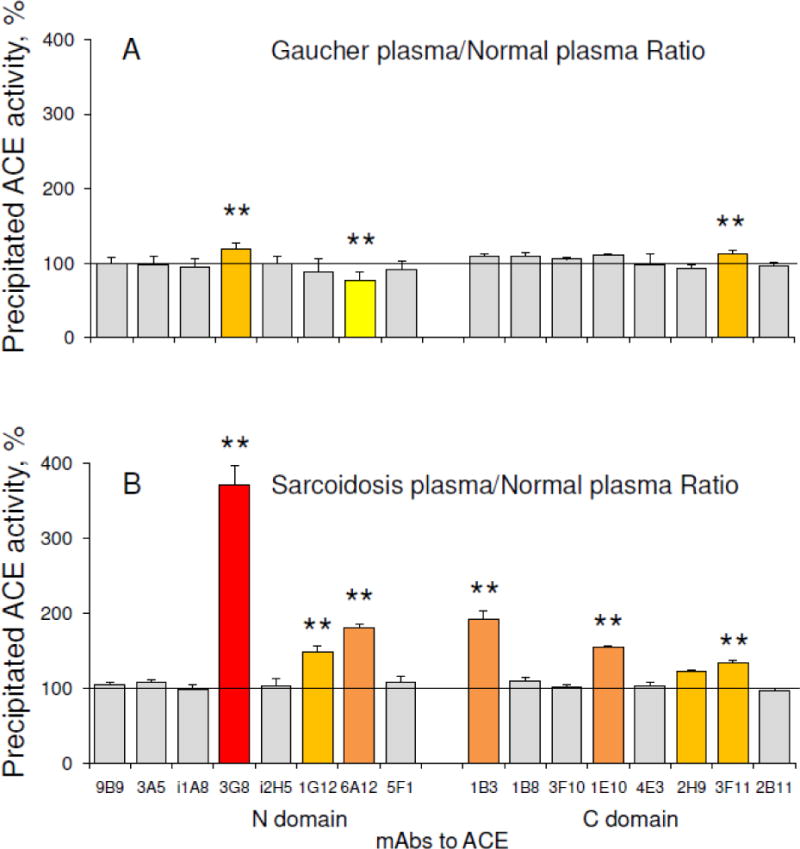
A. Conformational fingerprinting of ACE using sixteen monoclonal antibodies (mAbs) to precipitate ACE from heparinized Gaucher plasma. Immunoprecipitated ACE activity is presented as a normalized value (“binding ratio”) to highlight differences in immunoprecipitation patterns (“conformational fingerprint”) of ACE from different plasma samples. Pools of 10 Gaucher and of 7 control plasmas were used as a representative of each group.
B. Conformational fingerprint of ACE from plasma of patients with sarcoidois versus normal plasma. Pools of 4 plasma from patients with sarcoidosis and 5 controls were used as a representative of each group (adapted from Fig. 7 in [33]).
Data presented is the mean of at least 3 independent experiments in duplicate.
Ratios increased more than 20% are highlighted in orange, more than 50% – in dark orange, more than 100% – in red, while less than 20% – in yellow. * p<0.05 indicates significantly different mAbs binding to ACE from normal plasma and Gaucher/Sarcoidosis plasma.
Of note, the conformational fingerprint of plasma ACE from patients with Gaucher disease (Fig. 4A) differs significantly from that of patients with sarcoidosis – Fig. 4B (data adapted from [33]), which was characterized by significantly changed binding of six mAbs, 3G8, 1G12, and 6A12 to the N domain and 1B3, 1E10 and 3F11 to the C domain of ACE. This finding indicates that the conformation of ACE produced by activated macrophages in spleen and/or liver in Gaucher disease and macrophages/dendritic cells in sarcoid granulomas, may be disease-specific.
3.3. ACE phenotype in Gaucher spleen and liver
We next performed complete ACE phenotyping in human spleen. We estimated ACE activity and kinetic characteristics of ACE (ZPHL/HHL ratio, see 3.2) in spleen homogenate from six Gaucher and five control spleens, and compared these parameters with ACE in homogenates from control lung. The ACE activity in control spleen homogenates was much lower (20-fold) than in similarly prepared lung homogenates. However, activity was dramatically increased (10–12-fold) in spleen samples from patients with Gaucher disease (Fig. 5A), confirming previous studies [27]. Unexpectedly, the ZPHL/HHL ratio for ACE in control spleen homogenates was significantly higher than in lung homogenates or recombinant human soluble ACE (Fig. 5B). However, the ZPHL/HHL ratio for ACE in Gaucher spleen homogenates was remarkably lower than in control spleen, and was closer to that for lung or recombinant ACE (Fig. 5B), suggesting that normal human spleen produces some endogenous ACE inhibitors/effectors [48]. This is supported by the finding that serum ACE activity in splenectomized patients was slightly increased (+17.6%, p<0.02) [52]. However, these inhibitors (or some of them) seem to be deficient in “non-functional” spleen from patients with Gaucher disease.
Figure 5. ACE activity and conformation in Gaucher spleen.
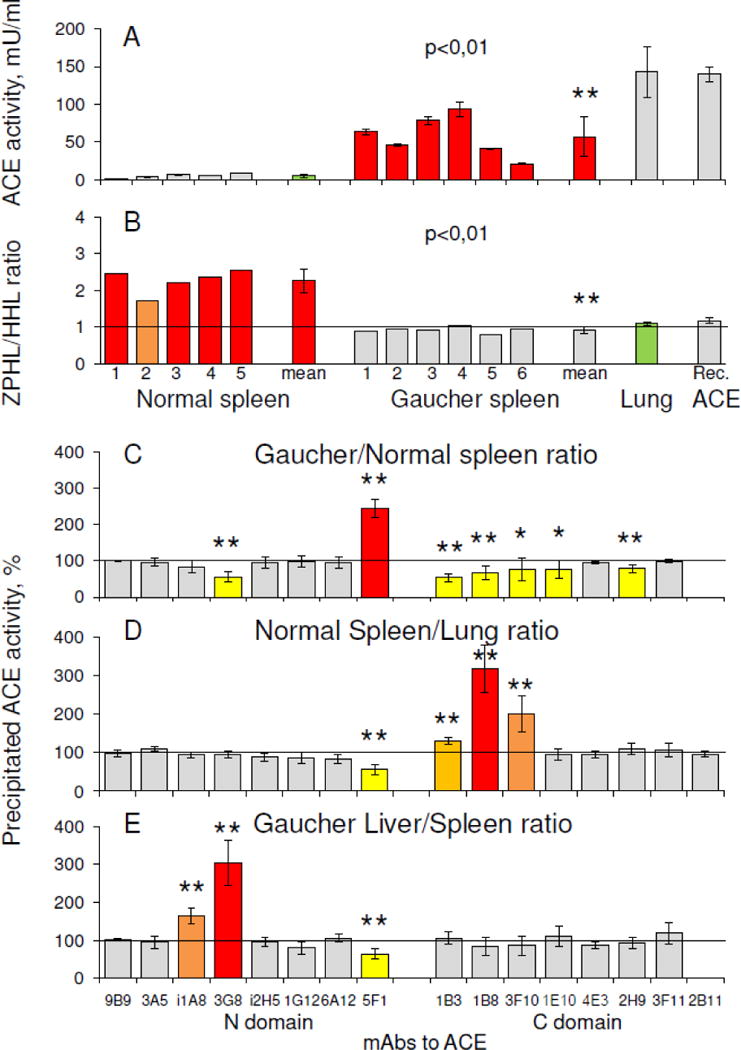
A–B. ACE activity (A-with ZPHL as a substrate), determined on 6 Gaucher and 5 control spleen homogenates (prepared 1:9 (weight: volume), and further diluted 10-fold) and the corresponding ZPHL/HHL ratios (B) compared to 3 control lung homogenates as well as for the culture medium of CHO cells expressing soluble human ACE without transmembrane anchor – WTΔ (57). ** p<0.01 indicates significantly different ACE activity in Gaucher disease and control spleen.
C–E. Conformational fingerprinting of ACE in spleen, lung and liver homogenates. Immunoprecipitated ACE activity is presented as a normalized value – Gaucher/Normal ratio for spleen (C), Control Spleen/Lung ratio (D) and Gaucher Liver/Spleen ratio (E) to highlight differences in immunoprecipitation patterns of ACE from different homogenates. Data is presented as the mean of at least 2–3 independent experiments in duplicate. The colors correspond to those used in Fig. 4. The mean values for control spleen homogenates (A) and lung homogenates (B) are shown in green. ** p<0.01 and * p<0.05. These values indicate significantly different patterns of mAbs binding to ACE in different tissues in Controls and in Gaucher patients.
The differences in conformational fingerprints of ACE in homogenates from different tissues in healthy and diseased states are shown in Fig. 5C–E. The pattern of the binding of mAbs, 3G8 and 5F1 to the N domain and 1B3, 1B8/3F10, 1E10, and 2H9 to the C domain, to ACE in Gaucher spleen samples produced primarily by Gaucher cells, significantly differed from the binding pattern of ACE in control spleen samples (Fig. 5C), where it is produced by only endothelial cells (see Fig.1D–E). This could result from differences in glycosylation at potential glycosylation sites in ACE, specifically, Asn82 and/or Asn 25 in the epitope for mAb 3G8 [50] and Asn117 in the epitope for mAb 5F1 [53] on the N domain, as well as Asn731 within overlapping regions for mAbs 1B8/3F10 and 1B3 and Asn685 in the epitope for mAb 2H9 [31] on the C domain. It should be noted, that the conformation of macrophage ACE in Gaucher spleen also differed from that in macrophage/dendritic cells in sarcoidosis – Fig. 5 in [33].
The conformation of ACE produced by endothelial cells in different control tissues also differed, as reflected in the differences between mAbs 5F1 (to the N domain) and mAbs 1B3/1B8/3F10 (to the C domain) binding to ACE from control spleen and lung (Fig. 5D). This is likely caused by the presence of more sialylated glycans at glycosylation sites Asn117 (5F1) and Asn731 (1B3/1B8/3F10), which are parts of the epitopes for these mAbs, in ACE produced by spleen endothelial cells. These specific mAbs bind differently to plasma and lung ACEs (Fig. S1), as plasma ACE (as well as many other plasma glycoproteins) is known to be more sialylated than its “parent” lung glycoprotein, due to the passage of blood proteins through liver lectins/receptors [54].
Studying liver, we found that ACE activity in homogenates of Gaucher liver was 2-fold higher than that in control liver. When we compared conformational fingerprints of ACE from Gaucher liver and spleen, we found that the binding of mAb 3G8 to liver ACE was much greater than its binding to spleen ACE (Fig. 5E). The binding of this mAb to ACE from control and Gaucher liver, equilibrated by activity, was found to be equal (data not shown), while the binding of this mAb to ACE from control spleen was greater than ACE from Gaucher spleen (Fig. 5C). It was shown previously [50] that recombinant ACE produced in CHO cells in the presence of α-glucosidase-1 inhibitor NB-DNJ, or neuraminidase-treated ACE purified from seminal fluid or blood, i.e. under-glycosylated or under-sialylated enzyme, exhibited increased binding of mAb 3G8. Thus, it is likely that in Gaucher disease, activated splenic (but not hepatic) macrophages produce ACE, which is extra-glycosylated at sites Asn82 and/or Asn25 than ACE produced by normal spleen.
Of note, the differences in conformational fingerprints of ACE in Gaucher spleen and lung (Fig.5 C–D), the primary sources of ACE in blood [15], do not correspond to the differences between ACE fingerprints in Gaucher versus control plasma (Fig. 4A), specifically with respect to the efficacy of mAb 3G8 binding. The excess plasma ACE levels in Gaucher disease could originate not only from splenic Gaucher cells, but also hepatic Gaucher cells [2, 55], as liver ACE binds this very mAb more tightly. Given that ACE activity/amount in human blood is 30 mU/ml (Fig. 2A), in lung is ~1500 mU/g, in normal spleen is ~ 70 mU/g, and in normal liver is ~70 mU/g, and given that there is a 10-fold difference in the mean weights of spleen and liver (150 g versus 1500 g), some estimates can be made. With the 20-fold increase in spleen ACE and 2-fold increase in liver ACE activity/amount in Gaucher disease found in this study, we calculate that the amount of ACE available for shedding into circulation from hepatic Gaucher cells is comparable to that from splenic Gaucher cells.
3.4. Endogenous ACE effectors in human spleen
To establish the presence of putative endogenous ACE inhibitors likely causing abnormally high ZPHL/HHL ratio (Fig. 5B) for ACE in normal human spleen, we estimated the effect of gradual dilution of control spleen homogenates on both an apparent ACE activity and ZPHL/HHL ratio using the two substrates, and compared it to ACE activity in similarly prepared human lung and kidney homogenates, as well as recombinant human ACE. Previously, an increase in apparent ACE activity upon dilution of plasma was considered as evidence of the presence of endogenous ACE inhibitors in the blood [56]. While the activity of recombinant human ACE did not change upon dilution, in all tissue homogenates the apparent ACE activity increased with dilution, indicating the presence of endogenous ACE inhibitors in all tissues. ACE activity in human lung and kidney homogenates had a similar response to dilution and, thus, these tissues likely have similar amounts of inhibitors (Fig. 6A). However, the dependence of ACE activity on the dilution of spleen homogenate was much greater, suggesting that spleen contains much higher concentrations of ACE inhibitors than lung or kidney (Fig. 6A and Fig. S2A–B). The calculated ZPHL/HHL ratios for tested sources of ACE indicated that these ratios did not change upon dilution of recombinant human ACE or ACE from kidney and lung homogenates, but there was a significant decrease of this ratio with dilution of spleen homogenates (Fig. 6B). This suggests the presence of a different set of endogenous ACE inhibitors in normal human spleen compared to lung or kidney. The more than 3-fold higher ZPHL/HHL ratio observed for ACE in undiluted spleen homogenates (Fig. S2C) could be explained either by the presence of high amounts of inhibitors without any domain specificity [43], or by the presence of a spleen-specific endogenous ACE inhibitor/effector which binds preferably to the C domain of ACE.
Figure 6. Effects of dilution and filtration on ACE activity in tissue homogenates.
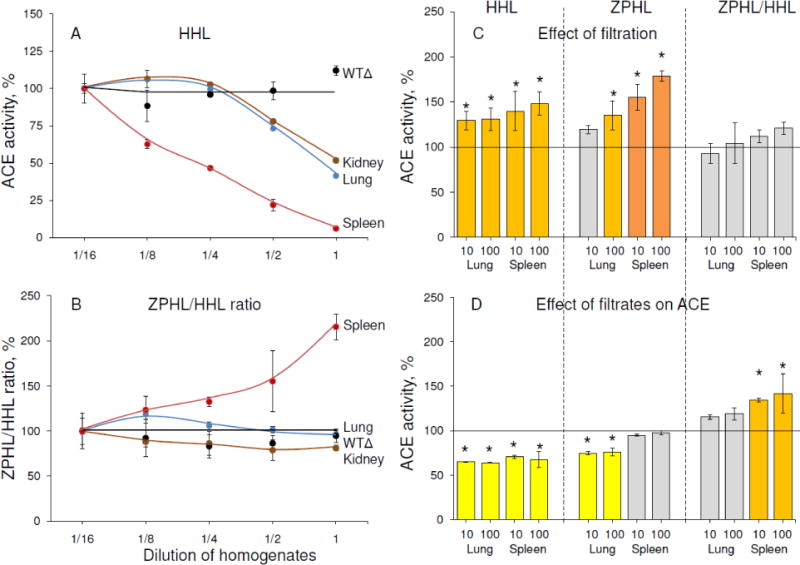
A–B. Apparent ACE activity was measured in the homogenates (1:9, weight: volume) of spleen, lung and kidney from postmortem specimens. Human recombinant ACE from CHO-cells expressing soluble wild-type ACE without transmembrane anchor – WTΔ [39] was used as a negative control. These homogenates (and culture medium with recombinant ACE) were serially diluted and ACE activity determined using two substrates, ZPHL and HHL (A) and the ZPHL/HHL ratio was calculated (B). Data are expressed as % of ACE activity in homogenates diluted 1/16. Each value is the mean of several (2–3) experiments in duplicates.
C. ACE activity was measured in supernatants after filtration of spleen and lung homogenates on filters with different pores (10 and 100 kDa) and reconstituted to the initial volume.
D. ACE activity of purified seminal fluid ACE was determined after incubation with 95% filtrates from spleen and lung homogenates (10 and 100 kDa limit).
Effect of filtration and filtrates was presented as a % from control. Each value is a mean of several (2–3) experiments in duplicates. Bars coloring is as in Fig.4.
* p<0.05 indicates significantly different ACE activity in supernatants obtained as a result of filtration of lung and spleen homogenates or different activity of pure ACE in the presence of filtrates of lung and spleen homogenates.
It was shown previously [47] that the catalytic centers of ACE exhibit strong negative cooperativity, at least in the hydrolysis of synthetic tripeptide substrates like ZPHL and HHL, and in the binding of common inhibitors. In practice, this means that random binding of a ligand to one of the active centers in somatic ACE dramatically decreases the binding of another ligand molecule to the second active center. At fixed concentrations of the two substrates (2 mM ZPHL and 5 mM HHL), and with known kinetic parameters of the hydrolysis of both substrates [48], one can calculate that at an inhibitor concentration equal to the putative inhibition constant, the ZPHL/HHL ratio would equal 1.4; at an inhibitor concentration 10-fold higher, this ratio would be 2.9 and at inhibitor concentrations 100-fold higher, the ZPHL/HHL ratio becomes 4.6. Further increasing the inhibitor concentration up to 1000-fold higher than inhibition constant, however, would not result in a significant increase of the ZPHL/HHL ratio, as it becomes only 5.0. The ZPHL/HHL ratio for ACE in undiluted spleen homogenate is even higher (Fig.S2C), hence it is unlikely that this ratio results from ACE inhibitors alone. Therefore, in addition to large amounts of easily-dissociating ACE inhibitors without domain specificity, normal spleen may contain a spleen-specific endogenous ACE inhibitor/effector, which binds preferentially to the C domain of ACE.
To further demonstrate the presence of endogenous ACE inhibitors in human tissues, we performed filtration of normal spleen and lung homogenates using 10 kDa and 100 kDa filters. The homogenates were concentrated 7–8-fold on filters, the filtrates collected separately, and the supernatants were diluted to the initial volume. This procedure resulted in significantly increased apparent ACE activity in both spleen and lung supernatants (Fig. 6C) using ZPHL and HHL as substrates. However, the increase in spleen ACE activity was more pronounced, confirming that normal spleen likely contains greater amounts of endogenous ACE inhibitors. Filtration of homogenates on 10 and 100 kDa filters did not demonstrate any significant difference, so, most endogenous easily-dissociating ACE inhibitors in spleen and lung likely have a molecular mass less than 10 kDa. The direct inhibiting action of filtrates from tissue homogenates on the activity of purified ACE is demonstrated in Fig. 6D. The characteristics of ACE inhibitors in filtrates from spleen and lung were quite different. Lung filtrates inhibited ACE activity with ZPHL and HHL equally, while spleen filtrates inhibited ACE activity more with HHL than with ZPHL, confirming the possibility of C domain-specific ACE inhibitors/effectors in normal spleen.
Comparing the effect of the extended dilution of homogenates on the ZPHL/HHL ratio (Fig.S2A–C) with the corresponding effect of filtration with different pore size filters and dialysis (Fig.S3A) shows that only dilution of spleen homogenate resulted in a significant decrease in ZPHL/HHL, while filtration and dialysis did not significantly alter this ratio (Fig.S3A). Nevertheless, this parameter still remained significantly higher than the value for the lung ACE, even at 30-fold dilution (Fig. S2C, S3A), suggesting the presence of some tightly binding C-domain-specific ACE effector in spleen, presumably with a molecular mass more than 10 kDa. A higher ZPHL/HHL ratio for spleen ACE (compared to lung ACE) was observed even after precipitation by mAbs (Fig. S3B–C), indicating that the binding of mAbs to ACE did not induce dissociation of this putative ACE effector from spleen ACE.
However, ACE purification by affinity chromatography resulted in a decreased ZPHL/HHL ratio for splenic ACE, which became close to the values for ACE in lung and blood (Fig.S3A). This effect can be attributed to the action of the ACE inhibitor lisinopril, immobilized on the affinity column, which is able to change the conformation of the enzyme thus inducing the dissociation of the ACE effector from its complex with ACE, similar to what is seen with bilirubin and lysozyme [36]. This putative mechanism was confirmed by the experiments in which similarly prepared spleen and lung homogenates were incubated with the ACE inhibitor enalaprilat, filtered on 30 kDa or 100 kDa filters, and, finally, dialyzed to remove enalaprilat. These procedures resulted in significantly increased ACE activity in both spleen and lung homogenates due to the removal of a majority of endogenous ACE inhibitors (Fig.7, Fig.S4). However, ACE activity in spleen homogenate towards HHL as a substrate increased much more than in lung homogenate (Fig.S4), and, unlike in lung, the ZPHL/HHL ratio in spleen homogenate significantly decreased (Fig.7, Fig.S3A, Fig.S4). This experiment demonstrated that common ACE inhibitors cause dissociation of the novel spleen-specific tightly-binding ACE effector from its complex with the enzyme. When 3 kDa and 10 kDa filters were used, changes in the ZPHL/HHL ratio for splenic ACE were not detected (Fig.7), indicating that the molecular mass of this novel ACE effector is likely between 10 and 30 kDa.
Figure 7. The effect of the ACE inhibitor enalaprilat with subsequent filtration on different filters on ACE activity in spleen homogenates.
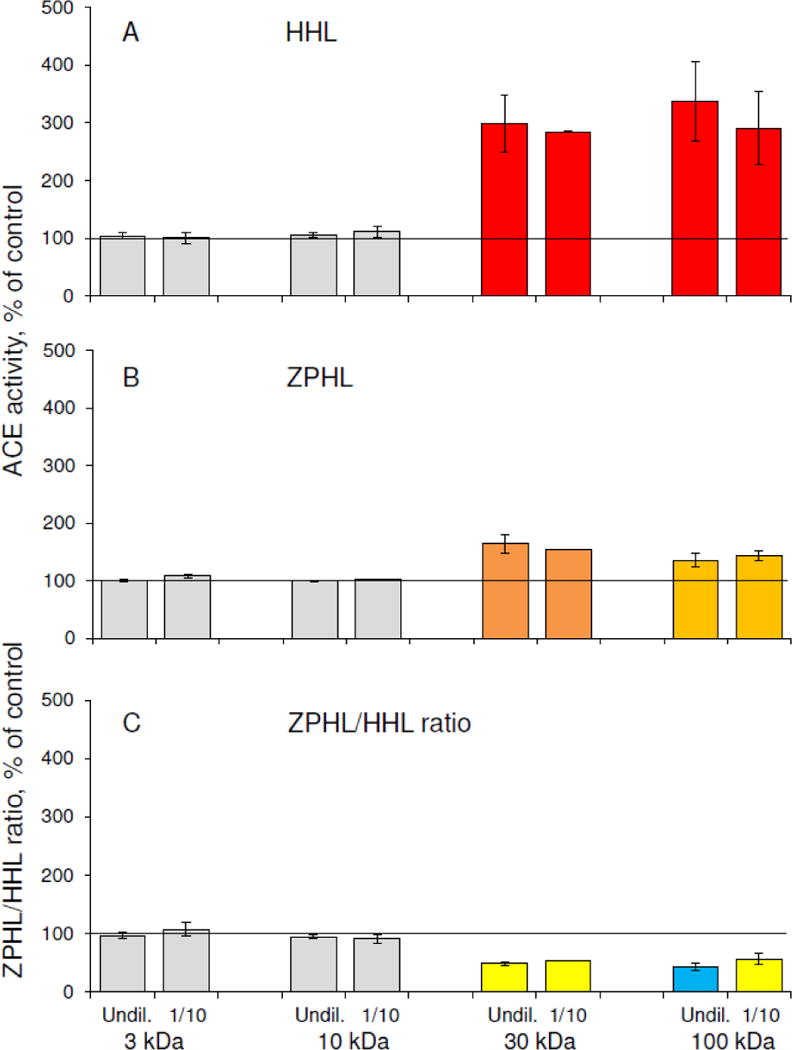
Spleen homogenates were incubated with 1 μM enalaprilat, filtered on 3, 10, 30 or 100 kDa filters and, finally, dialyzed extensively to remove enalaprilat. ACE activity was measured as in the legend to Fig. 2.
A. ACE activity towards substrate HHL.
B. ACE activity towards substrate ZPHL.
C. ZPHL/HHL ratio.
Filtrates of spleen and lung homogenates, as well as plasma, passed through 30 kDa filters, followed by 10 kDa filters to remove low molecular weight compounds, were used to test their ability to inhibit the activity of purified ACE and change the ZPHL/HHL ratio. While filtering plasma did not influence its ACE activity, lung filtrate slightly inhibited ACE activity with HHL and increased the ZPHL/HHL ratio. This effect was more pronounced with spleen filtrate (Fig. S5). However, the ZPHL/HHL ratio in this case did not reach values obtained for undiluted spleen homogenate. It is possible that the putative effector is not stable when not in complex with ACE, or it that is susceptible to the action of accompanying proteinases. Nevertheless, it appears that this effector is more abundant in spleen than in lung or plasma (Fig.S3A, Fig.S5).
Our results indicate that healthy spleen produces a variety of endogenous ACE inhibitors, some with a molecular mass less than 10 kDa, which easily dissociate from the ACE-inhibitor complex upon dilution, filtration or dialysis. However, other easily-dissociating inhibitors have a much higher molecular mass, for simple dilution affected the ZPHL/HHL ratio more than inhibitor depletion by filtration or dialysis. Lastly, it appears that there are ACE inhibitors/effectors in normal spleen with a molecular mass between1 0 to 30 kDa which bind tightly to ACE and dissociate only partially upon dilution. Complete dissociation of this novel putative ACE effector from the ACE-inhibitor complex occurs only on the affinity column with common ACE inhibitors or as a result of ACE treatment with this inhibitor.
Previously, a relatively stable ACE activator was found in the non-protein fraction of human neutrophil lysates [57] and in some bovine tissues [58] with a MW higher than 30 kDa, and some novel effectors were detected in the lysates of leukemic T- and B-cells [59]. Our data suggests that normal human spleen can produce different ACE effectors influencing both ACE activity and conformation.
Homogenates of Gaucher and control spleens were evaluated after both dilution and filtration. The high ZPHL/HHL ratio for ACE decreased upon dilution in control spleen, while the low ZPHL/HHL ratio for ACE in Gaucher spleen homogenate did not change (Fig.8A), supporting our hypothesis that Gaucher spleen does not produce the putative ACE effector. The depletion of LMW compounds from these homogenates using ZEBA columns had no effect on this ratio for ACE in control spleen homogenates, but the ratio was further decreased for ACE in Gaucher spleen homogenate (Fig.8A). This result confirms that some ACE inhibitors/effectors in normal spleen are larger than 7 kDa (limit of LMW depletion via ZEBA columns).
Figure 8. Effect of dilution and filtration on ACE activity in spleen homogenates.
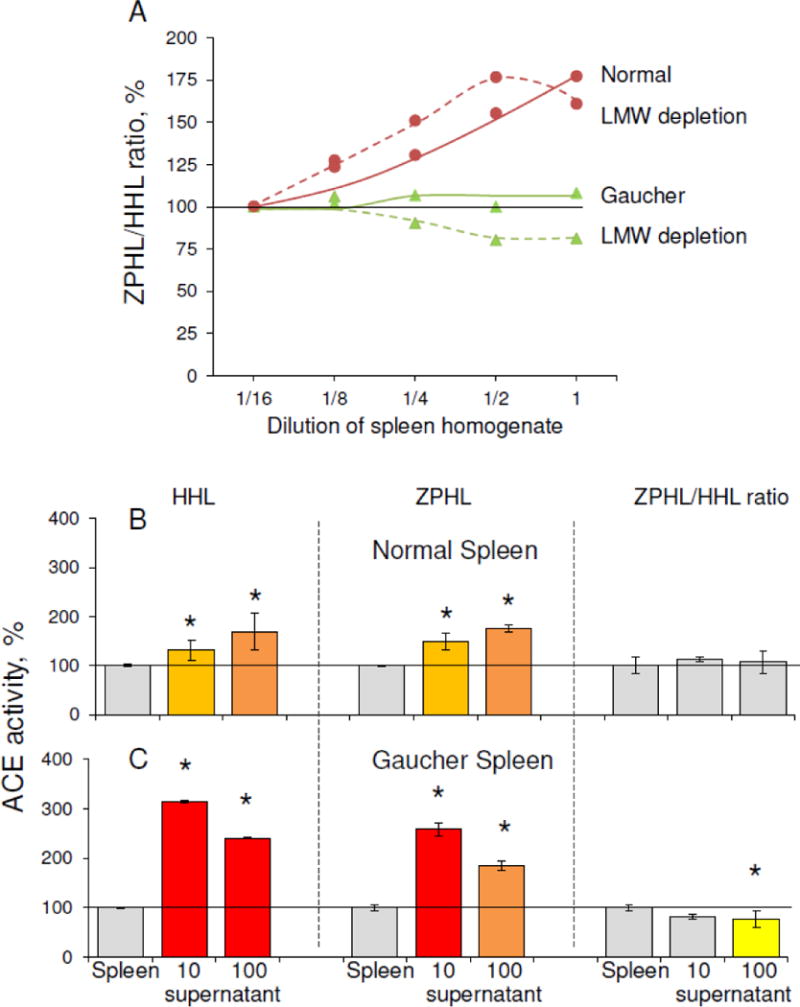
A. Apparent ACE activity was measured in Gaucher and control spleen homogenates at different dilutions using two substrates, ZPHL and HHL (as in Fig. 2), with and without LMW depletion (performed on ZEBA columns with 7000 Da limit). Data are expressed as % of ACE activity in homogenates diluted 1/16. Each value is the mean of several (2–3) experiments in duplicates.
B. ACE activity was measured in the Gaucher and control spleen homogenates after filtration on filters with different pores (10 and 100 kDa limit). Data are expressed as % of control. Each value is the mean of several (2–3) experiments in duplicates. Color key is as in Fig. 4 * p<0.05 indicates significantly different ACE activity in supernatants obtained as a result of filtration of Gaucher and normal spleen.
Filtering both Gaucher and control spleen homogenates through 10 kDa and 100 kDa filters increased the apparent ACE activity and decreased the ZPHL/HHL ratio differently (Fig.8B), confirming the presence of endogenous ACE inhibitors in normal spleen, and indicating that endogenous ACE inhibitors/effectors in normal spleen differ from those in diseased Gaucher spleen. Since filtration had a greater effect on ACE activity in Gaucher than in normal spleen (Fig.8B), it appears that there are more LMW inhibitors in Gaucher spleen and plasma, while normal spleen might contain high molecular weight inhibitor/effector absent in Gaucher spleen (Fig.8A).
4. CONCLUSIONS
ACE phenotyping of plasma and spleen from patients with Gaucher disease revealed that ACE activity and conformation in Gaucher plasma and spleen differs from controls. Moreover, we demonstrated that the conformation of ACE is tissue- and disease- specific, and that the excessive plasma ACE in Gaucher disease likely results from elevated ACE in both splenic and hepatic Gaucher macrophages. Lastly, we identify the presence of high molecular weight endogenous ACE inhibitor/effector in normal spleen, which are absent in Gaucher spleen. Both the conformational and kinetic differences in ACE and the absence of ACE inhibitor/effector might provide insight into disease pathogenesis in Gaucher disease.
Supplementary Material
Acknowledgments
The authors thank Dr. Francois Alhenc-Gelas (then INSERM U367, Paris, France), who kindly provided the plasmid for truncated soluble recombinant human ACE – WTΔ, Dr. Elena Arablinskaya (Institute of Phtiziopulmonology, Moscow, Russia) who kindly provided the control plasma samples, Dr. V.V. Evdokimov (N.A. Lopatkin Research Institute of Urology and Interventional Radiology, Moscow, Russia) who kindly provided seminal fluid and Dr. Klara Valyi-Nagy (University of Illinois at Chicago Tissue Bank), who kindly provided lung and spleen tissues. We also acknowledge the advice of Dr. Sergei Nikitin (Regional Public Organization “Association of Neuromuscular Disorders Specialists”, Moscow, Russia). This work was partly supported by the Ministry of Science and Education of Russian Federation (grants 02.740.11.5036 and 14.Z50.31.0026), and was carried out (partially) within the state assignment of Moscow University (Russia). OG-A, NT and ES were supported by the Intramural Research Programs of the NHGRI and NIH.
ABBREVIATIONS
- ACE
angiotensin-converting enzyme
- mAbs
monoclonal antibodies
- ZPHL
Z-Phe-His-Leu, carbobenzoxy-L-phenylalanyl-L-histidyl-L-leucine
- HHL
Hip-His-Leu, hippuryl-L-histidyl-L-leucine
- CHO cells
Chinese Hamster Ovary cells
- PBS
phosphate buffered saline
- LMW
low molecular weight
- SD
standard deviations
Footnotes
Publisher's Disclaimer: This is a PDF file of an unedited manuscript that has been accepted for publication. As a service to our customers we are providing this early version of the manuscript. The manuscript will undergo copyediting, typesetting, and review of the resulting proof before it is published in its final citable form. Please note that during the production process errors may be discovered which could affect the content, and all legal disclaimers that apply to the journal pertain.
References
- 1.Beutler E, Grabowski GA. The Metabolic and Molecular Bases of Inherited Disease III. McGraw-Hill; New York: 2001. Gaucher Diseases; pp. 3635–3668. [Google Scholar]
- 2.Adar T, Ilan Y, Elstein D, Zimran A. Liver involvement in Gaucher disease – Review and clinical approach. Blood Cells Mol Dis. 2018;68:66–73. doi: 10.1016/j.bcmd.2016.10.001. [DOI] [PubMed] [Google Scholar]
- 3.Hruska KS, LaMarca ME, Scott CR, Sidransky E. Gaucher disease: mutation and polymorphism spectrum in the glucocerebrosidase gene (GBA) Hum Mutat. 2008;29:567–583. doi: 10.1002/humu.20676. [DOI] [PubMed] [Google Scholar]
- 4.Mistry PK, Lopez G, Schiffman R, Barton NW, Weinreb NJ, Sidransky E. Gaucher disease: progress and ongoing challenges. Mol Genet Metab. 2017;120:8–21. doi: 10.1016/j.ymgme.2016.11.006. [DOI] [PMC free article] [PubMed] [Google Scholar]
- 5.Aerts JM, Kallemeijn WW, Wegdam W, Joao Ferraz M, van Breemen MJ, Dekker N, et al. Biomarkers in the diagnosis of lysosomal storage disorders: proteins, lipids, and inhibodies. J Inherit Metab Dis. 2011;34:605–619. doi: 10.1007/s10545-011-9308-6. [DOI] [PMC free article] [PubMed] [Google Scholar]
- 6.Hollak CE, Weely S, Oers MH, Aerts JM. Marked elevation of plasma chitotriosidase activity. A novel hallmark of Gaucher disease. J Clin Invest. 1994;93:1288–1292. doi: 10.1172/JCI117084. [DOI] [PMC free article] [PubMed] [Google Scholar]
- 7.Vellodi A, Foo Y, Cole TJ. Evaluation of three biochemical markers in the monitoring of Gaucher disease. J Inherit Metab Dis. 2005;28:585–592. doi: 10.1007/s10545-005-0585-9. [DOI] [PubMed] [Google Scholar]
- 8.Boot RG, Verhoek M, Fost M, Hollak CE, Maas M, Bleijlevens B, et al. Marked elevation of the chemokine CCL18/PARC in Gaucher disease: a novel surrogate marker for assessing therapeutic intervention. Blood. 2004;103:33–39. doi: 10.1182/blood-2003-05-1612. [DOI] [PubMed] [Google Scholar]
- 9.van Breemen MJ, Fost M, Voerman JS, Laman JD, Boot RG, Maas M, et al. Increased plasma macrophage inflammatory protein (MIP)-1alpha and MIP-1beta levels in type 1 Gaucher disease. Biochim Biophys Acta. 2007;1772:788–796. doi: 10.1016/j.bbadis.2007.04.002. [DOI] [PubMed] [Google Scholar]
- 10.Murugesan V, Chuang WL, Liu J, Lischuk A, Kacena K, Lin H, et al. Glucosylsphingosine is a key biomarker of Gaucher disease. Am J Hematol. 2016;91:1082–1089. doi: 10.1002/ajh.24491. [DOI] [PMC free article] [PubMed] [Google Scholar]
- 11.Soubrier F, Alhenc-Gelas F, Hubert C, Allegrini J, John M, Tregear G, et al. Two putative active centers in human angiotensin I-converting enzyme revealed by molecular cloning. Proc Natl Acad Sci USA. 1988;85:9386–9390. doi: 10.1073/pnas.85.24.9386. [DOI] [PMC free article] [PubMed] [Google Scholar]
- 12.Sturrock ED, Anthony S, Danilov SM. Peptidyl-dipeptidase A/Angiotensin I-converting enzyme. In: Rawlings ND, Salvesen G, editors. Handbook of Proteolytic Enzymes. 3d. Vol. 98. Academic Press; Oxford: 2012. pp. 480–494. [Google Scholar]
- 13.Bernstein KE, Ong FS, Blackwell WL, Shah KH, Giani JF, Gonzalez-Villalobos RA, et al. A modern understanding of the traditional and nontraditional biological functions of angiotensin-converting enzyme. Pharmacol Rev. 2013;65:1–46. doi: 10.1124/pr.112.006809. [DOI] [PMC free article] [PubMed] [Google Scholar]
- 14.Caldwell PR, Seegal BC, Hsu KC, Das H, Soffer RL. Angiotensin-converting enzyme: vascular endothelial localization. Science. 1976;191:1050–1051. doi: 10.1126/science.175444. [DOI] [PubMed] [Google Scholar]
- 15.Metzger R, Franke FF, Bohle RM, Alhenc-Gelas F, Danilov SM. Heterogeneous distribution of Angiotensin I-converting enzyme (CD143) in the human and rat vascular systems: vessels, organs and species specificity. Microvasc Res. 2011;82:206–215. doi: 10.1016/j.mvr.2010.12.003. [DOI] [PubMed] [Google Scholar]
- 16.Defendini R, Zimmerman EA, Weare JA, Alhenc-Gelas F, Erdos EG. Angiotensin-converting enzyme in epithelial and neuroepithelial cells. Neuroendocrinology. 1983;37:32–40. doi: 10.1159/000123512. [DOI] [PubMed] [Google Scholar]
- 17.Hooper NM, Turner AJ. Isolation of two differentially glycosylated forms of peptidyl-dipeptidase A (angiotensin-converting enzyme) from pig brain: a re-evaluation of their role in neuropeptide metabolism. Biochem J. 1987;241:625–633. doi: 10.1042/bj2410625. [DOI] [PMC free article] [PubMed] [Google Scholar]
- 18.Silverstein E, Friedland J, Setton C. Angiotensin-converting enzyme in macrophages and Freund’s adjuvant granuloma. Isr J Med Sci. 1978;14:314–318. [PubMed] [Google Scholar]
- 19.Danilov SM, Sadovnikova E, Scharenbourg N, Balysnikova IV, Svinareva DA, Semikina EL, et al. Angiotensin-converting enzyme (CD143) is abundantly expressed by dendritic cells and discriminates human monocytes-derived dendritic cells from acute myeloid leukemia-derived dendritic cells. Exp Hem. 2003;31:1301–1309. doi: 10.1016/j.exphem.2003.08.018. [DOI] [PubMed] [Google Scholar]
- 20.Danilov SM, Franke FE, Erdos EG. Angiotensin-Converting Enzyme (CD143) In: Kishimoto T, editor. Leucocyte Typing VI: White Cell Differentiation Antigens. Garland Publishing Inc.; New York: 1977. pp. 746–749. [Google Scholar]
- 21.Franke FE, Metzger R, Bohle RM, Kerkman L, Alhenc-Gelas F, Danilov SM. Angiotensin I-Converting Enzyme (CD 143) on endothelial cells in normal and in pathological conditions. In: Kishimoto T, editor. Leucocyte Typing VI: White Cell Differentiation Antigens. Garland Publishing Inc.; New York: 1977. pp. 749–751. [Google Scholar]
- 22.Hooper NM, Keen J, Pappin DJ, Turner AJ. Pig kidney angiotensin converting enzyme. Purification and characterization of amphipathic and hydrophilic forms of the enzyme establishes C-terminal anchorage to the plasma membrane. Biochem J. 1987;247:85–93. doi: 10.1042/bj2470085. [DOI] [PMC free article] [PubMed] [Google Scholar]
- 23.Parkin ET, Turner AJ, Hooper NM. Secretase-mediated cell surface shedding of the angiotensin-converting enzyme. Protein Pept Lett. 2004;11:423–432. doi: 10.2174/0929866043406544. [DOI] [PubMed] [Google Scholar]
- 24.Alhenc-Gelas F, Richard J, Courbon D, Warnet JM, Corvol P. Distribution of plasma angiotensin I-converting enzyme levels in healthy men: Relationship to environmental and hormonal parameters. J Lab Clin Med. 1991;117:33–39. [PubMed] [Google Scholar]
- 25.Lieberman J. Elevation of serum angiotensin-converting enzyme level in sarcoidosis. Am J Med. 1975;59:365–372. doi: 10.1016/0002-9343(75)90395-2. [DOI] [PubMed] [Google Scholar]
- 26.Lieberman J, Beutler E. Elevation of angiotensin-converting enzyme in Gaucher’s disease. N Engl J Med. 1976;294:1442–1444. doi: 10.1056/NEJM197606242942609. [DOI] [PubMed] [Google Scholar]
- 27.Silverstein E, Friedland J. Elevated serum and spleen angiotensin converting enzyme and serum lysozyme in Gaucher’s disease. Clin Chim Acta. 1977;74:21–25. doi: 10.1016/0009-8981(77)90382-5. [DOI] [PubMed] [Google Scholar]
- 28.Romer FK. Clinical and biochemical aspects of sarcoidosis. With special reference to angiotensin-converting enzyme (ACE) Acta Med Scand Suppl. 1984;690:3–96. [PubMed] [Google Scholar]
- 29.Beneteau-Burnat B, Baudin B. Angiotensin-converting enzyme: clinical applications and laboratory investigation in serum and other biological fluids. Crit Rev Clin Lab Sci. 1991;28:337–356. doi: 10.3109/10408369109106868. [DOI] [PubMed] [Google Scholar]
- 30.Danilov S, Jaspard E, Churakova T, Towbin H, Savoie F, Wei L, et al. Structure-function analysis of angiotensin I-converting enzyme using monoclonal antibodies. J Biol Chem. 1994;269:26806–26814. [PubMed] [Google Scholar]
- 31.Naperova IA, Balyasnikova IV, Schwartz DE, Watermeyer J, Sturrock DE, Kost OA, Danilov SM. Mapping of conformational mAb epitopes to the C domain of human angiotensin I-converting enzyme (ACE) J Proteome Res. 2008;7:3396–3411. doi: 10.1021/pr800142w. [DOI] [PubMed] [Google Scholar]
- 32.Danilov SM. Conformational fingerprinting using monoclonal antibodies (on the example of angiotensin I-converting enzyme-ACE) Mol Biol (Mosc) 2017;51:1046–1061. doi: 10.7868/S0026898417060155. [DOI] [PMC free article] [PubMed] [Google Scholar]
- 33.Danilov SM, Balyasnikova IB, Danilova AS, Naperova IA, Arablinskaya E, Borisov SE, et al. Conformational fingerprinting of the angiotensin-converting enzyme (ACE): Application in sarcoidosis. J Proteome Res. 2010;9:5782–5793. doi: 10.1021/pr100564r. [DOI] [PubMed] [Google Scholar]
- 34.Petrov MN, Shilo VY, Tarasov AV, Schwartz DE, Garcia JG, Kost OA, et al. Conformational changes of blood ACE in chronic uremia. PLoS One. 2012;7(11):e49290. doi: 10.1371/journal.pone.0049290. [DOI] [PMC free article] [PubMed] [Google Scholar]
- 35.Kryukova OV, Tikhomirova VE, Golukhova EZ, Evdokimov VV, Kalantarov GF, Trakht IN, et al. Tissue Specificity of human angiotensin I-converting enzyme. PLoS One. 2015;10(11):e0143455. doi: 10.1371/journal.pone.0143455. [DOI] [PMC free article] [PubMed] [Google Scholar]
- 36.Danilov SM, Lünsdorf H, Akinbi HT, Nesterovitch AB, Epshtein Y, Letsiou E, et al. Lysozyme and bilirubin bind to ACE and regulate its conformation and shedding. Sci Rep. 2016;6:34913. doi: 10.1038/srep34913. [DOI] [PMC free article] [PubMed] [Google Scholar]
- 37.Tikhomirova VE, Kost OA, Kryukova OV, Bulaeva NI, Zholbaeva AZ, Garcia JGN, et al. ACE phenotyping in human heart. PLoS One. 2017;12(8):e0181976. doi: 10.1371/journal.pone.0181976. [DOI] [PMC free article] [PubMed] [Google Scholar]
- 38.Metzger R, Bohle RM, Pauls K, Eichner G, Alhenc-Gelas F, Danilov SM, et al. Angiotensin-converting enzyme in non-neoplastic kidney diseases. Kidney Int. 1999;56:1442–1454. doi: 10.1046/j.1523-1755.1999.00660.x. [DOI] [PubMed] [Google Scholar]
- 39.Wei L, Alhenc-Gelas F, Soubrier F, Michaud A, Corvol P, Clauser E. Expression and characterization of recombinant human angiotensin I-converting enzyme. Evidence for a C-terminal transmembrane anchor and for a proteolytic processing of the secreted recombinant and plasma enzymes. J Biol Chem. 1991;266:5540–5546. [PubMed] [Google Scholar]
- 40.Balyasnikova IV, Gavriljuk VD, McDonald TD, Berkowitz R, Miletich DJ, Danilov SM. Antibody-mediated lung endothelium targeting: In vitro model using a cell line expressing angiotensin-converting enzyme. Tumor Targeting. 1999;4:70–83. doi: 10.1038/sj.gt.3301657. [DOI] [Google Scholar]
- 41.Garats EV, Nikolskaya II, Binevski PV, Pozdnev VF, Kost OA. Characterization of bovine atrial angiotensin-converting enzyme. Biochemistry (Mosc) 2001;66:429–434. doi: 10.1023/a:1010205614096. [DOI] [PubMed] [Google Scholar]
- 42.Danilov S, Savoie F, Lenoir B, Jeunemaitre X, Azizi M, Tarnow L, et al. Development of enzyme-linked immunoassays for human angiotensin I converting enzyme suitable for large-scale studies. J Hypertens. 1996;14:719–727. doi: 10.1097/00004872-199606000-00007. [DOI] [PubMed] [Google Scholar]
- 43.Silverstein E, Pertschuk LP, Friedland J. Immunofluorescent detection of angiotensin-converting enzyme (ACE) in Gaucher cells. Am J Med. 1980;69:408–410. doi: 10.1016/0002-9343(80)90012-1. [DOI] [PubMed] [Google Scholar]
- 44.Wei L, Alhenc-Gelas F, Corvol P, Clauser E. The two homologous domains of human angiotensin I-converting enzyme are both catalytically active. J Biol Chem. 1991;266:9002–9008. [PubMed] [Google Scholar]
- 45.Jaspard E, Wei L, Alhenc-Gelas F. Differences in properties and enzymatic specificities between the two active sites of human angiotensin I-converting enzyme: studies with bradykinin and other natural peptides. J Biol Chem. 1993;268:9496–9503. [PubMed] [Google Scholar]
- 46.Georgiadis D, Beau F, Czarny B, Cotton J, Yiotakis A, Dive V. Roles of the two active sites of somatic angiotensin-converting enzyme in the cleavage of angiotensin I and bradykinin: insights from selective inhibitors. Circ Res. 2003;93:148–154. doi: 10.1161/01.RES.0000081593.33848.FC. [DOI] [PubMed] [Google Scholar]
- 47.Skirgello OE, Binevski PV, Pozdnev VF, Kost OA. Kinetic probes for inter-domain cooperation in human somatic angiotensin-converting enzyme. Biochem J. 2005;391:641–647. doi: 10.1042/BJ20050702. [DOI] [PMC free article] [PubMed] [Google Scholar]
- 48.Danilov SM, Balyasnikova IV, Albrecht RF, II, Kost OA. Simultaneous determination of ACE activity with two substrates provides information on the status of somatic ACE and allows detection of inhibitors in human blood. J Cardiovasc Pharmacol. 2008;52:90–103. doi: 10.1097/FJC.0b013e31817fd3bc. [DOI] [PubMed] [Google Scholar]
- 49.Danilov SM, Wade MS, Schwager SL, Douglas RG, Nesterovitch AB, Popova IA, et al. A novel angiotensin I-converting enzyme mutation (S333W) impairs N-domain enzymatic cleavage of the anti-fibrotic peptide. AcSDKP, PLoS One. 2014;9(2):e88001. doi: 10.1371/journal.pone.0088001. [DOI] [PMC free article] [PubMed] [Google Scholar]
- 50.Gordon K, Balyasnikova IV, Nesterovitch AB, Schwartz DE, Sturrock ED, Danilov SM. Fine epitope mapping of monoclonal antibodies 9B9 and 3G8, to the N domain of human angiotensin I-converting enzyme (ACE) defines a region involved in regulating ACE dimerization and shedding. Tissue Antigens. 2010;75:136–150. doi: 10.1111/j.1399-0039.2009.01416.x. [DOI] [PubMed] [Google Scholar]
- 51.Balyasnikova IV, Skirgello OE, Binevski PV, Nesterovitch AB, Albrecht RF, II, Kost OA, et al. Monoclonal antibodies 1G12 and 6A12 to the N-domain of human angiotensin-converting enzyme: fine epitope mapping and antibody-based method for revelation and quantification of ACE inhibitors in the human blood. J Proteome Res. 2007;6:1580–1594. doi: 10.1021/pr060658x. [DOI] [PubMed] [Google Scholar]
- 52.Nielsen JL, Rømer FK, Ellegaard J. Serum angiotensin-converting enzyme and blood monocytes in splenectomized individuals. Acta Haematol. 1982;67:132–135. doi: 10.1159/000207040. [DOI] [PubMed] [Google Scholar]
- 53.Danilov SM, Watermeyer JM, Balyasnikova IV, Gordon K, Kugaevskaya EV, Elisseeva YE, et al. Fine epitope mapping of mAb 5F1 reveals anticatalytic activity toward the N domain of human angiotensin-converting enzyme. Biochemistry. 2007;46:9019–9031. doi: 10.1021/bi700489v. [DOI] [PubMed] [Google Scholar]
- 54.Ashwell G, Harford J. Carbohydrate-specific receptors of the liver. Ann Rev Biochem. 1982;51:531–554. doi: 10.1146/annurev.bi.51.070182.002531. [DOI] [PubMed] [Google Scholar]
- 55.Ivanova M, Limgala RP, Changsila E, Kamath R, Ioanou C, Goker-Alpan O. Gaucheromas: when macrophages promote tumor formation and dissemination. Blood Cells Mol Dis. 2018;68:100–105. doi: 10.1016/j.bcmd.2016.10.018. [DOI] [PubMed] [Google Scholar]
- 56.Lieberman J, Sastre A. An angiotensin-converting enzyme (ACE) inhibitor in human serum. Increased sensitivity of the serum ACE assay for detecting active sarcoidosis. Chest. 1986;90:869–875. doi: 10.1378/chest.90.6.869. [DOI] [PubMed] [Google Scholar]
- 57.Elisseeva YuE, Pavlikhina LV, Shavghulidze TV, Messina E, Giacomello A, Salerno C, et al. Angiotensin-converting enzyme activator from purified human neutrophils, Biochem. Mol Biol Int. 1993;30:665–673. [PubMed] [Google Scholar]
- 58.Elisseeva YuE, Sinanjan ES, Kugaevskaja EV. The presence of angiotensin-converting enzyme activator in bovine tissues. Biochem Mol Biol Int. 1994;32:173–180. [PubMed] [Google Scholar]
- 59.Lokshina LA, Gureeva TA, Elisseeva YE, Golubeva NV, Kugaevskaya EV, Lubkova ON, et al. Proteolytic enzymes in human leukemic lymphoid cells. III. Aminopeptidases, angiotensin-converting enzyme, and its inhibitor in cells of different immunological phenotype. Biochemistry (Mosc) 1999;64:448–455. [PubMed] [Google Scholar]
Associated Data
This section collects any data citations, data availability statements, or supplementary materials included in this article.